An official website of the United States government
 United States Department of Labor

Prices in the West Region, as measured by the Consumer Price Index for All Urban Consumers (CPI-U), advanced 0.6 percent in April, the U.S. Bureau of Labor Statistics reported today.
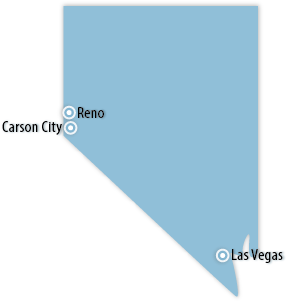
Employment rose in Nevada’s two large counties from September 2022 to September 2023, the U.S. Bureau of Labor Statistics reported today.
Prices in the West Region, as measured by the Consumer Price Index for All Urban Consumers (CPI-U), advanced 0.9 percent in March, the U.S. Bureau of Labor Statistics reported today.
| Data Series | Back Data |
Oct 2023 |
Nov 2023 |
Dec 2023 |
Jan 2024 |
Feb 2024 |
Mar 2024 |
|---|---|---|---|---|---|---|---|
Civilian Labor Force(1) |
(r)1,613.2 | (r)1,613.3 | (r)1,612.9 | 1,614.2 | 1,614.4 | (p)1,614.3 | |
Employment(1) |
(r)1,527.9 | (r)1,527.9 | (r)1,527.7 | 1,529.4 | 1,530.6 | (p)1,531.5 | |
Unemployment(1) |
(r)85.3 | (r)85.4 | (r)85.2 | 84.8 | 83.8 | (p)82.8 | |
Unemployment Rate(2) |
(r)5.3 | (r)5.3 | (r)5.3 | 5.3 | 5.2 | (p)5.1 | |
Total Nonfarm(3) |
1,557.7 | 1,566.4 | 1,571.8 | 1,571.3 | 1,573.3 | (p)1,576.0 | |
12-month % change |
3.4 | 4.0 | 4.1 | 3.7 | 3.3 | (p)3.4 | |
Mining and Logging(3) |
14.9 | 15.1 | 15.2 | 15.5 | 15.6 | (p)15.4 | |
12-month % change |
-0.7 | 3.4 | 1.3 | 4.7 | 5.4 | (p)3.4 | |
Construction(3) |
116.0 | 118.5 | 118.7 | 119.0 | 118.5 | (p)120.2 | |
12-month % change |
5.3 | 7.5 | 7.3 | 7.7 | 6.6 | (p)8.4 | |
Manufacturing(3) |
67.2 | 68.5 | 69.2 | 69.6 | 69.5 | (p)69.2 | |
12-month % change |
0.7 | 3.2 | 4.2 | 4.7 | 3.9 | (p)3.4 | |
Trade, Transportation, and Utilities(3) |
299.5 | 299.7 | 299.8 | 301.6 | 301.3 | (p)300.5 | |
12-month % change |
2.7 | 3.2 | 2.9 | 2.8 | 2.3 | (p)1.8 | |
Information(3) |
19.4 | 19.4 | 19.1 | 19.3 | 19.4 | (p)19.6 | |
12-month % change |
3.2 | 2.1 | 0.0 | 0.5 | -2.0 | (p)2.1 | |
Financial Activities(3) |
77.6 | 77.4 | 77.7 | 77.9 | 77.6 | (p)77.6 | |
12-month % change |
1.2 | 1.0 | 1.7 | 2.1 | 1.7 | (p)2.0 | |
Professional & Business Services(3) |
217.8 | 218.4 | 219.3 | 215.6 | 217.7 | (p)217.0 | |
12-month % change |
2.3 | 2.7 | 3.2 | 0.9 | 1.9 | (p)1.1 | |
Education & Health Services(3) |
165.9 | 166.7 | 167.2 | 167.4 | 167.8 | (p)168.0 | |
12-month % change |
3.7 | 3.8 | 4.1 | 3.5 | 3.4 | (p)3.2 | |
Leisure & Hospitality(3) |
354.3 | 356.3 | 358.9 | 358.3 | 358.6 | (p)361.1 | |
12-month % change |
3.4 | 3.8 | 4.2 | 4.2 | 3.9 | (p)4.6 | |
Other Services(3) |
45.7 | 46.5 | 46.3 | 46.4 | 45.9 | (p)45.6 | |
12-month % change |
2.7 | 4.0 | 3.1 | 4.3 | 3.1 | (p)2.5 | |
Government(3) |
179.4 | 179.9 | 180.4 | 180.7 | 181.4 | (p)181.8 | |
12-month % change |
7.1 | 6.9 | 6.7 | 5.7 | 4.4 | (p)4.3 | |
|
Footnotes |
|||||||