An official website of the United States government
An official website of the United States government
The .gov means it's official.
Federal government websites often end in .gov or .mil. Before sharing sensitive information,
make sure you're on a federal government site.
The site is secure.
The
https:// ensures that you are connecting to the official website and that any
information you provide is encrypted and transmitted securely.
24-704-SAN
Thursday, April 18, 2024
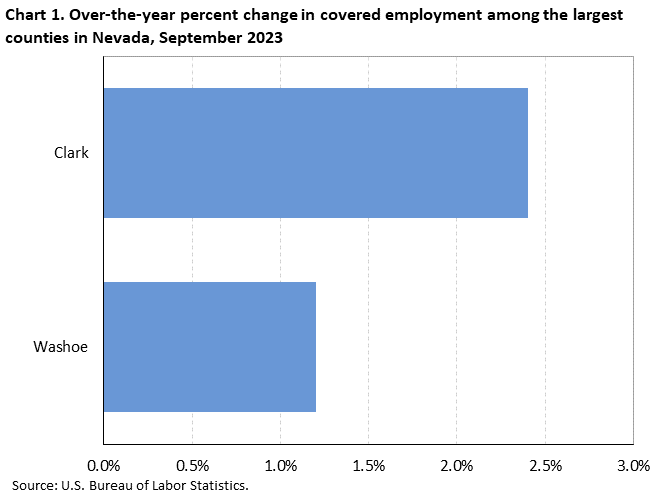
Employment rose in Nevada’s two large counties from September 2022 to September 2023, the U.S. Bureau of Labor Statistics reported today. (Large counties are those with annual average employment levels of 75,000 or more in 2022.) Regional Commissioner Chris Rosenlund noted that Clark County’s employment increased 2.4 percent and Washoe County’s employment increased 1.2 percent. (See chart 1 and table 1.)
National employment increased 1.5 percent over the year, with 309 of the 360 largest U.S. counties reporting gains. Hall, GA, had the largest increase in employment (+5.4 percent). Elkhart, IN, had the largest over-the-year percentage decrease in employment (-7.3 percent).
Among the two largest counties in Nevada, employment was higher in Clark County (1,102,500) in September 2023. Within Clark County’s private industry, accommodation and food services accounted for the largest employment. Together, the two largest Nevada counties accounted for 87.4 percent of total employment within the state. Nationwide, the 360 largest counties made up 72.9 percent of total U.S. employment.
Employment and wage levels (but not over-the-year changes) are also available for the 15 counties in Nevada with employment below 75,000. Wage levels in 10 of the 15 smaller counties were below the national average of $1,334 in the third quarter of 2023. (See table 2.)
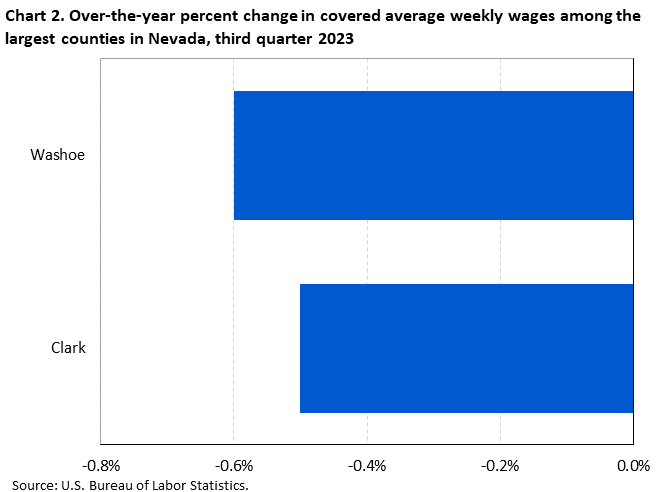
Large county wage changesFrom the third quarter of 2022 to the third quarter of 2023, average weekly wages decreased 0.6 percent in Washoe County and 0.5 percent in Clark County. (See chart 2.) Nationwide, wages increased by 0.1 percent over the year. Among the 360 largest counties in the United States, 169 had over-the-year wage increases. Clayton, GA, had the largest percentage wage increase (+7.7 percent). Elkhart, IN, had the largest over-the-year percentage decrease (-6.0 percent).
Large county average weekly wagesAverage weekly wages in Washoe County ($1,261) and Clark County ($1,159) were below the national average of $1,334 in the third quarter of 2023.
Among the largest U.S. counties, 92 reported average weekly wages above the U.S. average in the third quarter of 2023. San Mateo, CA, had the highest average weekly wage ($3,288). Average weekly wages were below the national average in the remaining 268 counties. Hidalgo, TX, had the lowest average weekly wage ($793).
Smaller county average weekly wagesAmong the 15 smaller counties in Nevada—those with employment below 75,000—5 reported an average weekly wage above the national average. Eureka County ($2,139) reported the highest average weekly wage in the state, while Lincoln County ($932) reported the lowest.
When all 17 counties in Nevada were considered, 5 reported average weekly wages of less than $1,199. Six counties had average weekly wages ranging from $1,200 to $1,299, two had wages ranging from $1,300 to $1,399, and four had wages of $1,400 or higher. (See map 1.)
Additional statistics and other informationQCEW data for states have been included in this release in table 3. For additional information about quarterly employment and wages data, please read the Technical Note for the County Employment and Wages News Release or visit the Quarterly Census of Employment and Wages website.
Employment and Wages Annual Averages Online features comprehensive information by detailed industry on establishments, employment, and wages for the nation and all states. This publication is typically published in September of the following year of the reference period or shortly after the QCEW first quarter full data update.
Information in this release will be made available to individuals with sensory impairments upon request. Voice phone: (202) 691-5200; Telecommunications Relay Service: 7-1-1.
The County Employment and Wages release for the fourth quarter 2023 is scheduled to be released on Wednesday, May 22, 2024. The County Employment and Wages full data update for the fourth quarter 2023 is scheduled to be released on Wednesday, June 5, 2024.
| Area | Establishments, third quarter (thousands) |
Employment | Average weekly wage (1) | |||||
|---|---|---|---|---|---|---|---|---|
| September 2023 (thousands) |
Percent change, September 2022–23 (2) |
National ranking by percent change (3) |
Third quarter 2023 ($) |
National ranking by level (3) |
Percent change, third quarter 2022–23 (2) |
National ranking by percent change (3) |
||
|
United States (4) |
12,026.4 | 153,772.8 | 1.5 | -- | 1,334 | -- | 0.1 | -- |
|
Nevada |
107.5 | 1,537.8 | 2.8 | -- | 1,201 | 27 | -0.3 | 36 |
|
Clark |
62.0 | 1,102.5 | 2.4 | 59 | 1,159 | 208 | -0.5 | 207 |
|
Washoe |
16.2 | 241.3 | 1.2 | 181 | 1,261 | 136 | -0.6 | 217 |
|
Footnotes: |
||||||||
|
Note: Data are preliminary. Covered employment and wages includes workers covered by Unemployment Insurance (UI) and Unemployment Compensation for Federal Employees (UCFE) programs. |
||||||||
| Area | Establishments | Employment September 2023 | Average weekly wage ($) (1) |
|---|---|---|---|
|
United States (2) |
12,026,378 | 153,772,811 | 1,334 |
|
Nevada |
107,545 | 1,537,765 | 1,201 |
|
Churchill |
617 | 8,946 | 1,127 |
|
Clark |
61,961 | 1,102,450 | 1,159 |
|
Douglas |
1,971 | 20,247 | 1,205 |
|
Elko |
1,386 | 22,544 | 1,218 |
|
Esmeralda |
29 | 351 | 1,259 |
|
Eureka |
51 | 4,354 | 2,139 |
|
Humboldt |
480 | 7,857 | 1,314 |
|
Lander |
125 | 3,773 | 1,771 |
|
Lincoln |
122 | 1,307 | 932 |
|
Lyon |
1,081 | 13,593 | 1,073 |
|
Mineral |
85 | 1,175 | 1,071 |
|
Nye |
928 | 13,655 | 1,247 |
|
Pershing |
99 | 1,882 | 1,464 |
|
Storey |
239 | 19,466 | 1,432 |
|
Washoe |
16,244 | 241,318 | 1,261 |
|
White Pine |
269 | 4,582 | 1,343 |
|
Carson City |
2,071 | 31,557 | 1,240 |
|
Footnotes: |
|||
|
Note: Data are preliminary. Covered employment and wages includes workers covered by Unemployment Insurance (UI) and Unemployment Compensation for Federal Employees (UCFE) programs. |
|||
| State | Establishments, third quarter (thousands) |
Employment | Average weekly wage (1) | ||||
|---|---|---|---|---|---|---|---|
| September 2023 (thousands) |
Percent change, September 2022–23 |
Third quarter 2023 ($) |
National ranking by level |
Percent change, third quarter 2022–23 |
National ranking by percent change |
||
|
United States (2) |
12,026.4 | 153,772.8 | 1.5 | 1,334 | -- | 0.1 | -- |
|
Alabama |
157.7 | 2,079.6 | 1.8 | 1,121 | 35 | 0.4 | 24 |
|
Alaska |
25.4 | 335.4 | 3.1 | 1,328 | 15 | 1.8 | 2 |
|
Arizona |
223.1 | 3,163.8 | 2.1 | 1,248 | 20 | -0.2 | 33 |
|
Arkansas |
103.1 | 1,284.3 | 1.4 | 1,036 | 50 | 0.0 | 30 |
|
California |
1,785.3 | 18,102.2 | 0.2 | 1,613 | 4 | 0.8 | 12 |
|
Colorado |
261.9 | 2,888.7 | 2.3 | 1,431 | 8 | -0.5 | 40 |
|
Connecticut |
150.0 | 1,679.0 | 1.4 | 1,480 | 6 | -0.6 | 42 |
|
Delaware |
42.3 | 472.5 | 2.1 | 1,269 | 18 | -1.6 | 51 |
|
District of Columbia |
52.1 | 758.7 | 0.8 | 2,159 | 1 | 1.4 | 4 |
|
Florida |
894.2 | 9,668.6 | 2.5 | 1,218 | 25 | -0.1 | 31 |
|
Georgia |
392.5 | 4,807.3 | 1.5 | 1,249 | 19 | -0.2 | 33 |
|
Hawaii |
57.4 | 627.9 | 0.7 | 1,226 | 23 | 1.1 | 8 |
|
Idaho |
95.3 | 852.7 | 2.1 | 1,068 | 46 | 0.5 | 19 |
|
Illinois |
411.3 | 6,044.1 | 0.8 | 1,346 | 12 | -1.0 | 48 |
|
Indiana |
192.3 | 3,175.6 | 1.0 | 1,115 | 36 | -0.7 | 45 |
|
Iowa |
110.5 | 1,559.7 | 1.0 | 1,112 | 37 | -0.6 | 42 |
|
Kansas |
99.7 | 1,419.7 | 1.3 | 1,087 | 43 | 0.3 | 25 |
|
Kentucky |
152.2 | 1,985.4 | 2.0 | 1,092 | 42 | 1.0 | 11 |
|
Louisiana |
155.4 | 1,886.6 | 0.5 | 1,107 | 40 | 0.6 | 15 |
|
Maine |
64.9 | 649.1 | 1.5 | 1,129 | 34 | 1.1 | 8 |
|
Maryland |
190.1 | 2,689.7 | 0.8 | 1,424 | 9 | 0.5 | 19 |
|
Massachusetts |
295.8 | 3,653.5 | 0.5 | 1,643 | 3 | -0.7 | 45 |
|
Michigan |
325.5 | 4,422.2 | 1.9 | 1,228 | 22 | -0.5 | 40 |
|
Minnesota |
206.4 | 2,923.5 | 1.4 | 1,329 | 14 | -1.3 | 50 |
|
Mississippi |
88.3 | 1,163.1 | 0.9 | 927 | 51 | -0.6 | 42 |
|
Missouri |
250.4 | 2,894.1 | 1.5 | 1,152 | 31 | 0.3 | 25 |
|
Montana |
66.9 | 513.2 | 1.5 | 1,072 | 45 | 1.2 | 6 |
|
Nebraska |
78.3 | 1,014.0 | 2.3 | 1,111 | 38 | -0.4 | 37 |
|
Nevada |
107.5 | 1,537.8 | 2.8 | 1,201 | 27 | -0.3 | 36 |
|
New Hampshire |
66.3 | 687.6 | 1.4 | 1,350 | 11 | -1.2 | 49 |
|
New Jersey |
326.8 | 4,256.9 | 1.9 | 1,456 | 7 | -0.4 | 37 |
|
New Mexico |
67.9 | 857.2 | 1.6 | 1,096 | 41 | 1.1 | 8 |
|
New York |
701.8 | 9,525.5 | 1.7 | 1,610 | 5 | 0.2 | 28 |
|
North Carolina |
375.6 | 4,835.1 | 2.0 | 1,222 | 24 | 1.2 | 6 |
|
North Dakota |
35.8 | 428.3 | 1.9 | 1,205 | 26 | 1.3 | 5 |
|
Ohio |
344.4 | 5,488.1 | 1.3 | 1,185 | 30 | -0.1 | 31 |
|
Oklahoma |
131.1 | 1,684.9 | 2.1 | 1,052 | 48 | 0.5 | 19 |
|
Oregon |
203.4 | 2,001.8 | 1.0 | 1,301 | 16 | 0.5 | 19 |
|
Pennsylvania |
392.5 | 5,996.0 | 1.3 | 1,283 | 17 | -0.9 | 47 |
|
Rhode Island |
48.2 | 495.1 | 1.6 | 1,234 | 21 | 0.7 | 14 |
|
South Carolina |
179.7 | 2,256.4 | 2.6 | 1,086 | 44 | 0.6 | 15 |
|
South Dakota |
39.8 | 457.6 | 2.0 | 1,058 | 47 | 0.6 | 15 |
|
Tennessee |
221.2 | 3,216.1 | 0.4 | 1,199 | 28 | 0.1 | 29 |
|
Texas |
831.9 | 13,731.1 | 2.6 | 1,336 | 13 | 0.3 | 25 |
|
Utah |
137.2 | 1,706.1 | 2.3 | 1,195 | 29 | 0.8 | 12 |
|
Vermont |
32.4 | 306.5 | 1.4 | 1,141 | 32 | -0.2 | 33 |
|
Virginia |
315.8 | 4,053.6 | 1.8 | 1,383 | 10 | 0.5 | 19 |
|
Washington |
242.6 | 3,618.1 | 1.3 | 1,682 | 2 | 1.5 | 3 |
|
West Virginia |
59.1 | 695.3 | 1.8 | 1,044 | 49 | 0.6 | 15 |
|
Wisconsin |
206.2 | 2,938.6 | 1.0 | 1,133 | 33 | -0.4 | 37 |
|
Wyoming |
30.6 | 285.2 | 2.1 | 1,111 | 38 | 2.4 | 1 |
|
Puerto Rico |
53.6 | 940.2 | 1.6 | 633 | (3) | 2.8 | (3) |
|
Virgin Islands |
3.8 | 35.1 | 1.9 | 953 | (3) | -4.0 | (3) |
|
Footnotes: |
|||||||
|
Note: Data are preliminary. Covered employment and wages includes workers covered by Unemployment Insurance (UI) and Unemployment Compensation for Federal Employees (UCFE) programs. |
|||||||
Last Modified Date: Thursday, April 18, 2024