
An official website of the United States government
An official website of the United States government
The .gov means it's official.
Federal government websites often end in .gov or .mil. Before sharing sensitive information,
make sure you're on a federal government site.
The site is secure.
The
https:// ensures that you are connecting to the official website and that any
information you provide is encrypted and transmitted securely.
Tuesday, March 26, 2024
Women have always been an integral part of BLS operations, even from our beginnings in 1884. In today’s blog, I’d like to highlight some of the important contributions of the women of the Bureau of Labor Statistics.
Commissioner Wright (the first BLS Commissioner) appointed Florence Kelley as director of the Chicago area to collect information on the working and living conditions of workers in some of the most poverty-stricken areas of Chicago. In the spring and summer of 1893, Florence Kelley and her colleagues went door to door in tenements and sweatshops to ask questions about wages, people living in the household, and the weeks the wage earner had been employed. These data collection efforts led to the BLS report to Congress, “The Slums of Baltimore, Chicago, New York, and Philadelphia.” Florence Kelley’s work was depicted in a series of maps illustrating the living conditions in Chicago, such as the map below that shows the average earnings of a family each week.
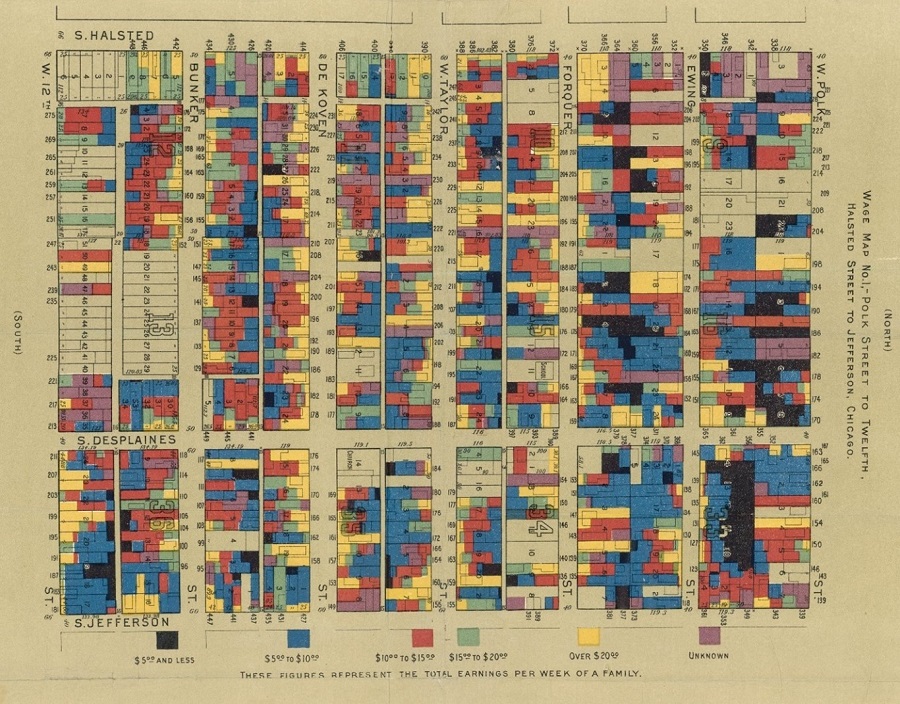
As published in "Hull House Maps and Papers, 1895,” a map of housing units colored to represent the total earnings per week of a family for the section of Chicago, Illinois, from Polk Street to Twelfth, Halstead Street to Jefferson.
Source: Hull House Maps and Papers, 1895, public domain
Soon thereafter, also in Chicago, Caroline Hunt was commissioned to help further collect and analyze data on working and living conditions, particularly of Italian immigrants in Chicago. Caroline Hunt’s work can be found in an 1897 BLS bulletin “The Italians in Chicago.” The report details that even among those living in poor conditions, Italians were suffering even more. Italians tended to hold the lower skilled, lower paid jobs. Not only were Italians working lower paid jobs, but they were often out of work due to illness. “Out of a total of 6,773 persons 1,448, or 21.38 per cent, were reported as sick during the year… Excluding childbirth from consideration, the number of persons otherwise sick… was 1,185 or 17.50 per cent; excluding childbirth, the proportions for the four cities canvassed in the slum investigation were 1.85 per cent for Baltimore, 3.90 per cent for Chicago, 2.35 per cent for New York, and 2.03 per cent for Philadelphia.” The high proportions of illness led investigators to research diet and nutrition. The report includes an extensive section on nutrition among Italians and what they were eating. It’s no wonder that Caroline Hunt went on to become a home economics professor for the University of Wisconsin and later worked for the U.S. Department of Agriculture.
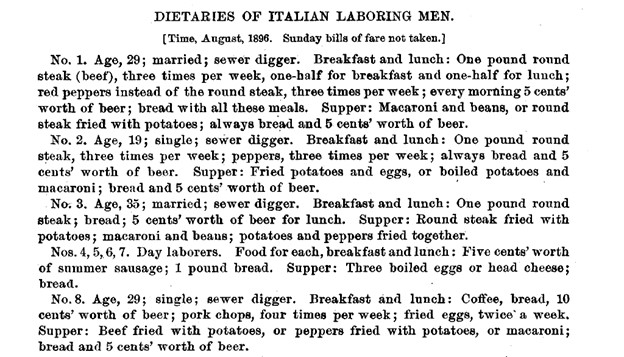
Diary of meals eaten by eight Italian laborers that were men as published in the BLS report “The Italians in Chicago.”
Source: United States. Bureau of Labor. "November 1897: Bulletin of the United States Bureau of Labor, No. 13, Volume II," Bulletin of the United States Bureau of Labor, Nos. 1 - 100 (November 1896). The Italians in Chicago
Women not only conducted pieces of investigations, but the very first BLS report on women, “Working Women in Large Cities” (1889) was collected, compiled, and issued by women. The study reported on women’s wages, hours of work, occupations, marital status, and industry of work—the same types of data we’re still interested in today. There were also some other details about women workers collected, such as church attendance and condition of the home.
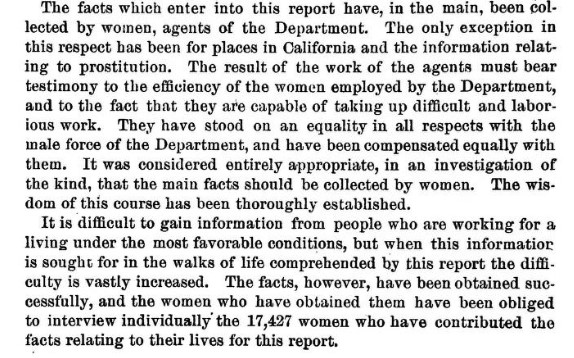
Excerpt from the BLS Report “Working Women in Large Cities.”
Source: United States. Department of Labor. "Fourth Annual Report of the Commissioner of Labor : Working Women in Large Cities," Annual Report of the Commissioner of Labor (1889).
In the 1890s depression, conditions were worsening and one of the big questions was if women (and children) were, in fact, replacing men in the workplace. In 1904, Hannah R. Sewall wrote “Child Labor in the United States.” This work detailed the ages, hours, and wages of children under 16 years old working in factories and canneries. In particular, the piece focuses on the poor working conditions and the various hazards of these workplaces.
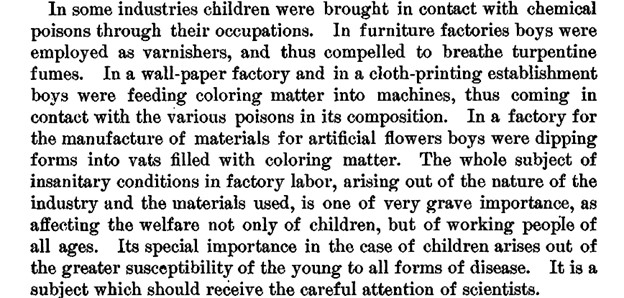
Excerpt from BLS Report “Child Labor in the United States” describing children’s contact with chemical poisons in the workplace.
Source: Sewall, Hannah Robie, 1861-. "Child Labor in the United States," Bulletin of the United States Bureau of Labor, No. 52, Volume IX, Nos. 1 - 100 (May 1904) : 5-157.
Not long after publishing this report, true coalition around creating more comprehensive protection for children at work began.
I could go on and on about the important roles women at BLS have played over the years.
Alice Hamilton, scientist and occupational health pioneer, served as special investigator to BLS for several years beginning in 1911. She performed a landmark study on the manufacture of white lead and lead oxide, which were pigments commonly used in the paint industry. In this and subsequent studies, Alice Hamilton’s methods laid the groundwork for how investigations in workplace epidemiology would be performed. Alice Hamilton also investigated the poisonous effects of manufacturing explosives. Her work led to some of the first workplace safety laws, ensuring better working conditions for the nation’s workforce.
Mary K. Conyngton wrote for the BLS Monthly Labor Review on a variety of subjects such as women at work and children in the labor force, but she also touched on areas of reform around workers’ compensation and government pay. In her article “Extent and Distribution of Old-Age Dependency in the United States” in the January 1934 edition of the Monthly Labor Review she notes that from 1920 to 1930, the proportion of the population over 65 rose 0.8 percentage point and about two-thirds of this population was not gainfully employed. This article came at a time when only a few states had old-age pensions available and about a year before President Franklin D. Roosevelt signed the Social Security Act. Her article helped lay the groundwork for what a social security system might cost.
Rapt attention to the CPI isn’t a recent phenomenon. In April 1942, BLS published a pamphlet entitled “Questions and Answers on the Cost-of-Living Index.” This pamphlet described how BLS made adjustments for disappearing and rationed civilian goods during the war. Because of the increased rationing of goods, there was an undercurrent of distrust that the cost-of-living index didn’t fully reflect the reality of wage earners. To that end, unions began conducting their own price data studies which in some areas showed divergence from the BLS-published numbers. In 1943, Aryness Joy Wickens was dispatched on a public education campaign to advise on how BLS collected prices and constructed a cost-of-living figure in cities. At the conclusion of this educational campaign union figures began to align with those the Bureau published.
Aryness Joy Wickens’s contributions didn’t stop there. She later became chief of all price index production and later deputy and acting BLS Commissioner. In her career, she amusingly convinced Secretary of Labor Frances Perkins to support revising the cost-of-living index. Excerpted from page 69 of “Reminiscences of Aryness Joy Wickens" (1957) from the Rare Book and Manuscript Library, Oral History Archives at Columbia University in the City of New York:
“Miss Perkins, this index really does need revision. It must appear to you that the list of articles priced still contains high button shoes and women’s muslin underwear.”
"Oh, no!” she said.
“Oh, yes,” I said. "We may not be able to get prices on them, but they're still in the index.”
“Well,” she said, "Well, of course you’ll have to revise this index!”
The story doesn’t end here. Women continue to make their indelible mark on this 140-year-old institution. From worker safety, employment, and wages to prices and productivity, we’re honored by the women trailblazers of BLS both past and present. Happy Women’s History Month!