
An official website of the United States government
An official website of the United States government
The .gov means it's official.
Federal government websites often end in .gov or .mil. Before sharing sensitive information,
make sure you're on a federal government site.
The site is secure.
The
https:// ensures that you are connecting to the official website and that any
information you provide is encrypted and transmitted securely.
The Local Area Unemployment Statistics (LAUS) program produces monthly and annual employment, unemployment, and labor force data for Census regions and divisions, States, counties, metropolitan areas, and many cities, by place of residence. More »
Alabama
3.0%(p) in Mar 2024
![]()
Alaska
4.6%(p) in Mar 2024
![]()
Arizona
3.8%(p) in Mar 2024
![]()
Arkansas
3.5%(p) in Mar 2024
![]()
California
5.3%(p) in Mar 2024
![]()
Colorado
3.7%(p) in Mar 2024
![]()
Connecticut
4.5%(p) in Mar 2024
![]()
Delaware
3.9%(p) in Mar 2024
![]()
D.C.
5.2%(p) in Mar 2024
![]()
Florida
3.2%(p) in Mar 2024
![]()
Georgia
3.1%(p) in Mar 2024
![]()
Hawaii
3.1%(p) in Mar 2024
![]()
Idaho
3.3%(p) in Mar 2024
![]()
Illinois
4.8%(p) in Mar 2024
![]()
Indiana
3.5%(p) in Mar 2024
![]()
Iowa
2.9%(p) in Mar 2024
![]()
Kansas
2.7%(p) in Mar 2024
![]()
Kentucky
4.5%(p) in Mar 2024
![]()
Louisiana
4.4%(p) in Mar 2024
![]()
Maine
3.3%(p) in Mar 2024
![]()
Maryland
2.5%(p) in Mar 2024
![]()
Massachusetts
2.9%(p) in Mar 2024
![]()
Michigan
3.9%(p) in Mar 2024
![]()
Minnesota
2.7%(p) in Mar 2024
![]()
Mississippi
3.0%(p) in Mar 2024
![]()
Missouri
3.3%(p) in Mar 2024
![]()
Montana
3.3%(p) in Mar 2024
![]()
Nebraska
2.5%(p) in Mar 2024
![]()
Nevada
5.1%(p) in Mar 2024
![]()
New Hampshire
2.6%(p) in Mar 2024
![]()
New Jersey
4.8%(p) in Mar 2024
![]()
New Mexico
3.8%(p) in Mar 2024
![]()
New York
4.3%(p) in Mar 2024
![]()
North Carolina
3.5%(p) in Mar 2024
![]()
North Dakota
2.0%(p) in Mar 2024
![]()
Ohio
3.8%(p) in Mar 2024
![]()
Oklahoma
3.5%(p) in Mar 2024
![]()
Oregon
4.2%(p) in Mar 2024
![]()
Pennsylvania
3.4%(p) in Mar 2024
![]()
Puerto Rico
5.8% in Mar 2024
![]()
Rhode Island
4.0%(p) in Mar 2024
![]()
South Carolina
3.1%(p) in Mar 2024
![]()
South Dakota
2.1%(p) in Mar 2024
![]()
Tennessee
3.2%(p) in Mar 2024
![]()
Texas
3.9%(p) in Mar 2024
![]()
Utah
2.8%(p) in Mar 2024
![]()
Vermont
2.2%(p) in Mar 2024
![]()
Virginia
2.9%(p) in Mar 2024
![]()
Washington
4.8%(p) in Mar 2024
![]()
West Virginia
4.3%(p) in Mar 2024
![]()
Wisconsin
3.0%(p) in Mar 2024
![]()
Wyoming
2.8%(p) in Mar 2024
![]()
04/19/2024
In March, unemployment rates were lower in 6 states, higher in 1 state, and stable
in 43 states and the District of Columbia. Nonfarm payroll employment increased in
5 states and was essentially unchanged in 45 states and the District.
HTML
|
PDF
|
RSS
|
Charts
05/01/2024
Jobless rates were higher in March than a year earlier in 269 of the 389 metropolitan areas,
lower in 89, and unchanged in 31. Nonfarm payroll employment increased over the year in 51
metropolitan areas, decreased in 5, and was essentially unchanged in 333.
HTML
|
PDF
|
RSS
|
Charts
03/01/2024
In 2023, annual average unemployment rates decreased in 6 states, increased in 2, and
were little changed in 42 states and the District of Columbia. Employment-population
ratios increased in 10 states and were little changed in 40 states and the District.
HTML
|
PDF
|
RSS
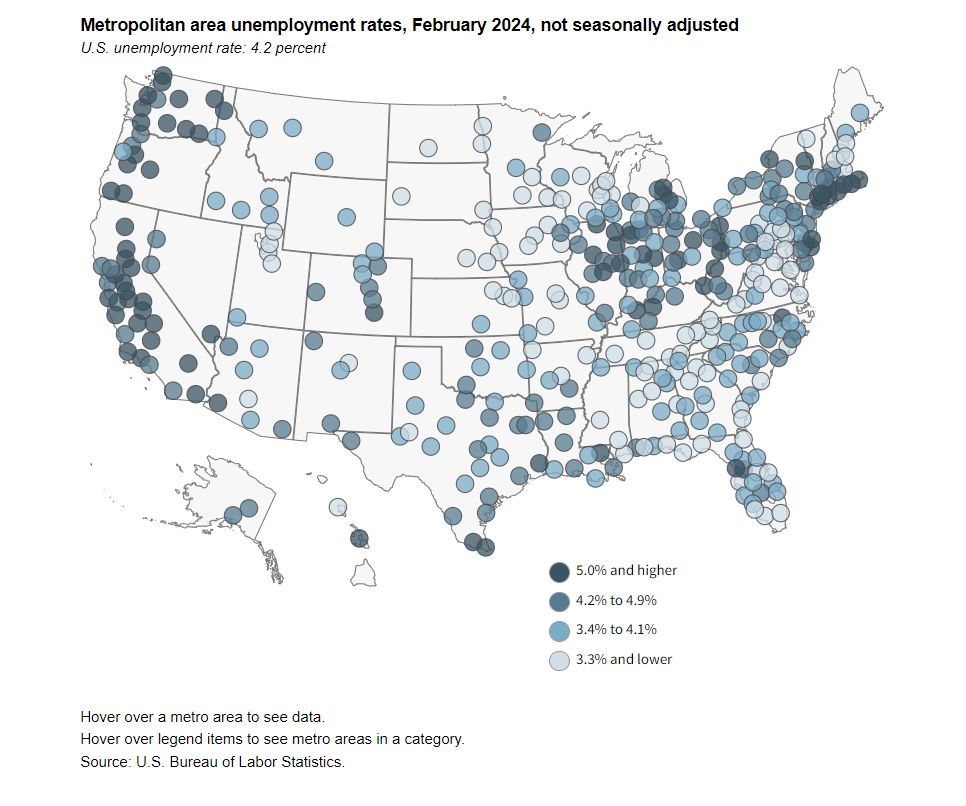
In February 2024, Ames, Iowa, had the lowest unemployment rate, 1.9 percent, among metropolitan areas. The next lowest rate was in Burlington-South Burlington, Vermont, 2.0 percent. El Centro, California, had the highest rate, 17.2 percent. read more »