An official website of the United States government
 United States Department of Labor

Prices in the Midwest Region, as measured by the Consumer Price Index for All Urban Consumers (CPI-U), advanced 0.5 percent in April.
Prices in the Midwest Region, as measured by the Consumer Price Index for All Urban Consumers (CPI-U), advanced 0.7 percent in March.
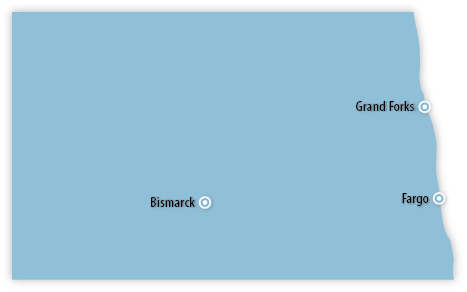
North Dakota had 26,000 job openings in January 2024, unchanged from December, the U.S. Bureau of Labor Statistics reported today.
| Data Series | Back Data |
Oct 2023 |
Nov 2023 |
Dec 2023 |
Jan 2024 |
Feb 2024 |
Mar 2024 |
|---|---|---|---|---|---|---|---|
Civilian Labor Force(1) |
(r)416.8 | (r)417.0 | (r)417.1 | 417.4 | 417.6 | (p)417.8 | |
Employment(1) |
(r)409.0 | (r)409.1 | (r)409.2 | 409.4 | 409.4 | (p)409.6 | |
Unemployment(1) |
(r)7.9 | (r)7.9 | (r)7.9 | 8.0 | 8.2 | (p)8.2 | |
Unemployment Rate(2) |
(r)1.9 | (r)1.9 | (r)1.9 | 1.9 | 2.0 | (p)2.0 | |
Total Nonfarm(3) |
440.4 | 440.4 | 440.6 | 440.8 | 439.9 | (p)439.6 | |
12-month % change |
2.0 | 1.7 | 1.8 | 1.4 | 0.9 | (p)0.7 | |
Mining and Logging(3) |
18.5 | 18.7 | 18.5 | 18.8 | 18.9 | (p)19.1 | |
12-month % change |
8.2 | 8.1 | 5.7 | 6.8 | 5.6 | (p)5.5 | |
Construction(3) |
27.8 | 27.4 | 27.5 | 26.9 | 26.8 | (p)27.0 | |
12-month % change |
4.9 | 1.5 | 3.0 | -3.9 | -5.3 | (p)-2.9 | |
Manufacturing(3) |
28.8 | 28.7 | 28.6 | 29.1 | 28.9 | (p)28.7 | |
12-month % change |
4.0 | 3.6 | 2.9 | 4.3 | 2.8 | (p)1.8 | |
Trade, Transportation, and Utilities(3) |
93.0 | 93.2 | 93.4 | 93.2 | 93.4 | (p)93.9 | |
12-month % change |
2.3 | 2.8 | 2.3 | 2.1 | 2.1 | (p)2.7 | |
Information(3) |
5.4 | 5.3 | 5.4 | 5.4 | 5.4 | (p)5.3 | |
12-month % change |
-6.9 | -8.6 | -5.3 | -5.3 | -5.3 | (p)-7.0 | |
Financial Activities(3) |
25.3 | 25.1 | 25.0 | 25.1 | 25.1 | (p)25.2 | |
12-month % change |
0.8 | 0.4 | 0.0 | 0.4 | 0.0 | (p)0.4 | |
Professional & Business Services(3) |
34.8 | 34.9 | 34.4 | 33.9 | 33.9 | (p)33.6 | |
12-month % change |
0.9 | -0.6 | -0.6 | -1.2 | -2.3 | (p)-3.2 | |
Education & Health Services(3) |
68.2 | 68.6 | 68.7 | 69.5 | 69.2 | (p)69.1 | |
12-month % change |
0.6 | 1.6 | 1.8 | 2.7 | 2.4 | (p)1.8 | |
Leisure & Hospitality(3) |
39.8 | 39.9 | 40.1 | 39.6 | 39.1 | (p)38.5 | |
12-month % change |
1.0 | 1.0 | 2.3 | -1.5 | -2.0 | (p)-3.3 | |
Other Services(3) |
15.4 | 15.4 | 15.7 | 15.7 | 15.8 | (p)15.5 | |
12-month % change |
2.7 | 3.4 | 5.4 | 4.7 | 4.6 | (p)2.6 | |
Government(3) |
83.4 | 83.2 | 83.3 | 83.6 | 83.4 | (p)83.7 | |
12-month % change |
1.8 | 0.8 | 1.1 | 1.7 | 1.5 | (p)1.3 | |
|
Footnotes |
|||||||