An official website of the United States government
An official website of the United States government
The .gov means it's official.
Federal government websites often end in .gov or .mil. Before sharing sensitive information,
make sure you're on a federal government site.
The site is secure.
The
https:// ensures that you are connecting to the official website and that any
information you provide is encrypted and transmitted securely.
17-449-SAN
Tuesday, April 18, 2017
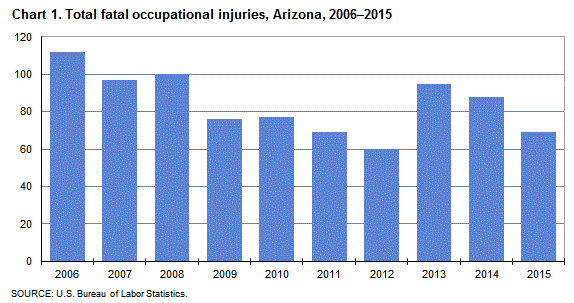
Fatal work injuries totaled 69 in 2015 for Arizona, the U.S. Bureau of Labor Statistics reported today. Assistant Commissioner for Regional Operations Richard Holden noted that the number of work-related fatalities in Arizona was down from 88 in the previous year. Fatal occupational injuries in the state have ranged from a high of 118 in 2000 to a low of 55 in 1993. (See chart 1.)
Nationwide, a total of 4,836 fatal work injuries were recorded in 2015, a slight increase from the 4,821 fatal injuries in 2014, according to the results from the Census of Fatal Occupational Injuries (CFOI) program.
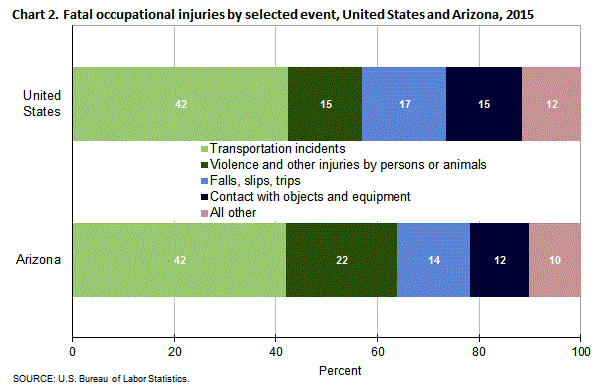
Type of incidentIn Arizona, transportation incidents resulted in 29 fatal work injuries and violence and other injuries by persons or animals accounted for 15 fatalities. These two major categories accounted for 64 percent of all workplace fatalities in the state. (See table 1.) The number of worker deaths from transportation incidents fell by four over the year and worker fatalities due to violence and other injuries by persons or animals were little changed.
Falls, slips, or trips was the third-most frequent fatal work event with 10 fatalities, down from 14 in the prior year. Contact with objects and equipment resulted in eight work-related deaths, similar to the count in 2014.
Nationally, transportation incidents were the most frequent fatal workplace event in 2015, accounting for approximately 42 percent of fatal work injuries. (See chart 2.) Falls, slips, or trips was the second-most frequent type of event (17 percent), followed by contact with objects and equipment (15 percent).
IndustryThe private transportation and warehousing industry sector had the largest number of fatalities in Arizona with 22, up from 16 in the previous year. (See table 2.) Transportation incidents were the most frequent fatal event in the transportation and warehousing sector with 15 worker deaths, followed by violence and other injuries by persons or animals with 6 fatalities. More than half of those fatally injured in this sector worked in truck transportation.
The private construction sector had 12 workplace fatalities, down from 17 in the previous year. Specialty trade contracters accounted for nine, or 75 percent, of the fatal injuries in this industry.
OccupationTransportation and material moving occupations and construction and extraction occupations had the highest number of workplace fatalities with 25 and 10, respectively. (See table 3.) The majority of the fatalities within the transportation and material moving group were heavy and tractor-trailer truck drivers (14). Construction trades workers accounted for 8 of the 10 fatalities among construction and extraction workers.
Additional highlights:Beginning with the 2015 reference year, CFOI will publish a single, annual release with no revisions. A similar schedule will be followed in subsequent years. Preliminary releases, which normally appeared in August or September in past years, will no longer be produced.
Background of the program. The Census of Fatal Occupational Injuries (CFOI), part of the BLS Occupational Safety and Health Statistics (OSHS) program, compiles a count of all fatal work injuries occurring in the U.S. during the calendar year. The CFOI program uses diverse state, federal, and independent data sources to identify, verify, and describe fatal work injuries. This ensures counts are as complete and accurate as possible. For the 2015 data, over 21,400 unique source documents were reviewed as part of the data collection process. For technical information and definitions for CFOI, please go to the BLS Handbook of Methods on the BLS web site at www.bls.gov/opub/hom/pdf/homch9.pdf.
Federal/State agency coverage. The Census of Fatal Occupational Injuries includes data for all fatal work injuries, whether the decedent was working in a job covered by the Occupational Safety and Health Administration (OSHA) or other federal or state agencies or was outside the scope of regulatory coverage. Thus, any comparison between the BLS fatality census counts and those released by other agencies should take into account the different coverage requirements and definitions being used by each agency.
Acknowledgments. BLS appreciates the efforts of all federal, state, local, and private sector entities that provided source documents used to identify fatal work injuries. Among these agencies are the Occupational Safety and Health Administration; the National Transportation Safety Board; the U.S. Coast Guard; the Mine Safety and Health Administration; the Office of Workers’ Compensation Programs (Federal Employees' Compensation and Longshore and Harbor Workers' Compensation divisions); the Federal Railroad Administration; the National Highway Traffic Safety Administration; state vital statistics registrars, coroners, and medical examiners; state departments of health, labor, and industrial relations and workers' compensation agencies; state and local police departments; and state farm bureaus.
Information in this release will be made available to sensory impaired individuals upon request. Voice phone: (202) 691-5200. Federal Relay Service: (800) 877-8339.
| Event or exposure (1) | 2014 | 2015 | |
|---|---|---|---|
| Number | Number | Percent | |
|
Total |
88 | 69 | 100 |
|
Violence and other injuries by persons or animals |
16 | 15 | 22 |
|
Intentional injury by person |
13 | 15 | 22 |
|
Homicides (Intentional injury by other person) |
11 | 8 | 12 |
|
Shooting by other person--intentional |
10 | 6 | 9 |
|
Hitting, kicking, beating, shoving |
-- | 1 | 1 |
|
Suicides (Self-inflicted injury--intentional) |
-- | 7 | 10 |
|
Shooting--intentional self-harm |
-- | 4 | 6 |
|
Transportation incidents |
33 | 29 | 42 |
|
Aircraft incidents |
6 | 4 | 6 |
|
Other in-flight crash |
-- | 3 | 4 |
|
Other in-flight crash into structure, object, or ground |
-- | 3 | 4 |
|
Roadway incidents involving motorized land vehicle |
20 | 23 | 33 |
|
Roadway collision with other vehicle |
9 | 10 | 14 |
|
Roadway collision--moving in same direction |
-- | 4 | 6 |
|
Roadway collision--moving in opposite directions, oncoming |
5 | 3 | 4 |
|
Roadway collision--moving perpendicularly |
-- | 3 | 4 |
|
Roadway collision with object other than vehicle |
5 | 7 | 10 |
|
Vehicle struck object or animal on side of roadway |
5 | 6 | 9 |
|
Roadway noncollision incident |
6 | 5 | 7 |
|
Jack-knifed or overturned, roadway |
5 | 5 | 7 |
|
Fires and explosions |
-- | 1 | 1 |
|
Explosions |
-- | 1 | 1 |
|
Falls, slips, trips |
14 | 10 | 14 |
|
Falls to lower level |
11 | 9 | 13 |
|
Other fall to lower level |
8 | 9 | 13 |
|
Other fall to lower level 11 to 15 feet |
-- | 3 | 4 |
|
Exposure to harmful substances or environments |
14 | 6 | 9 |
|
Contact with objects and equipment |
9 | 8 | 12 |
|
Struck by object or equipment |
8 | 5 | 7 |
|
Struck by falling object or equipment--other than powered vehicle |
-- | 3 | 4 |
|
Footnotes: |
|||
|
NOTE: Data for all years are final. Totals for major categories may include subcategories not shown separately. Percentages may not add to totals because of rounding. CFOI fatality counts exclude illness-related deaths unless precipitated by an injury event. Dashes indicate no data reported or data that do not meet publication criteria. |
|||
| Industry (1) | 2014 | 2015 | |
|---|---|---|---|
| Number | Number | Percent | |
|
Total |
88 | 69 | 100 |
|
Private industry |
74 | 63 | 91 |
|
Natural resources and mining |
5 | 4 | 6 |
|
Agriculture, forestry, fishing and hunting |
5 | 4 | 6 |
|
Crop production |
-- | 3 | 4 |
|
Fruit and tree nut farming |
-- | 1 | 1 |
|
Noncitrus fruit and tree nut farming |
-- | 1 | 1 |
|
Tree nut farming |
-- | 1 | 1 |
|
Support activities for agriculture and forestry |
3 | 1 | 1 |
|
Support activities for crop production |
-- | 1 | 1 |
|
Support activities for crop production |
-- | 1 | 1 |
|
Farm management services |
-- | 1 | 1 |
|
Construction |
17 | 12 | 17 |
|
Construction |
17 | 12 | 17 |
|
Construction of buildings |
3 | 3 | 4 |
|
Nonresidential building construction |
-- | 3 | 4 |
|
Specialty trade contractors |
11 | 9 | 13 |
|
Foundation, structure, and building exterior contractors |
3 | 4 | 6 |
|
Building finishing contractors |
4 | 3 | 4 |
|
Manufacturing |
3 | 4 | 6 |
|
Manufacturing |
3 | 4 | 6 |
|
Nonmetallic mineral product manufacturing |
-- | 3 | 4 |
|
Trade, transportation, and utilities |
24 | 30 | 43 |
|
Wholesale trade |
5 | 3 | 4 |
|
Merchant wholesalers, durable goods |
4 | 2 | 3 |
|
Metal and mineral (except petroleum) merchant wholesalers |
-- | 1 | 1 |
|
Metal service centers and other metal merchant wholesalers |
-- | 1 | 1 |
|
Miscellaneous durable goods merchant wholesalers |
-- | 1 | 1 |
|
Recyclable material merchant wholesalers |
-- | 1 | 1 |
|
Retail trade |
3 | 5 | 7 |
|
Gasoline stations |
1 | 3 | 4 |
|
Gasoline stations |
1 | 3 | 4 |
|
Gasoline stations with convenience stores |
1 | 3 | 4 |
|
Transportation and warehousing |
16 | 22 | 32 |
|
Air transportation |
2 | 1 | 1 |
|
Scheduled air transportation |
-- | 1 | 1 |
|
Scheduled air transportation |
-- | 1 | 1 |
|
Scheduled passenger air transportation |
-- | 1 | 1 |
|
Truck transportation |
11 | 13 | 19 |
|
General freight trucking |
10 | 11 | 16 |
|
General freight trucking, long-distance |
8 | 9 | 13 |
|
General freight trucking, long-distance, truckload |
4 | 5 | 7 |
|
Transit and ground passenger transportation |
-- | 5 | 7 |
|
Taxi and limousine service |
-- | 5 | 7 |
|
Taxi service |
-- | 1 | 1 |
|
Limousine service |
-- | 4 | 6 |
|
Support activities for transportation |
-- | 3 | 4 |
|
Financial activities |
3 | -- | -- |
|
Professional and business services |
7 | 5 | 7 |
|
Administrative and waste services |
6 | 5 | 7 |
|
Administrative and support services |
6 | 5 | 7 |
|
Services to buildings and dwellings |
4 | 3 | 4 |
|
Landscaping services |
4 | 3 | 4 |
|
Educational and health services |
4 | 5 | 7 |
|
Health care and social assistance |
3 | 4 | 6 |
|
Ambulatory health care services |
-- | 4 | 6 |
|
Leisure and hospitality |
5 | -- | -- |
|
Other services, except public administration |
4 | -- | -- |
|
Government (2) |
14 | 6 | 9 |
|
Federal government |
4 | 3 | 4 |
|
State government |
-- | -- | -- |
|
Local government |
9 | 1 | 1 |
|
Footnotes: |
|||
|
NOTE: Data for all years are final. Totals for major categories may include subcategories not shown separately. Percentages may not add to totals because of rounding. CFOI fatality counts exclude illness-related deaths unless precipitated by an injury event. Dashes indicate no data reported or data that do not meet publication criteria. |
|||
| Occupation (1) | 2014 | 2015 | |
|---|---|---|---|
| Number | Number | Percent | |
|
Total |
88 | 69 | 100 |
|
Management occupations |
-- | 3 | 4 |
|
Healthcare practitioners and technical occupations |
-- | 1 | 1 |
|
Health technologists and technicians |
-- | 1 | 1 |
|
Emergency medical technicians and paramedics |
-- | 1 | 1 |
|
Emergency medical technicians and paramedics |
-- | 1 | 1 |
|
Protective service occupations |
10 | 4 | 6 |
|
Law enforcement workers |
8 | 1 | 1 |
|
Police officers |
8 | 1 | 1 |
|
Police and sheriff's patrol officers |
8 | 1 | 1 |
|
Building and grounds cleaning and maintenance occupations |
6 | 3 | 4 |
|
Grounds maintenance workers |
6 | 3 | 4 |
|
Grounds maintenance workers |
6 | 3 | 4 |
|
Sales and related occupations |
5 | 4 | 6 |
|
Retail sales workers |
3 | 3 | 4 |
|
Farming, fishing, and forestry occupations |
-- | 4 | 6 |
|
Agricultural workers |
-- | 4 | 6 |
|
Miscellaneous agricultural workers |
-- | 4 | 6 |
|
Farmworkers and laborers, crop, nursery, and greenhouse |
-- | 2 | 3 |
|
Construction and extraction occupations |
15 | 10 | 14 |
|
Construction trades workers |
12 | 8 | 12 |
|
Installation, maintenance, and repair occupations |
7 | 3 | 4 |
|
Production occupations |
-- | 4 | 6 |
|
Welding, soldering, and brazing workers |
-- | 1 | 1 |
|
Welders, cutters, solderers, and brazers |
-- | 1 | 1 |
|
Transportation and material moving occupations |
31 | 25 | 36 |
|
Air transportation workers |
4 | 1 | 1 |
|
Aircraft pilots and flight engineers |
4 | 1 | 1 |
|
Commercial pilots |
4 | 1 | 1 |
|
Motor vehicle operators |
20 | 22 | 32 |
|
Driver/sales workers and truck drivers |
17 | 15 | 22 |
|
Heavy and tractor-trailer truck drivers |
14 | 14 | 20 |
|
Taxi drivers and chauffeurs |
-- | 4 | 6 |
|
Taxi drivers and chauffeurs |
-- | 4 | 6 |
|
Miscellaneous motor vehicle operators |
-- | 3 | 4 |
|
Material moving workers |
7 | 1 | 1 |
|
Laborers and material movers, hand |
4 | 1 | 1 |
|
Laborers and freight, stock, and material movers, hand |
3 | 1 | 1 |
|
Footnotes: |
|||
|
NOTE: Data for all years are final. Totals for major categories may include subcategories not shown separately. Percentages may not add to totals because of rounding. CFOI fatality counts exclude illness-related deaths unless precipitated by an injury event. Dashes indicate no data reported or data that do not meet publication criteria. |
|||
| Worker characteristics | 2014 | 2015 | |
|---|---|---|---|
| Number | Number | Percent | |
|
Total |
88 | 69 | 100 |
|
Employee status |
|||
|
Wage and salary workers (1) |
82 | 60 | 87 |
|
Self-employed (2) |
6 | 9 | 13 |
|
Gender |
|||
|
Men |
83 | 63 | 91 |
|
Women |
5 | 6 | 9 |
|
Age (3) |
|||
|
20 to 24 years |
5 | 5 | 7 |
|
25 to 34 years |
15 | 9 | 13 |
|
35 to 44 years |
14 | 12 | 17 |
|
45 to 54 years |
22 | 24 | 35 |
|
55 to 64 years |
19 | 11 | 16 |
|
65 years and over |
12 | 8 | 12 |
|
Race or ethnic origin (4) |
|||
|
White, non-Hispanic |
49 | 39 | 57 |
|
Black or African-American, non-Hispanic |
-- | 3 | 4 |
|
Hispanic or Latino |
31 | 18 | 26 |
|
Footnotes: |
|||
|
NOTE: Data for all years are final. Totals for major categories may include subcategories not shown separately. Percentages may not add to totals because of rounding. CFOI fatality counts exclude illness-related deaths unless precipitated by an injury event. Dashes indicate no data reported or data that do not meet publication criteria. |
|||
Last Modified Date: Tuesday, April 18, 2017