
An official website of the United States government
An official website of the United States government
The .gov means it's official.
Federal government websites often end in .gov or .mil. Before sharing sensitive information,
make sure you're on a federal government site.
The site is secure.
The
https:// ensures that you are connecting to the official website and that any
information you provide is encrypted and transmitted securely.
The Office of Productivity and Technology (OPT) measures how efficiently the U.S. converts inputs into the outputs of goods and services. Measures of labor productivity compare the growth in output to the growth in hours worked and measures of total factor productivity (TFP), also known as multifactor productivity (MFP), compare growth in output to the growth in a combination of inputs that include labor, capital, energy, materials, and purchased services.
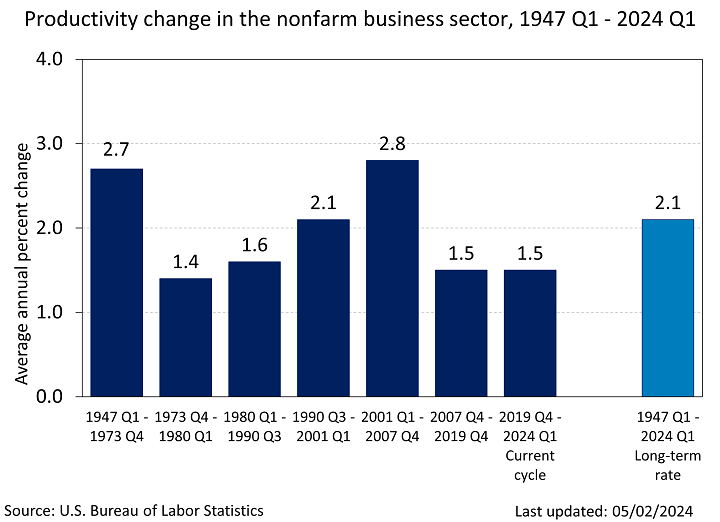
Click the graphic to enlarge chart: Long-term labor productivity in the nonfarm business sector since 1947.
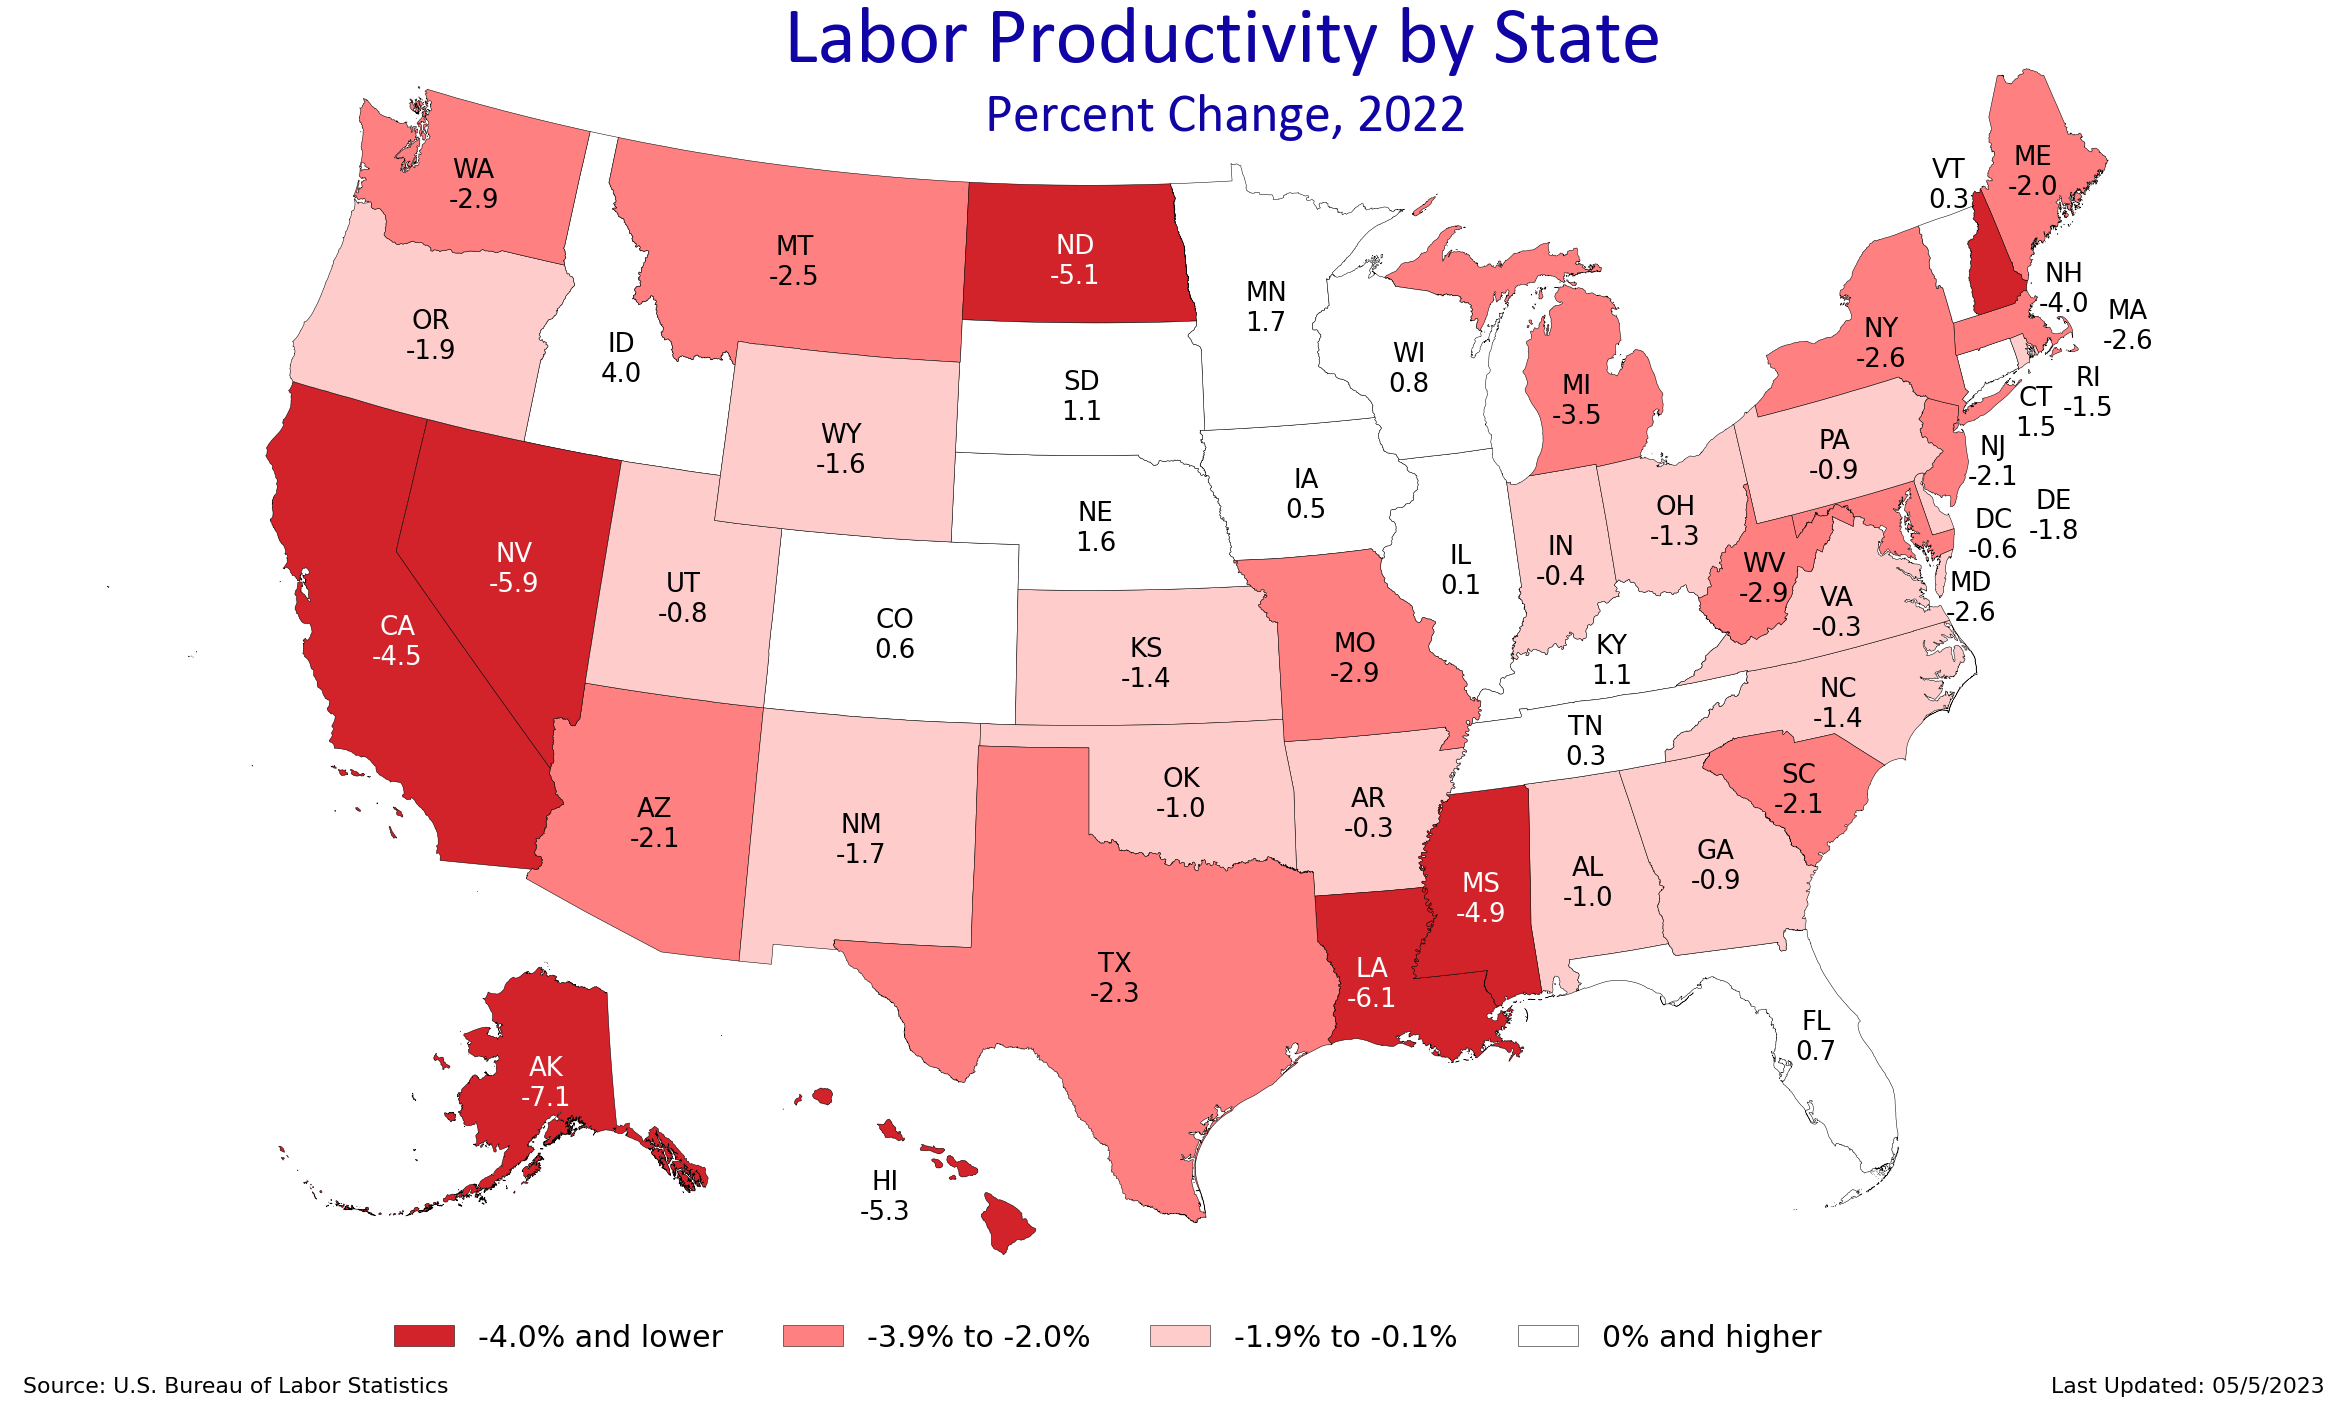
Click the graphic to enlarge chart: Labor Productivity by State, Percent Change.
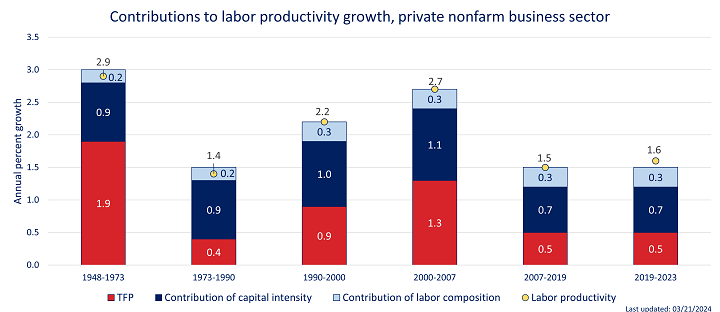
Click the graphic to enlarge chart: Contributions to Labor Productivity Growth, Private Nonfarm Business Sector, Selected Time Periods.
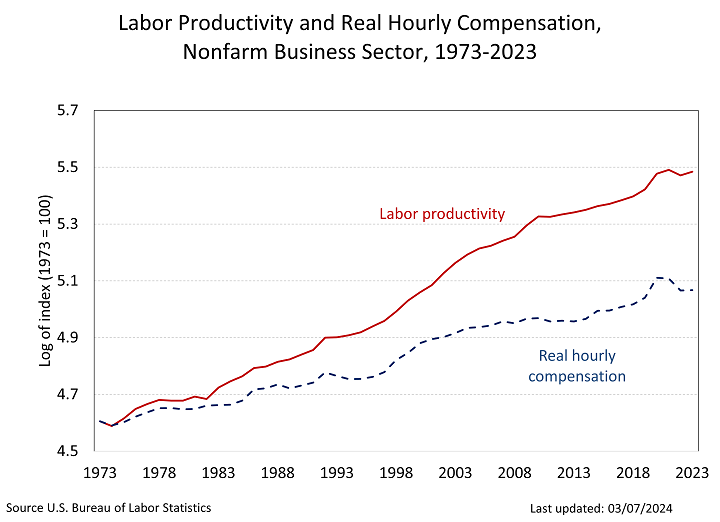
Click the graphic to enlarge chart: Labor Productivity and Real Hourly Compensation, Nonfarm Business Sector since 1973.
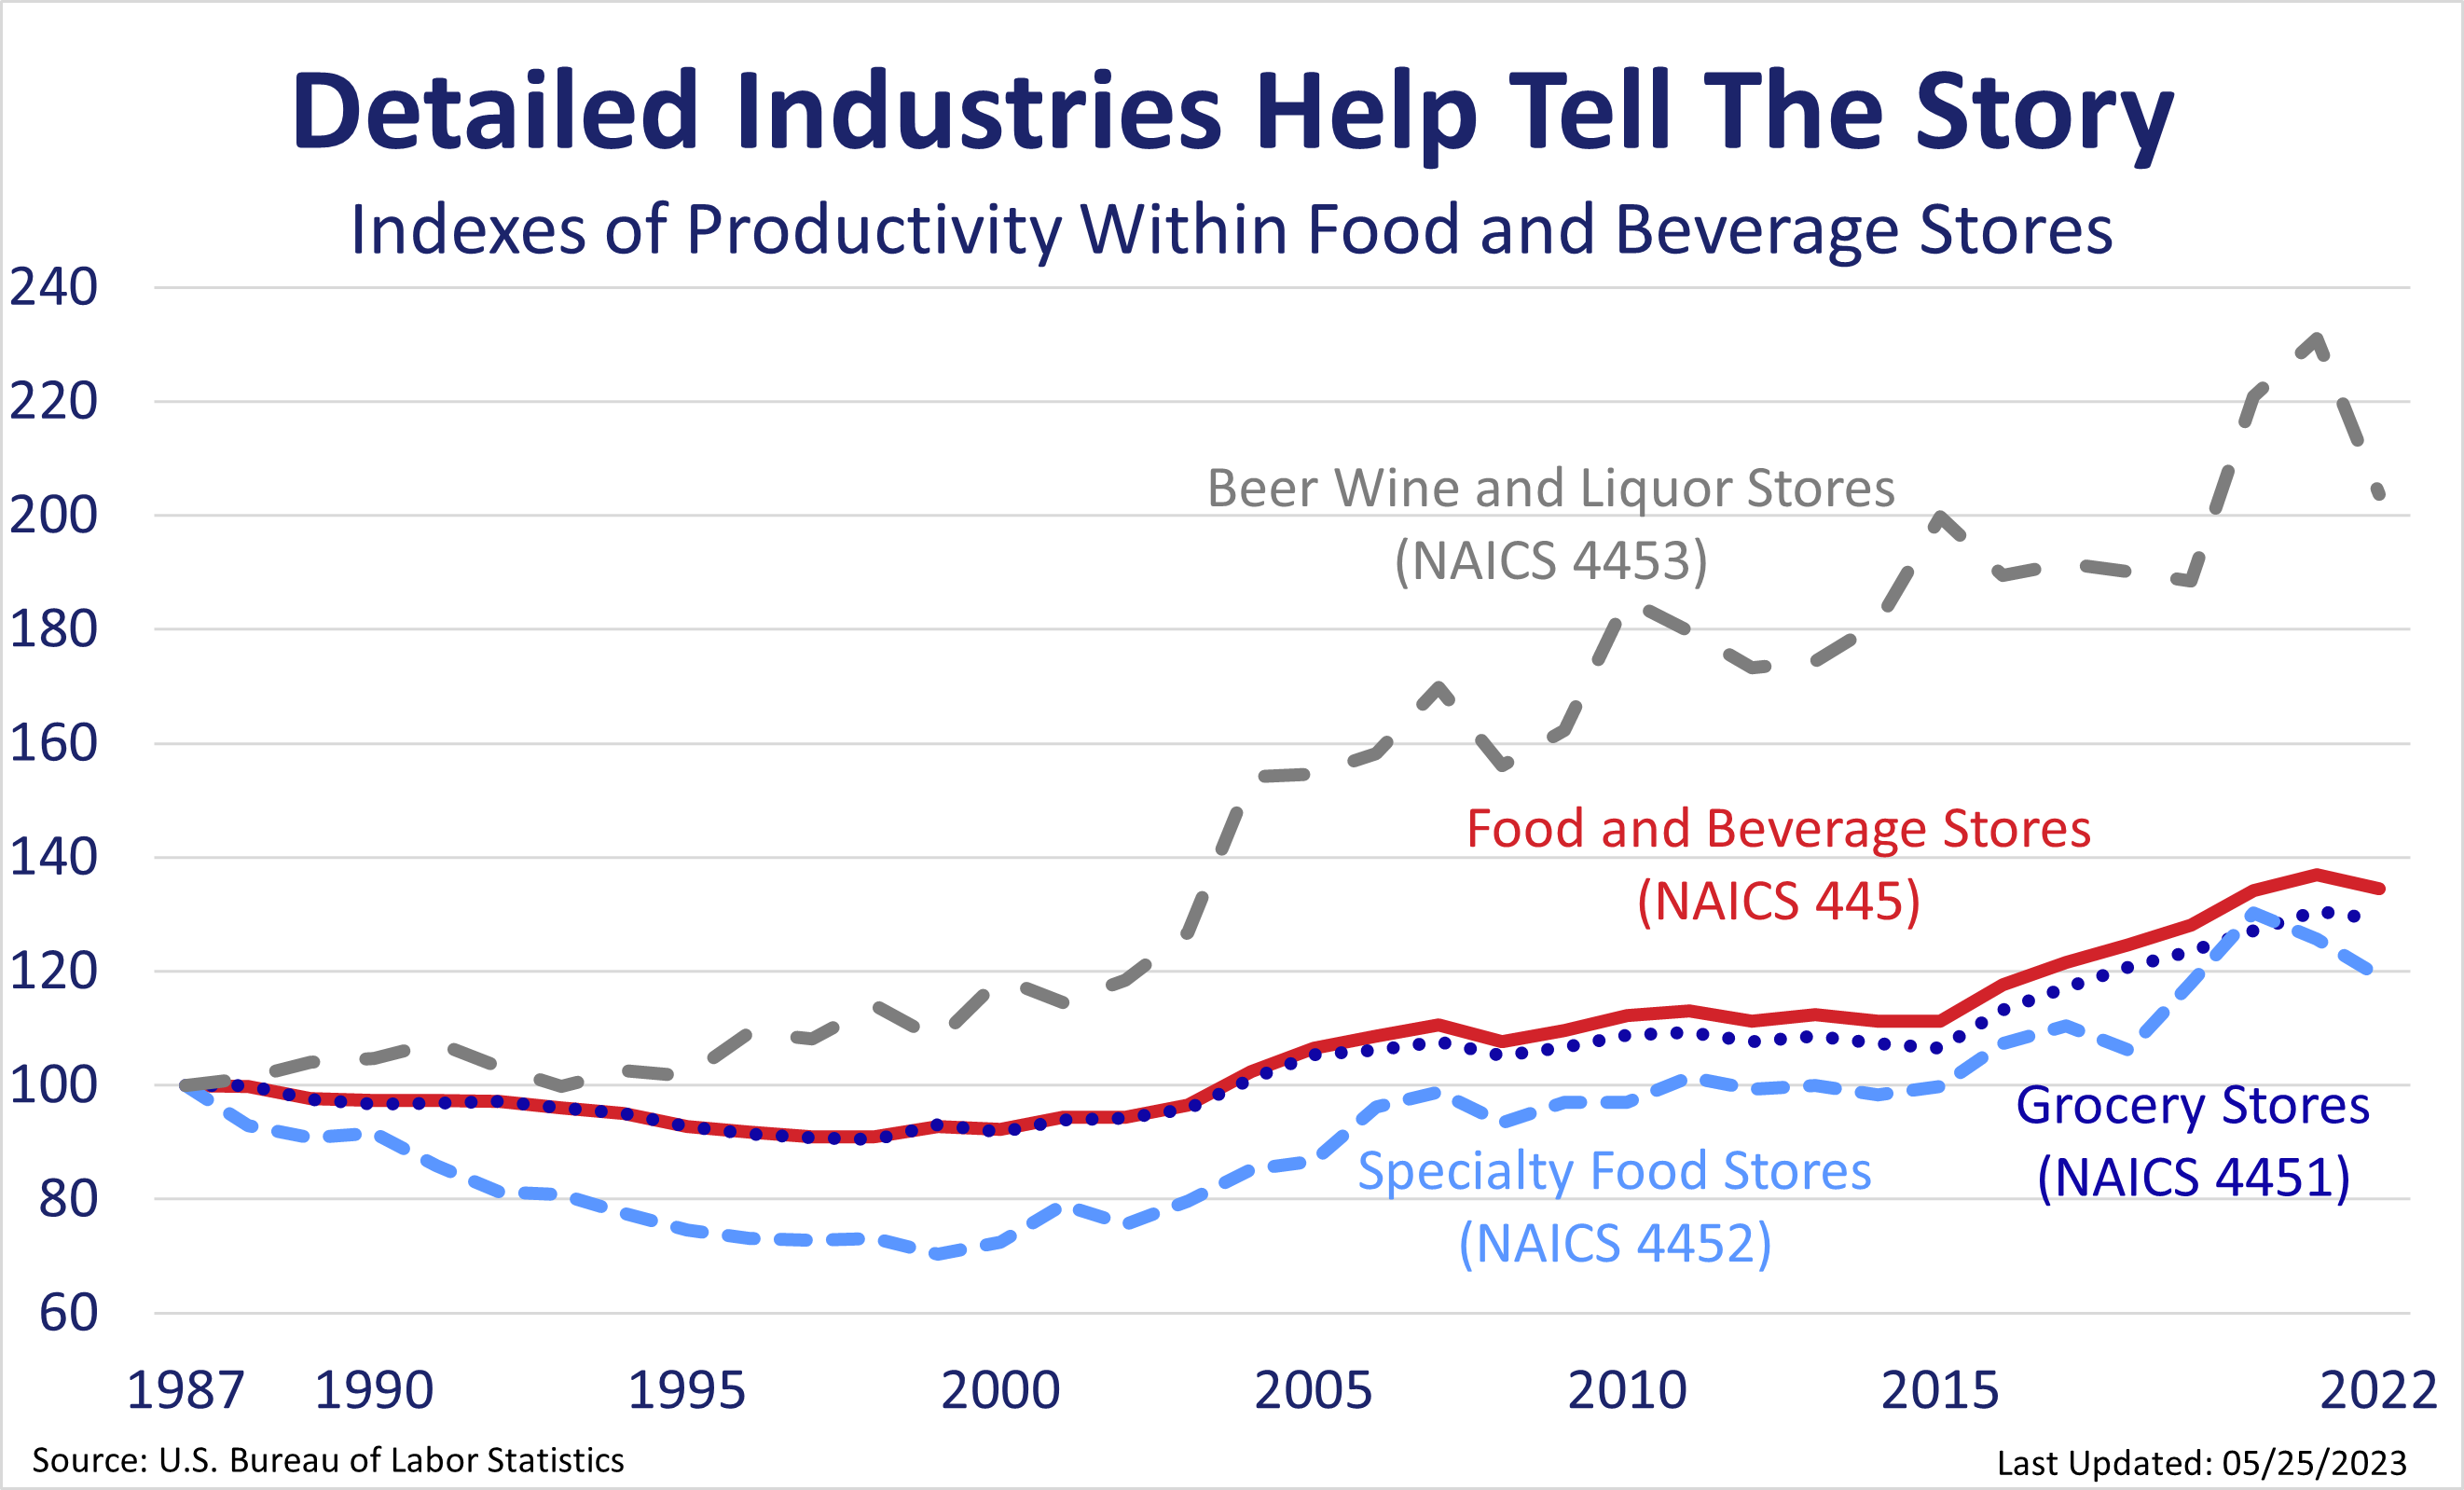
Click the graphic to enlarge chart: Detailed Industries Help Tell the Story, Indexes of Productivity Within Food and Beverage Stores.
Labor productivity (output per hour)
+0.3% in 1st Qtr of 2024
![]()
Hourly compensation
+5.0% in 1st Qtr of 2024
![]()
Unit labor costs
+4.7% in 1st Qtr of 2024
![]()
Real value-added output
+1.3% in 1st Qtr of 2024
![]()
Hours worked
+1.0% in 1st Qtr of 2024
![]()
Labor productivity (output per hour)
+0.2% in 1st Qtr of 2024
![]()
Hourly compensation
+3.4% in 1st Qtr of 2024
![]()
Unit labor costs
+3.2% in 1st Qtr of 2024
![]()
Real sectoral output
unchanged in 1st Qtr of 2024
![]()
Hours worked
-0.2% in 1st Qtr of 2024
![]()
05/02/2024
Productivity increased 0.3 percent in the nonfarm business sector in the first quarter of 2024;
unit labor costs increased 4.7 percent (seasonally adjusted annual rates). In manufacturing,
productivity increased 0.2 percent and unit labor costs increased 3.2 percent.
HTML
|
PDF
|
RSS
|
Charts
05/25/2023
Retail trade productivity decreased 0.4 percent in 2022, the first decline since 2008. Wholesale trade productivity fell 1.2 percent with hours worked growing at a higher rate than output. Unit labor costs grew in both retail trade and wholesale trade.
HTML
|
PDF
|
RSS
|
Charts
06/29/2023
Labor productivity rose in 15 of 30 selected service-providing industries in 2022.
Output increased in 18 industries while hours worked rose in 22 industries.
HTML
|
PDF
|
RSS
|
Charts
05/25/2023
Labor productivity declined in 37 states and the District of Columbia in 2022. Output increased in 43 states and the District and hours worked increased in 48 states and the District.
HTML
|
PDF
|
RSS
|
Charts
04/25/2024
Labor productivity decreased in 60 of the 86 NAICS 4-digit manufacturing industries and in 3 of the 5 mining industries in 2023. Output fell in 74 of the 91 manufacturing and mining industries while hours worked fell in 45 industries. Thirty-eight industries decreased both output and hours worked.
HTML
|
PDF
|
RSS
|
Charts
03/21/2024
Total factor productivity increased 0.7 percent in the private
nonfarm business sector in 2023 as output increased 2.6 percent and
combined inputs increased 1.9 percent.
HTML
|
PDF
|
RSS
11/21/2023
In 2022, total factor productivity increased in 9 out of 21 major industries, led by service providing industries.
HTML
|
PDF
|
RSS
|
Charts
08/31/2023
Total factor productivity rose in 78 of 86 4-digit NAICS manufacturing industries in 2021, up from 25 industries in 2020. Among the two measured transportation industries, total factor productivity increased in both air transportation and line-haul railroads.
HTML
|
PDF
|
RSS

Even though U.S. employment has increased since the second quarter of 2020, the average weekly hours worked of employees has declined. Is it unusual for average weekly hours worked to decline while we experience sustained job growth, and what may be contributing to this trend? read more »
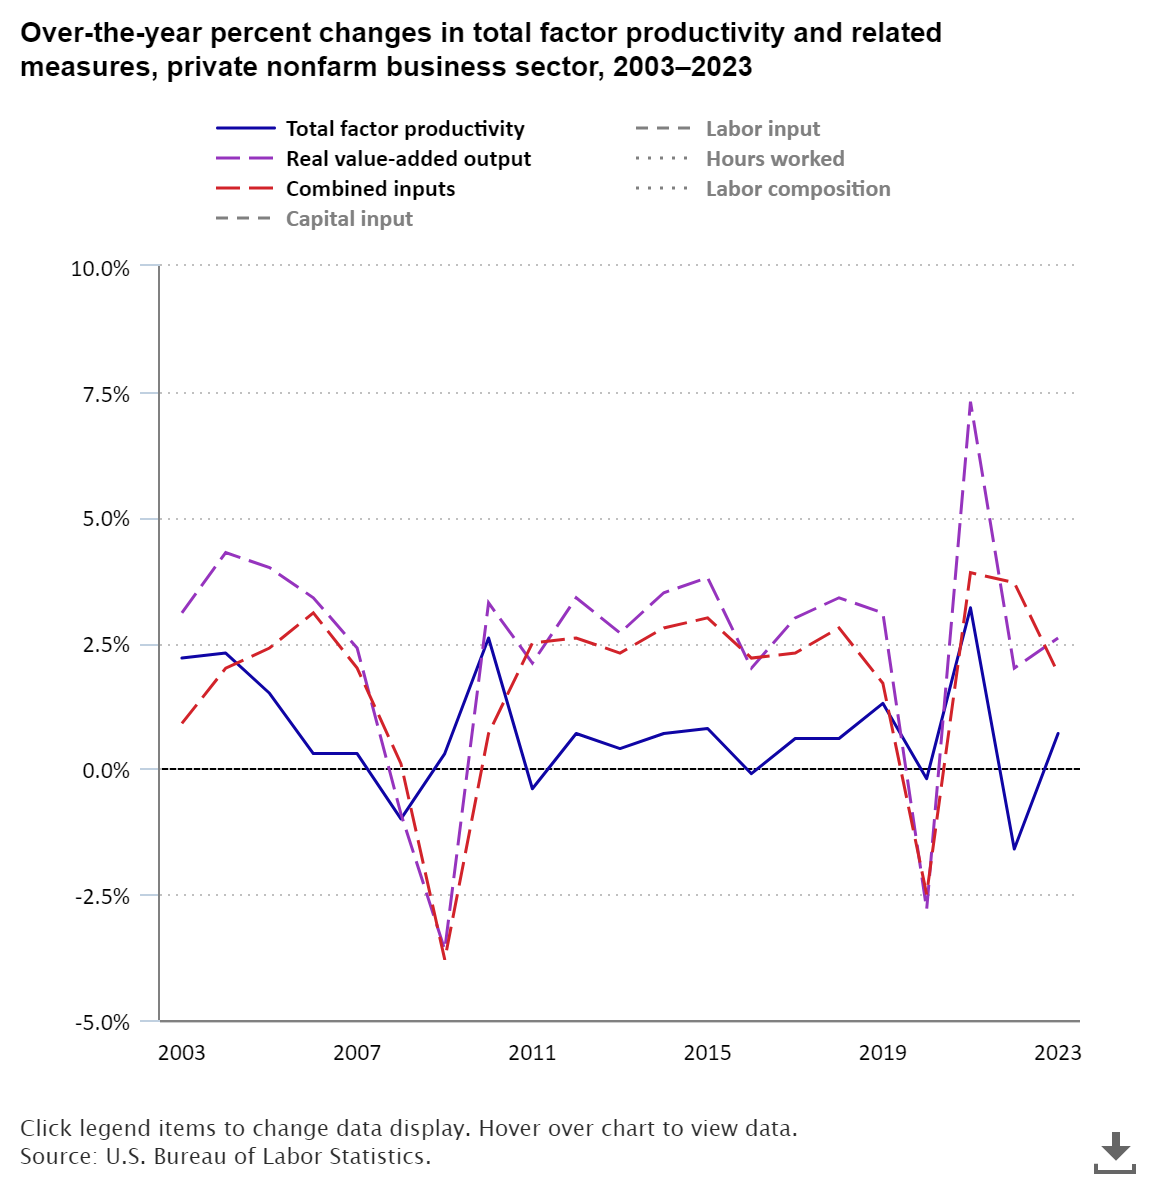
Private nonfarm business total factor productivity increased 0.7 percent in 2023, reflecting a 2.6-percent increase in output and a 1.9-percent increase in the combined inputs of capital and labor. The 2023 growth in total factor productivity was in close range with the average annual growth experienced in the pre-pandemic 2011–19 period. read more »

This article describes two adjustments to self-employment hours that will improve quarterly measures of labor productivity. read more »

This Spotlight looks at some short- and long-term state-level trends for labor productivity, output, and hours worked, and labor compensation. read more »