
An official website of the United States government
An official website of the United States government
The .gov means it's official.
Federal government websites often end in .gov or .mil. Before sharing sensitive information,
make sure you're on a federal government site.
The site is secure.
The
https:// ensures that you are connecting to the official website and that any
information you provide is encrypted and transmitted securely.
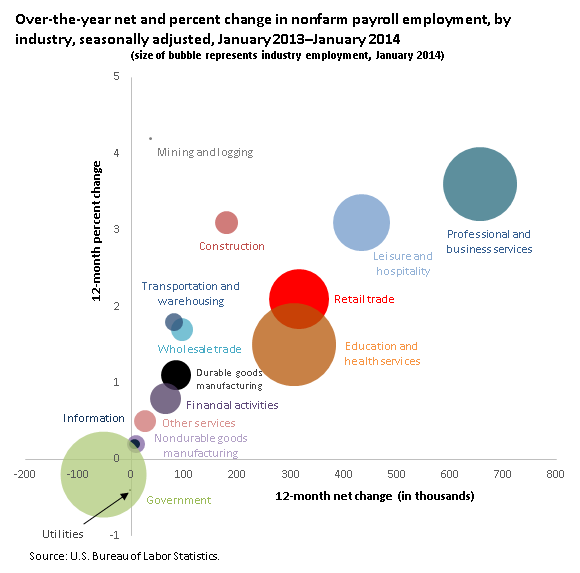
From January 2013 to January 2014, total nonfarm payroll employment increased by 2,238,000, an average of 186,500 jobs per month. Employment grew in mining and logging, construction, durable goods manufacturing, wholesale and retail trade, transportation and warehousing, information, financial activities, professional and business services, education and health services, and leisure and hospitality.
| Industry | 12-month net change | 12-month percent change | January 2014 employment(p) |
|---|---|---|---|
Mining and logging | 36,000 | 4.2% | 890,000 |
Construction | 179,000 | 3.1 | 5,922,000 |
Durable goods manufacturing | 84,000 | 1.1 | 7,598,000 |
Nondurable goods manufacturing | 9,000 | 0.2 | 4,477,000 |
Wholesale trade | 95,500 | 1.7 | 5,809,900 |
Retail trade | 316,000 | 2.1 | 15,259,500 |
Transportation and warehousing | 81,200 | 1.8 | 4,562,600 |
Utilities | -2,400 | -0.4 | 549,600 |
Information | 6,000 | 0.2 | 2,679,000 |
Financial activities | 65,000 | 0.8 | 7,900,000 |
Professional and business services | 656,000 | 3.6 | 18,866,000 |
Education and health services | 306,000 | 1.5 | 21,227,000 |
Leisure and hospitality | 433,000 | 3.1 | 14,461,000 |
Other services | 26,000 | 0.5 | 5,484,000 |
Government | -53,000 | -0.2 | 21,813,000 |
Footnotes: | |||
Over the year, professional and business services added 656,000 jobs, or 3.6 percent—an average of 54,667 jobs per month. Employment in leisure and hospitality increased 433,000, or 3.1 percent, an average of 36,083 jobs per month.
From January 2013 to January 2014, government employment decreased by 53,000. Employment in nondurable goods manufacturing, utilities, and other services changed little.
These data are from the Current Employment Statistics (CES) program and are seasonally adjusted. Data for January 2014 are preliminary. To learn more, see "The Employment Situation — January 2014," (HTML) (PDF) news release USDL‑14‑0168. More charts featuring CES employment data can be found in Current Employment Statistics Highlights: January 2014.
Bureau of Labor Statistics, U.S. Department of Labor, The Economics Daily, Payroll employment up 2,238,000 over the year; averaged 186,500 jobs per month at https://www.bls.gov/opub/ted/2014/ted_20140210.htm (visited May 23, 2024).

