
An official website of the United States government
An official website of the United States government
The .gov means it's official.
Federal government websites often end in .gov or .mil. Before sharing sensitive information,
make sure you're on a federal government site.
The site is secure.
The
https:// ensures that you are connecting to the official website and that any
information you provide is encrypted and transmitted securely.
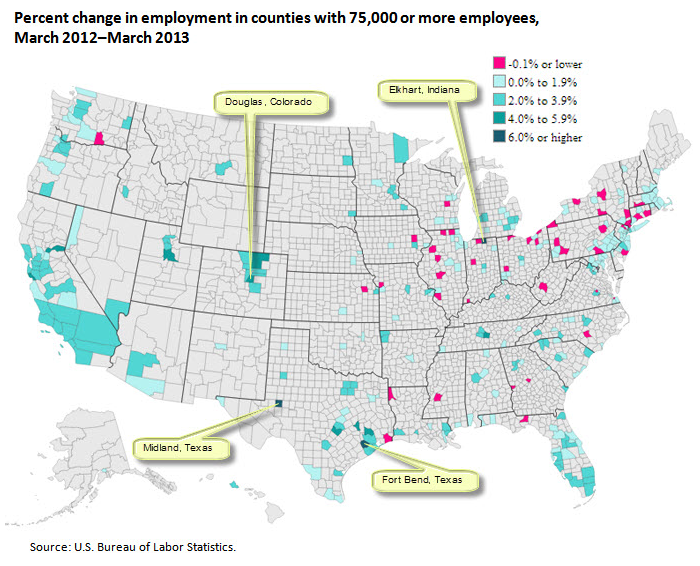
From March 2012 to March 2013, employment increased in 282 of the 334 largest U.S. counties. (Large counties are defined as having employment levels of 75,000 or greater.) Fort Bend, Texas, posted the largest increase, with a gain of 7.0 percent over the year, compared with national job growth of 1.6 percent. Within Fort Bend, the largest employment increase occurred in leisure and hospitality, which gained 2,204 jobs over the year (12.5 percent).
| County | Percent change |
|---|---|
Jefferson, AL | 0.9 |
Madison, AL | 1.8 |
Mobile, AL | 0.0 |
Montgomery, AL | 1.7 |
Tuscaloosa, AL | 2.0 |
Anchorage Borough, AK | 0.1 |
Maricopa, AZ | 2.6 |
Pima, AZ | 0.9 |
Benton, AR | 2.7 |
Pulaski, AR | 0.6 |
Washington, AR | 3.1 |
Alameda, CA | 3.2 |
Contra Costa, CA | 3.0 |
Fresno, CA | 3.0 |
Kern, CA | 3.7 |
Los Angeles, CA | 2.2 |
Marin, CA | 2.9 |
Monterey, CA | 1.8 |
Orange, CA | 2.8 |
Placer, CA | 5.2 |
Riverside, CA | 3.4 |
Sacramento, CA | 1.8 |
San Bernardino, CA | 2.3 |
San Diego, CA | 2.3 |
San Francisco, CA | 4.3 |
San Joaquin, CA | 2.5 |
San Luis Obispo, CA | 3.5 |
San Mateo, CA | 3.4 |
Santa Barbara, CA | 3.3 |
Santa Clara, CA | 3.8 |
Santa Cruz, CA | 4.2 |
Solano, CA | 3.1 |
Sonoma, CA | 3.4 |
Stanislaus, CA | 3.8 |
Tulare, CA | 1.9 |
Ventura, CA | 2.1 |
Yolo, CA | 1.7 |
Adams, CO | 3.7 |
Arapahoe, CO | 3.7 |
Boulder, CO | 2.7 |
Denver, CO | 4.0 |
Douglas, CO | 5.6 |
El Paso, CO | 2.3 |
Jefferson, CO | 2.8 |
Larimer, CO | 3.8 |
Weld, CO | 4.4 |
Fairfield, CT | 0.7 |
Hartford, CT | 0.4 |
New Haven, CT | -0.2 |
New London, CT | -0.7 |
New Castle, DE | 1.2 |
Washington, DC | 1.0 |
Alachua, FL | 0.6 |
Brevard, FL | 0.4 |
Broward, FL | 2.4 |
Collier, FL | 2.3 |
Duval, FL | 2.4 |
Escambia, FL | 1.4 |
Hillsborough, FL | 2.1 |
Lake, FL | 2.7 |
Lee, FL | 2.7 |
Leon, FL | -0.3 |
Manatee, FL | 2.1 |
Marion, FL | 0.9 |
Miami-Dade, FL | 2.6 |
Okaloosa, FL | 0.2 |
Orange, FL | 3.2 |
Palm Beach, FL | 2.8 |
Pasco, FL | 1.4 |
Pinellas, FL | 1.9 |
Polk, FL | 1.6 |
Sarasota, FL | 3.2 |
Seminole, FL | 1.5 |
Volusia, FL | 0.9 |
Bibb, GA | -0.2 |
Chatham, GA | 2.6 |
Clayton, GA | 0.0 |
Cobb, GA | 2.0 |
De Kalb, GA | 0.4 |
Fulton, GA | 3.3 |
Gwinnett, GA | 1.6 |
Muscogee, GA | -0.5 |
Richmond, GA | 0.8 |
Honolulu, HI | 2.1 |
Ada, ID | 3.5 |
Champaign, IL | 0.8 |
Cook, IL | 1.2 |
Du Page, IL | 1.7 |
Kane, IL | 1.0 |
Lake, IL | 0.9 |
McHenry, IL | -0.4 |
McLean, IL | 0.9 |
Madison, IL | 0.0 |
Peoria, IL | -1.8 |
St Clair, IL | -1.4 |
Sangamon, IL | -2.4 |
Will, IL | 0.4 |
Winnebago, IL | -1.5 |
Allen, IN | 0.5 |
Elkhart, IN | 6.0 |
Hamilton, IN | 2.6 |
Lake, IN | 0.7 |
Marion, IN | 1.2 |
St Joseph, IN | -0.5 |
Tippecanoe, IN | -0.4 |
Vanderburgh, IN | -2.0 |
Johnson, IA | 2.2 |
Linn, IA | -0.4 |
Polk, IA | 1.8 |
Scott, IA | 0.8 |
Johnson, KS | 2.7 |
Sedgwick, KS | 0.7 |
Shawnee, KS | -0.2 |
Wyandotte, KS | 0.7 |
Boone, KY | 1.3 |
Fayette, KY | 2.0 |
Jefferson, KY | 2.3 |
Caddo, LA | -1.6 |
Calcasieu, LA | 2.2 |
East Baton Rouge, LA | 1.4 |
Jefferson, LA | 0.0 |
Lafayette, LA | 2.7 |
Orleans, LA | 2.3 |
St Tammany, LA | 2.1 |
Cumberland, ME | 0.6 |
Anne Arundel, MD | 1.8 |
Baltimore, MD | 0.8 |
Frederick, MD | 0.8 |
Harford, MD | 0.3 |
Howard, MD | 0.6 |
Montgomery, MD | 0.3 |
Prince Georges, MD | -0.2 |
Baltimore City, MD | 0.8 |
Barnstable, MA | 1.4 |
Bristol, MA | 0.0 |
Essex, MA | 0.3 |
Hampden, MA | -0.4 |
Middlesex, MA | 1.5 |
Norfolk, MA | 1.5 |
Plymouth, MA | 1.6 |
Suffolk, MA | 1.7 |
Worcester, MA | 0.1 |
Genesee, MI | 1.3 |
Ingham, MI | 0.8 |
Kalamazoo, MI | 0.2 |
Kent, MI | 3.0 |
Macomb, MI | 3.1 |
Oakland, MI | 2.7 |
Ottawa, MI | 2.7 |
Saginaw, MI | 0.1 |
Washtenaw, MI | 2.3 |
Wayne, MI | 0.9 |
Anoka, MN | 3.0 |
Dakota, MN | 2.1 |
Hennepin, MN | 2.6 |
Olmsted, MN | 2.4 |
Ramsey, MN | 1.9 |
St Louis, MN | 2.5 |
Stearns, MN | 1.1 |
Harrison, MS | 0.3 |
Hinds, MS | -0.7 |
Boone, MO | 2.0 |
Clay, MO | -0.6 |
Greene, MO | 0.8 |
Jackson, MO | 0.8 |
St Charles, MO | 2.0 |
St Louis, MO | 0.8 |
St Louis City, MO | 0.2 |
Yellowstone, MT | 2.1 |
Douglas, NE | 1.2 |
Lancaster, NE | 1.0 |
Clark, NV | 2.6 |
Washoe, NV | 1.8 |
Hillsborough, NH | 0.6 |
Rockingham, NH | 0.9 |
Atlantic, NJ | -1.4 |
Bergen, NJ | 1.0 |
Burlington, NJ | 2.6 |
Camden, NJ | 0.5 |
Essex, NJ | 0.3 |
Gloucester, NJ | 0.1 |
Hudson, NJ | 1.4 |
Mercer, NJ | 0.3 |
Middlesex, NJ | 1.0 |
Monmouth, NJ | 0.5 |
Morris, NJ | 0.6 |
Ocean, NJ | 1.9 |
Passaic, NJ | -0.7 |
Somerset, NJ | 1.1 |
Union, NJ | 1.3 |
Bernalillo, NM | 0.5 |
Albany, NY | 1.2 |
Bronx, NY | 2.2 |
Broome, NY | -1.9 |
Dutchess, NY | -0.6 |
Erie, NY | 0.3 |
Kings, NY | 1.7 |
Monroe, NY | -0.2 |
Nassau, NY | 0.8 |
New York, NY | 1.7 |
Oneida, NY | -1.8 |
Onondaga, NY | 0.1 |
Orange, NY | 0.5 |
Queens, NY | 2.2 |
Richmond, NY | 2.8 |
Rockland, NY | -0.3 |
Saratoga, NY | 1.8 |
Suffolk, NY | 0.6 |
Westchester, NY | -0.4 |
Buncombe, NC | 3.0 |
Catawba, NC | 1.1 |
Cumberland, NC | -0.8 |
Durham, NC | 2.0 |
Forsyth, NC | 1.7 |
Guilford, NC | 1.5 |
Mecklenburg, NC | 3.0 |
New Hanover, NC | 1.2 |
Wake, NC | 3.2 |
Cass, ND | 3.5 |
Butler, OH | 0.4 |
Cuyahoga, OH | 0.9 |
Delaware, OH | 2.3 |
Franklin, OH | 1.9 |
Hamilton, OH | 0.1 |
Lake, OH | -0.3 |
Lorain, OH | -1.0 |
Lucas, OH | -0.3 |
Mahoning, OH | 0.4 |
Montgomery, OH | -0.5 |
Stark, OH | 0.9 |
Summit, OH | -0.1 |
Warren, OH | 0.8 |
Oklahoma, OK | 1.3 |
Tulsa, OK | 1.4 |
Clackamas, OR | 2.9 |
Jackson, OR | 3.3 |
Lane, OR | 1.3 |
Marion, OR | 2.3 |
Multnomah, OR | 2.0 |
Washington, OR | 1.8 |
Allegheny, PA | 0.5 |
Berks, PA | 0.6 |
Bucks, PA | 0.0 |
Butler, PA | -0.7 |
Chester, PA | 0.5 |
Cumberland, PA | 1.1 |
Dauphin, PA | 0.2 |
Delaware, PA | 0.7 |
Erie, PA | -1.3 |
Lackawanna, PA | 0.1 |
Lancaster, PA | 0.4 |
Lehigh, PA | 0.7 |
Luzerne, PA | -0.4 |
Montgomery, PA | 0.4 |
Northampton, PA | 0.9 |
Philadelphia, PA | 0.7 |
Washington, PA | 0.1 |
Westmoreland, PA | -1.0 |
York, PA | -0.7 |
Providence, RI | 0.3 |
Charleston, SC | 1.9 |
Greenville, SC | 2.1 |
Horry, SC | 2.1 |
Lexington, SC | 2.7 |
Richland, SC | 0.8 |
Spartanburg, SC | 2.1 |
York, SC | 1.3 |
Minnehaha, SD | 2.3 |
Davidson, TN | 2.4 |
Hamilton, TN | 1.0 |
Knox, TN | 0.3 |
Rutherford, TN | 5.3 |
Shelby, TN | 1.1 |
Williamson, TN | 3.8 |
Bell, TX | 1.2 |
Bexar, TX | 2.9 |
Brazoria, TX | 2.8 |
Brazos, TX | 4.7 |
Cameron, TX | 0.6 |
Collin, TX | 3.7 |
Dallas, TX | 2.9 |
Denton, TX | 3.5 |
El Paso, TX | 1.5 |
Fort Bend, TX | 7.0 |
Galveston, TX | 2.7 |
Gregg, TX | 1.6 |
Harris, TX | 3.7 |
Hidalgo, TX | 1.9 |
Jefferson, TX | -1.9 |
Lubbock, TX | 2.6 |
McLennan, TX | 1.2 |
Midland, TX | 6.9 |
Montgomery, TX | 5.0 |
Nueces, TX | 3.2 |
Potter, TX | 1.5 |
Smith, TX | 1.6 |
Tarrant, TX | 2.4 |
Travis, TX | 4.1 |
Webb, TX | 1.5 |
Williamson, TX | 3.3 |
Davis, UT | 2.2 |
Salt Lake, UT | 3.6 |
Utah, UT | 5.5 |
Weber, UT | 2.6 |
Chittenden, VT | 0.1 |
Arlington, VA | -1.6 |
Chesterfield, VA | 2.6 |
Fairfax, VA | 0.9 |
Henrico, VA | 1.6 |
Loudoun, VA | 2.9 |
Prince William, VA | 2.9 |
Alexandria City, VA | 1.4 |
Chesapeake City, VA | 0.4 |
Newport News City, VA | 0.9 |
Norfolk City, VA | -1.1 |
Richmond City, VA | -0.5 |
Virginia Beach City, VA | 1.7 |
Benton, WA | -1.2 |
Clark, WA | 2.7 |
King, WA | 3.1 |
Kitsap, WA | 0.1 |
Pierce, WA | 1.4 |
Snohomish, WA | 2.8 |
Spokane, WA | 2.0 |
Thurston, WA | 1.8 |
Whatcom, WA | 0.4 |
Yakima, WA | 1.9 |
Kanawha, WV | -1.1 |
Brown, WI | 0.6 |
Dane, WI | 1.1 |
Milwaukee, WI | 0.6 |
Outagamie, WI | 1.5 |
Waukesha, WI | 1.1 |
Winnebago, WI | -1.0 |
Midland, Texas, had the second largest increase in employment (6.9 percent) from March 2012 to March 2013, followed by Elkhart, Indiana (6.0 percent), and Douglas, Colorado (5.6 percent).
Employment declined in 46 of the large counties from March 2012 to March 2013. Sangamon, Illinois, had the largest over-the-year decrease in employment among the largest counties in the U.S. with a loss of 2.4 percent. Within Sangamon, professional and business services had the largest decrease in employment with a loss of 1,630 jobs (−14.5 percent). Vanderburgh, Indiana, had the second largest percentage decrease in employment (−2.0 percent), followed by Broome, New York (−1.9 percent), and Jefferson, Texas (−1.9 percent), which tied for the third largest percentage decrease.
In March 2013, national employment was 132.3 million. Over the year employment was up by 1.6 percent or 2.1 million. The 334 U.S. counties with 75,000 or more jobs accounted for 71.6 percent of total U.S. employment and 77.7 percent of total wages. These 334 counties had a net job growth of 1.6 million over the year, accounting for 78.6 percent of the overall U.S. employment increase.
These data are from the Quarterly Census of Employment and Wages program. To learn more, see "County Employment and Wages: First Quarter 2013" (HTML) (PDF), news release USDL‑13‑1942. Data for the most recent quarter are preliminary and subject to revision.
Bureau of Labor Statistics, U.S. Department of Labor, The Economics Daily, Employment increased in 282 of the 334 largest U.S. counties, March 2012 to March 2013 at https://www.bls.gov/opub/ted/2013/ted_20130927.htm (visited June 06, 2024).

