
An official website of the United States government
An official website of the United States government
The .gov means it's official.
Federal government websites often end in .gov or .mil. Before sharing sensitive information,
make sure you're on a federal government site.
The site is secure.
The
https:// ensures that you are connecting to the official website and that any
information you provide is encrypted and transmitted securely.
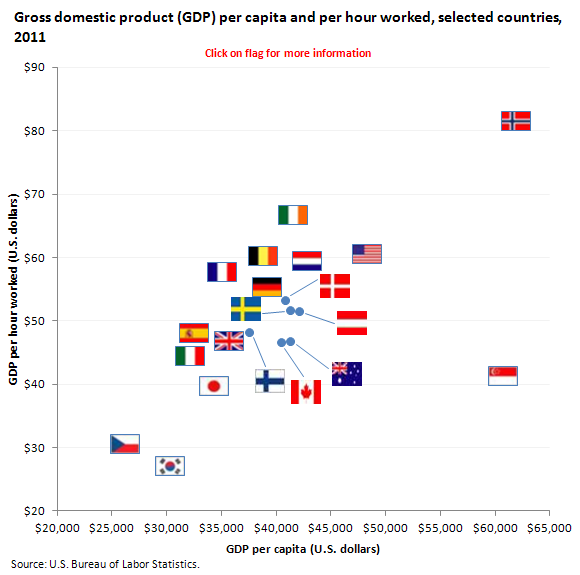
In 2011, among countries covered by the BLS international comparisons program, Norway had the highest GDP per capita ($61,900), followed by Singapore and the United States. Norway had the highest GDP per hour worked ($81.50), followed by Ireland and the United States.
| Country | GDP per capita | GDP per hour worked |
|---|---|---|
Norway | $61,900 | $81.50 |
Singapore | 60,700 | 41.30 |
United States | 48,300 | 60.60 |
Netherlands | 42,800 | 59.50 |
Austria | 42,100 | 51.40 |
Ireland | 41,500 | 66.70 |
Australia | 41,300 | 46.80 |
Sweden | 41,300 | 51.60 |
Denmark | 40,900 | 53.20 |
Canada | 40,500 | 46.60 |
Germany | 39,200 | 55.30 |
Belgium | 38,800 | 60.20 |
Finland | 37,600 | 48.10 |
United Kingdom | 35,700 | 46.80 |
France | 35,100 | 57.70 |
Japan | 34,300 | 39.70 |
Spain | 32,500 | 48.10 |
Italy | 32,100 | 44.40 |
Republic of Korea | 30,300 | 27.10 |
Czech Republic | 26,200 | 30.60 |
GDP per capita was lowest in the Czech Republic ($26,200) and the Republic of Korea ($30,300) in 2011. The country with the highest GDP per capita, Norway, had a GDP per capita value that was more than twice that of the Czech Republic.
In 2011, the GDP per hour worked for Norway was approximately 20 percent higher than the next highest ranked country, Ireland ($66.70), and roughly three times the level of the Republic of Korea ($27.10)—the country with the lowest GDP per hour worked among countries covered.
While Singapore had the second highest level of GDP per capita, it had a relatively low level of GDP per hour worked. The difference is related to Singapore having the highest average annual hours worked per employed person and the highest employment-to-population ratio of all countries covered.
These data are from the International Labor Comparisons program. GDP is the market value of goods and services produced by labor and capital in a country, regardless of nationality. GDP per capita is calculated as GDP divided by the population and is a rough measure of a population's well being. GDP per hour worked relates output to labor hours involved in its production by all persons in a country. GDP measures were obtained from the national accounts programs of their respective national statistical agencies. To learn more, see "International Comparisons of GDP per Capita and per Hour, 1960–2011" (HTML) (PDF) (XLS).
Bureau of Labor Statistics, U.S. Department of Labor, The Economics Daily, International gross domestic product (GDP) comparisons, 2011 at https://www.bls.gov/opub/ted/2013/ted_20130212.htm (visited May 29, 2024).

