An official website of the United States government
An official website of the United States government
The .gov means it's official.
Federal government websites often end in .gov or .mil. Before sharing sensitive information,
make sure you're on a federal government site.
The site is secure.
The
https:// ensures that you are connecting to the official website and that any
information you provide is encrypted and transmitted securely.
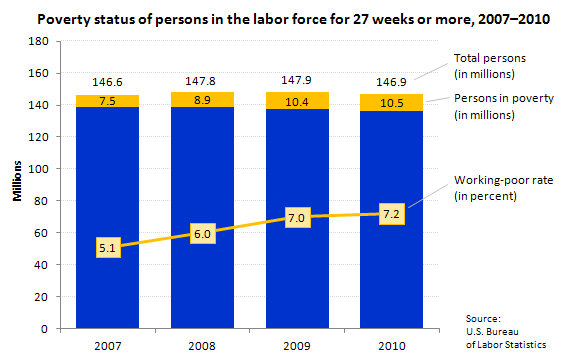
In 2010, there were 10.5 million individuals classified as "working poor" (persons who spent at least 27 weeks in the labor force—that is, working or looking for work—but whose incomes still fell below the official poverty level); the number of working poor was little changed from 2009.
The working-poor rate—the ratio of the working poor to all individuals in the labor force for at least 27 weeks—was 7.2 percent, also little different from the previous year's figure (7.0 percent).
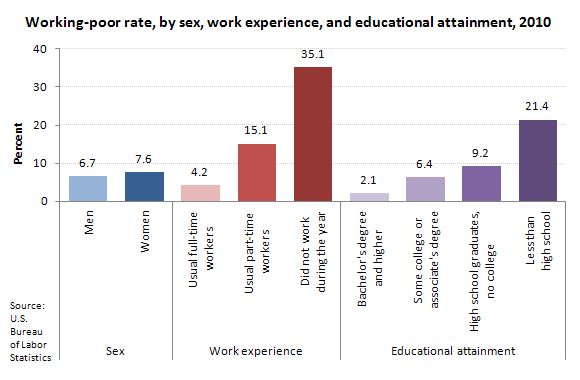
Among those who were in the labor force for 27 weeks or more in 2010, about the same number of men (5.3 million) and women (5.2 million) were classified as working poor. The working-poor rate, however, continued to be higher for women (7.6 percent) than for men (6.7 percent) in 2010.
There were 4.8 million workers who lived below the poverty threshold and usually worked full time in 2010. Full-time workers were less likely to be among the working poor than were part-time workers. Among persons in the labor force for 27 weeks or more, 4.2 percent of those usually employed full time were classified as working poor, compared with 15.1 percent of part-time workers.
The likelihood of being classified as working poor greatly diminishes as workers attain higher levels of education. Only about 1.0 million college graduates were classified as working poor in 2010, compared with 2.9 million workers with less than a high school diploma and 3.9 million workers who were high school graduates with no college. Among college graduates, 2.1 percent of those who were in the labor force for at least 27 weeks were classified as working poor, compared with 21.4 percent of those with less than a high school diploma and 9.2 percent of those workers who were high school graduates with no college.
These data are from the Current Population Survey. To learn more, see "A Profile of the Working Poor, 2010" (PDF). These data were collected in the 2011 Annual Social and Economic Supplement to the Current Population Survey.
Bureau of Labor Statistics, U.S. Department of Labor, The Economics Daily, Working poor rate 7.2 percent in 2010 at https://www.bls.gov/opub/ted/2012/ted_20120405.htm (visited May 23, 2024).