An official website of the United States government
An official website of the United States government
The .gov means it's official.
Federal government websites often end in .gov or .mil. Before sharing sensitive information,
make sure you're on a federal government site.
The site is secure.
The
https:// ensures that you are connecting to the official website and that any
information you provide is encrypted and transmitted securely.
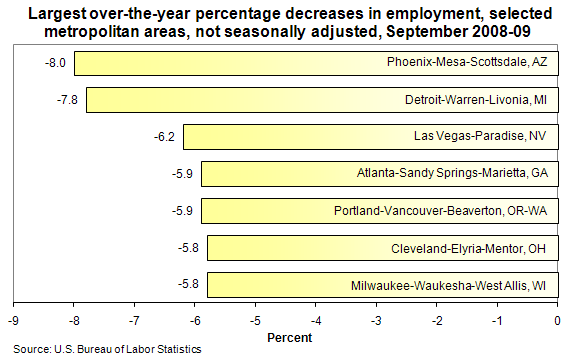
In September, nonfarm employment declined over the year in all 38 metropolitan areas with annual average employment levels above 750,000 in 2008. The largest over-the-year percentage decreases in employment in these large metropolitan areas were posted in Phoenix-Mesa-Scottsdale, Arizona. (‑8.0 percent), Detroit-Warren-Livonia, Michigan (‑7.8 percent), and Las Vegas-Paradise, Nevada. (‑6.2 percent).
In September, 359 metropolitan areas reported over-the-year decreases in nonfarm payroll employment and 10 reported increases. The largest over-the-year employment decrease was recorded in Los Angeles-Long Beach-Santa Ana, California. (‑220,000), followed by New York-Northern New Jersey-Long Island, New York-New Jersey-Pennsylvania. (‑216,400), and Chicago-Naperville-Joliet, Illinois-Indiana-Wisconsin (‑207,800). The largest over-the-year percentage losses in employment were reported in Kokomo, Indiana (‑8.5 percent), Dalton, Georgia (‑8.4 percent), and Elkhart-Goshen, Indiana, Holland-Grand Haven, Michigan, and Phoenix-Mesa-Scottsdale, Arizona (‑8.0 percent each).
The largest over-the-year increases in employment occurred in McAllen-Edinburg-Mission, Texas (+3,100), Kennewick-Pasco-Richland, Washington (+2,900), and Sandusky, Ohio (+1,300). The largest over-the-year percentage increases in employment were reported in Sandusky, Ohio (+3.3 percent), Kennewick-Pasco-Richland, Washington (+3.0 percent), Hot Springs, Arkansas (+1.6 percent), and McAllen-Edinburg-Mission, Texas (+1.4 percent).
These data are from the State and Metropolitan Area Employment, Hours and Earnings program and are not seasonally adjusted. The most recent metropolitan area employment data are preliminary and subject to revision. To learn more, see "Metropolitan Area Employment and Unemployment: September 2009" (HTML) (PDF), news release USDL 09-1301.
Bureau of Labor Statistics, U.S. Department of Labor, The Economics Daily, Metropolitan area employment: September 2008–09 at https://www.bls.gov/opub/ted/2009/ted_20091030.htm (visited June 06, 2024).