An official website of the United States government
An official website of the United States government
The .gov means it's official.
Federal government websites often end in .gov or .mil. Before sharing sensitive information,
make sure you're on a federal government site.
The site is secure.
The
https:// ensures that you are connecting to the official website and that any
information you provide is encrypted and transmitted securely.
Table 1, figures 3–5 and 8–9, and related text were updated to correct miscalculations of the rates of overshoot and undershoot.
On January 29, 1997, the U.S. Treasury Department issued a 10-year inflation-indexed Treasury note and announced that, for the foreseeable future, 10-year Treasury Inflation-Protected Securities (TIPS) would be regularly auctioned on the 15th of January, April, July, and October of each year.1 In subsequent years, 5-, 20-, and 30-year notes were also introduced. Currently, the U.S. Treasury Department issues 5-, 10-, and 30-year notes, all indexed to the Consumer Price Index for All Urban Consumers (CPI-U).2
In 1996, a year before the U.S. Treasury Department held its first auction of 10-year notes, John Y. Campbell and Robert J. Shiller discussed the primary issues motivating interest in inflation-indexed debt.3 Among these were (1) the effect of inflation-indexed debt issuance on government borrowing costs, (2) the relative risk-sharing efficiency of inflation-indexed debt as an inflation-hedging asset, and (3) the use of inflation-indexed debt to derive market-based inflation expectations.
This article addresses the third issue. The market-based measure of inflation expectations is widely known as the breakeven rate of inflation. There are several methods to calculate the yield curve and, thus, capture the breakeven rate. As explained in more detail below, this article uses the Treasury Breakeven Inflation (TBI) curve, which is based on the nominal and real yield curves calculated by the U.S. Treasury Department. Although TBI rates are a secondary benefit of inflation-indexed debt (TIPS are primarily seen as an inflation hedge and a potentially cheaper source of debt financing), they are nonetheless viewed as a source of information on inflation expectations derived from the market activities of investors.
The breakeven rate of inflation is derived from the Treasury yield curve. The yield curve, a fundamental concept in finance, refers to the spread between long- and short-term yields on Treasury securities (e.g., the spread between 10- and 2-year Treasury notes), ultimately reflecting various expectations about long- and short-term risks to the economy and financial markets. In an economy with a reasonably positive outlook, the yield curve slopes upward, indicating greater uncertainty about longer term rates. This typical case is shown in figure 1, which graphs average monthly Treasury spot rates (derived from yields, a distinction explained in more detail below) calculated for maturities in increments of 6 months, up to 100 years, as of January 2018.
Instead of directly graphing yields (or, in the above case, spot rates), one can represent the yield curve as a graph showing the spread between, for example, the 10- and 2-year Treasury constant maturity yields. This representation is illustrated in figure 2.
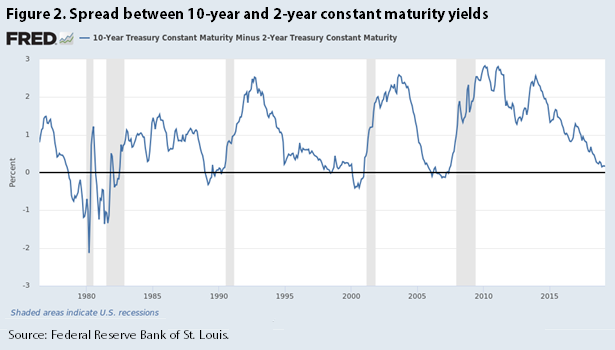
The yield curve also can slope downward, and when it does, it often signals the onset of a recession. Indeed, in her historical survey of the yield curve, Caitlin Zaloom states that “[a]n ‘inverted’ curve has preceded each recession since the mid-1960s (with one exception), a record that some use to orient their strategies, while others question its salience.”4 A downward-sloping yield curve indicates that investors expect long-term rates to decline as the economy enters into a recession, the demand for loans declines, and the U.S. Federal Reserve Board reduces rates to stimulate the economy.
Besides predicting recessions, the yield curve can predict inflation, providing a benchmark for investor expectations about future inflation. This relationship is based on the so-called Fisher effect (named after economist Irving Fisher), which is commonly represented as an equation that sets the real interest rate equal to the nominal interest rate minus inflation.5 The intuition behind the equation is based on the observation that, to arrive at the real return on a dollar of investment, one must discount the nominal return on that dollar by the rate of inflation. Because inflation measures the change in purchasing power on a dollar of nominal return, the breakeven inflation rate is derived as a discount rate that equates the nominal return on a dollar of investment to the real return (not as an arithmetic difference between the nominal and real rates). For example, one can use the nominal and real yield curves to obtain, respectively, the nominal and real yields on 1-, 2-, and 10-year Treasury securities. From these yields, one can derive the 1-, 2-, and 10-year nominal and real spot rates. These spot rates can then be used to derive forward rates, which reflect rates that would prevail over a specified horizon beyond some future point.
Once yields, spot rates, or forward rates are obtained, breakeven inflation rates can be derived as annualized rates from the nominal and real rates of return (yields or spot rates) on Treasury securities. Consistent with market convention, nominal and real rates of return on fixed-income securities are calculated semiannually, while inflation rates are calculated annually. Thus, the TBI curve converts semiannually compounded nominal and real rates to annual rates, which can then be compared with annual CPI-U inflation rates. The TBI rate is the expected annualized rate of inflation and is calculated as

where the nominal and real spot rates are the monthly average nominal and real spot rates published by the U.S. Treasury Department.6
Breakeven rates may have an upward bias because of a term premium (embedded in the nominal yield) that reflects uncertainty about future inflation. Alternatively, breakeven rates may have a downward bias because of a term premium that reflects the relative illiquidity of TIPS. Moreover, in practice, nominal and real yields tend to be lower than their respective spot rates, and this difference creates a downward bias in breakeven rates when one uses yields instead of spot rates.7 Finally, market volatility implies that expectations will not always match reality. Nonetheless, investors view TBI rates as a barometer of future inflation rates.
A vast literature studies the dynamics of inflation. Since the emergence of inflation-indexed sovereign debt in the United States, a segment of this literature has examined an observed discrepancy between, on the one hand, the breakeven rate of inflation and survey-based measures of inflation expectations, and, on the other, the breakeven rate of inflation and the realized rate of inflation. Not long after the initial issuance of inflation-indexed debt by the U.S. Treasury Department, economists began to observe that TIPS breakeven rates frequently underestimated both survey-based forecasts of inflation and realized rates of consumer price inflation.
The literature focuses primarily on two risk premiums embedded in Treasury securities: (1) the inflation risk premium embedded in the nominal yield on ordinary Treasury securities, and (2) the liquidity risk premium embedded in the real yield on TIPS. In a 2013 journal article, Olesya V. Grishchenko and Jing-Zhi Huang note the lack of consensus on the size of the inflation risk premium and on whether that premium is positive or negative, which often depends on economic circumstances.8 However, in a 2010 study of inflation-hedging strategies based on various asset classes, Geert Bekaert and Xiaozheng Wang present historical evidence that the inflation risk premium tends to be positive, reflecting compensation to investors for bearing the risk of inflation volatility.9
A positive inflation risk premium increases the nominal yield on ordinary Treasury securities or, alternatively, decreases the real yield on TIPS (because investors effectively pay “insurance” to avoid inflation risk). All else equal, a lower TIPS yield (or, alternatively, a higher nominal yield on ordinary Treasury securities) leads the breakeven rate of inflation to overshoot realized inflation.
The liquidity risk premium also tends to be positive, reflecting compensation to investors for bearing the risk associated with TIPS having a lower level of liquidity than ordinary Treasury securities. TIPS are less liquid because they lack the market depth of ordinary Treasury securities, are typically held by buy-and-hold investors seeking an inflation hedge, and, in the early years of their issuance, bore the uncertainty of whether the U.S. Treasury Department would continue to issue inflation-indexed debt. A positive liquidity risk premium increases the real yield on TIPS, and, all else equal, this increase leads the breakeven rate of inflation to undershoot realized inflation.
If the inflation risk premium and the liquidity risk premium are equal, they cancel each other and the breakeven rate of inflation approximates realized inflation (assuming other market factors driving the supply and demand of government debt remain constant). However, because breakeven rates have been found to consistently underestimate survey-based inflation expectations and actual inflation, the literature on TIPS has often focused on estimating the liquidity premium.10
It should be noted that breakeven rates are only one method for forecasting inflation. In a 2007 article, Andrew Ang, Geert Bekaert, and Min Wei discuss four alternative methods: “time-series ARIMA models; regressions using real activity measures motivated from the Phillips curve; term structure models that include linear, nonlinear, and arbitrage-free specifications; and survey-based measures.”11 In general, the authors conclude that surveys generate the best forecasts, especially in comparison with term structure models, and that combining forecasts from different approaches does not improve the results.
The economic literature typically focuses on several theoretical and empirical aspects of inflation-indexed debt, using a variety of modeling techniques to forecast inflation. By contrast, the present article is concerned with the efficacy of TIPS breakeven rates—specifically those calculated from the Treasury Breakeven Inflation (TBI) curve—as a measure of market-based inflation expectations. The analysis uses monthly breakeven rates, calculated for short- and long-term maturity horizons by the U.S. Treasury Department, to examine how well market-based inflation expectations matched realized inflation before, during, and after the Great Recession. To my knowledge, this is the first attempt to use the TBI curve to examine the efficacy of breakeven inflation rates on a monthly basis.
The TBI curve is derived from nominal and real rates of return on off-the-run, coupon-issue Treasury notes and bonds—or, more specifically, from the Treasury Nominal Coupon-Issue (TNC) and Treasury Real Coupon-Issue (TRC) yield curves.12 The TNC curve is derived by adjusting for a hump in yields observed at the 20-year maturity horizon and for the price difference between on-the-run and off-the-run securities. The TRC curve is derived from returns on TIPS, on the basis of a methodology similar to that used for deriving the TNC curve. However, while the TRC methodology adjusts for the hump in yields at the 20-year maturity horizon, it does not distinguish between on-the-run and off-the-run securities.13 The TBI curve shows monthly breakeven inflation rates derived from the TNC and TRC curves, using incremental 6-month maturity horizons.
Breakeven rates can be obtained directly from the Treasury yield curves, from spot rates derived from the Treasury yield curves, or from forward rates derived from spot rates.14 Despite some debate about which measure is most appropriate, the use of spot rates is generally the best approach for arriving at a “prediction” of future inflation. Because spot rates equate a one-time future payment (e.g., a principal repayment) to its present value (i.e., the rate of return on a zero-coupon bond), they avoid the complexities associated with yields or, more specifically, the yield to maturity (YTM). The YTM is an internal rate of return that equalizes the cash outflow resulting from the purchase of a Treasury security (or any fixed income security) with the cash inflow generated by coupon payments (assumed to be reinvested at a fixed rate) and the repayment of principal at the end of term. It is important to note, however, that forward rates can also be used to predict future inflation.
In practice, in making inflation predictions, investors and the financial press often rely on breakeven inflation rates derived from both yields and spot rates. Either way, TBI rates, derived from the TNC and TRC curves (which use spot rates), are increasingly used as a measure of inflation expectations. For example, in computing lump-sum retirement payouts, the Uniformed Services Blended Retirement System of the U.S. Department of Defense uses the U.S. Treasury Department’s breakeven inflation rates.15
To measure actual inflation, this analysis relies on annualized rates of change in the nonseasonally adjusted U.S. city-average, all-items Consumer Price Index for All Urban Consumers (CPI-U) (1982–84 = 100). The CPI-U measures the average change over time in the prices paid by urban consumers for a constant-quality market basket of goods and services (i.e., a sample of goods and services purchased by consumers). Produced monthly, the CPI-U weights the price of each item in the market basket by the amount of spending reported by a sample of families and individuals. It also reflects additional adjustments, such as imputation (to account for missing quotes) and hedonics (to account for changes in item quality).16
This analysis uses the CPI-U because the real yields on Treasury securities are derived from TIPS, which adjust principal and coupon payments by the rate of change in the nonseasonally adjusted CPI-U. Thus, the real yield is equal to the inflation-adjusted coupon payments divided by the market price of Treasury securities.
TBI rates are mapped to their respective annualized CPI-U inflation rates. For example, the 6-month TBI rate in January 2003 (0.39 percent) is matched to the annualized CPI-U inflation rate (2.44 percent) from January to July 2003 (i.e., the squared 6-month rate of change in the CPI-U between January 2003 and July 2003). Because the TBI data begin in January 2003, the first month in which a TBI rate is available for matching is July 2003 (for the rate derived from 6-month spot rates on Treasury securities in January 2003), the second month is August 2003 (for the rate derived from 6-month spot rates on Treasury securities in February 2003), and so on, until December 2003. In January 2004, two TBI rates become available for matching (the rate derived from 6-month spot rates on Treasury securities in July 2003 and the rate derived from 1-year spot rates on Treasury securities in January 2003), and the same holds for all months until June 2004. In July 2004, three TBI rates become available for matching.
Given that the TBI data begin in January 2003, CPI-U rates published from July to December 2003 can only be compared with TBI rates derived from spot rates on Treasury securities with a 6-month maturity from January to June 2003. TBI rates are unavailable for matching when they are derived from spot rates on Treasury securities with a 1-year maturity from July to December 2002, from spot rates with a 1.5-year maturity from January to June 2002, and so on.
Because TBI data are unavailable before January 2003, more TBI rates are available for matching in later than earlier years. For example, there are 10 years of TBI rates available for matching in January 2013, which, given that TBI rates are available in 6-month increments, equates to 20 TBI rates. These rates are based, respectively, on the 6-month spot rates on Treasury securities in July 2012, on the 1-year spot rates on Treasury securities in January 2012, and so on, back to January 2003.
Given that TBI rates for longer maturity horizons are available only for their annualized CPI-U inflation rates in later months, the number of observations of TBI rates derived from spot rates on Treasury securities with a shorter maturity (e.g., 6 months) is greater than the number of TBI rates derived from spot rates on Treasury securities with a longer maturity (e.g., 1 year). (See table 1.)
| Maturity horizon (years) | Observations | Deviations | Standard deviation | Maximum | Minimum | Range | Overshoot | Undershoot | |||
|---|---|---|---|---|---|---|---|---|---|---|---|
| Average | Median | Number | Percent | Number | Percent | ||||||
0.5 | 175 | -0.80 | -0.69 | 2.95 | 10.44 | -13.17 | 23.61 | 60 | 34.29 | 115 | 65.71 |
1.0 | 169 | -0.69 | -0.81 | 1.82 | 4.69 | -8.98 | 13.67 | 52 | 30.77 | 117 | 69.23 |
1.5 | 163 | -0.58 | -0.59 | 1.58 | 3.65 | -7.27 | 10.91 | 63 | 38.65 | 100 | 61.35 |
2.0 | 157 | -0.47 | -0.42 | 1.33 | 3.00 | -5.11 | 8.11 | 58 | 36.94 | 99 | 63.06 |
2.5 | 151 | -0.38 | -0.23 | 1.36 | 2.66 | -5.89 | 8.55 | 66 | 43.71 | 85 | 56.29 |
3.0 | 145 | -0.31 | -0.06 | 1.19 | 1.65 | -4.94 | 6.59 | 69 | 47.59 | 76 | 52.41 |
3.5 | 139 | -0.24 | 0.01 | 1.17 | 1.68 | -4.79 | 6.48 | 71 | 51.08 | 68 | 48.92 |
4.0 | 133 | -0.22 | 0.14 | 1.07 | 1.37 | -4.26 | 5.63 | 75 | 56.39 | 58 | 43.61 |
4.5 | 127 | -0.18 | 0.03 | 1.06 | 1.39 | -4.18 | 5.57 | 67 | 52.76 | 60 | 47.24 |
5.0 | 121 | -0.10 | 0.13 | 0.92 | 1.20 | -3.69 | 4.90 | 70 | 57.85 | 51 | 42.15 |
5.5 | 115 | -0.05 | 0.13 | 0.84 | 1.28 | -3.68 | 4.96 | 68 | 59.13 | 47 | 40.87 |
6.0 | 109 | 0.01 | 0.13 | 0.68 | 1.12 | -2.98 | 4.10 | 68 | 62.39 | 41 | 37.61 |
6.5 | 103 | 0.06 | 0.15 | 0.68 | 1.50 | -2.82 | 4.32 | 64 | 62.14 | 39 | 37.86 |
7.0 | 97 | 0.09 | 0.16 | 0.59 | 1.31 | -2.27 | 3.58 | 64 | 65.98 | 33 | 34.02 |
7.5 | 91 | 0.16 | 0.23 | 0.62 | 1.54 | -2.13 | 3.66 | 63 | 69.23 | 28 | 30.77 |
8.0 | 85 | 0.21 | 0.28 | 0.61 | 1.44 | -1.75 | 3.20 | 60 | 70.59 | 25 | 29.41 |
8.5 | 79 | 0.27 | 0.33 | 0.62 | 1.51 | -1.56 | 3.07 | 55 | 69.62 | 24 | 30.38 |
9.0 | 73 | 0.38 | 0.50 | 0.58 | 1.46 | -1.30 | 2.76 | 55 | 75.34 | 18 | 24.66 |
9.5 | 67 | 0.49 | 0.56 | 0.50 | 1.50 | -0.66 | 2.15 | 54 | 80.60 | 13 | 19.40 |
10.0 | 61 | 0.47 | 0.57 | 0.43 | 1.04 | -0.68 | 1.71 | 52 | 85.25 | 9 | 14.75 |
10.5 | 55 | 0.48 | 0.57 | 0.43 | 1.09 | -0.51 | 1.61 | 46 | 83.64 | 9 | 16.36 |
11.0 | 49 | 0.50 | 0.60 | 0.42 | 1.06 | -0.59 | 1.65 | 42 | 85.71 | 7 | 14.29 |
11.5 | 43 | 0.54 | 0.66 | 0.40 | 1.08 | -0.35 | 1.43 | 37 | 86.05 | 6 | 13.95 |
12.0 | 37 | 0.53 | 0.64 | 0.36 | 1.01 | -0.35 | 1.36 | 33 | 89.19 | 4 | 10.81 |
12.5 | 31 | 0.53 | 0.61 | 0.36 | 1.07 | -0.17 | 1.24 | 27 | 87.10 | 4 | 12.90 |
13.0 | 25 | 0.51 | 0.58 | 0.36 | 1.05 | -0.21 | 1.26 | 22 | 88.00 | 3 | 12.00 |
13.5 | 19 | 0.45 | 0.44 | 0.37 | 1.08 | -0.12 | 1.21 | 17 | 89.47 | 2 | 10.53 |
14.0 | 13 | 0.28 | 0.22 | 0.27 | 0.61 | -0.14 | 0.75 | 11 | 84.62 | 2 | 15.38 |
14.5 | 7 | 0.09 | 0.16 | 0.13 | 0.25 | -0.09 | 0.34 | 5 | 71.43 | 2 | 28.57 |
15.0 | 1 | 0.19 | 0.19 | — | 0.19 | 0.19 | 0.00 | 1 | 100.00 | 0 | 0.00 |
Note: TBI = Treasury Breakeven Inflation; CPI-U = Consumer Price Index for All Urban Consumers. Source: U.S. Bureau of Labor Statistics and U.S. Department of the Treasury. | |||||||||||
This section examines the discrepancy between expected and actual inflation by calculating the difference between the TBI rate for a specific maturity horizon and its respective annualized CPI-U rate of change. Given the incremental nature of the data, this difference is calculated for every month from July 2003 to January 2018 for the 6-month maturity horizon (6-month TBI rates are available for matching to their respective annualized CPI-U inflation rates for all months between July 2003 and January 2018), for every month from January 2004 to January 2018 for the 1-year maturity horizon (1-year TBI rates are available for matching for all months between January 2004 and January 2018), and so on. Although the number of observations decreases with each maturity horizon, there are still 30 or more observations available for maturity horizons of 12.5 or fewer years. Given this framework, three main results follow.
The analysis reveals that the average deviations between TBI rates and annualized CPI-U inflation rates never exceed 80 basis points for any 6-month increment (1 basis point equals one-hundredth of a percent, so 100 basis points equal 1 percent), and for maturity horizons of 2 or more years, they never exceed 55 basis points. The median deviations never exceed 70 basis points (except at the 1-year horizon). (See table 1 and figures 3 and 4.) If we take the average or the median of the average deviations per horizon, the TBI rate virtually equals the annualized CPI-U inflation rate (the average of averages per horizon is 7 basis points, and the median of averages per horizon is 13 basis points), and the same holds for the average or the median of the median deviations per horizon (the average of medians is 17 basis points, and the median of medians is 19 basis points).
The percentage of TBI rates that exceed actual annualized inflation decreases as the maturity horizon increases. Of the 175 observations available at the 6-month maturity horizon, 34 percent of TBI rates overshoot the matching CPI-U inflation rates. At the 2-year maturity horizon, 37 percent of TBI rates overshoot the matching CPI-U inflation rates. For maturity horizons with 30 or more observations, this percentage steadily increases until the 13-year maturity horizon, when 88 percent of TBI rates (out of 25 observations) overshoot the matching annualized CPI-U inflation rates. On the flip side, the percentage of TBI rates that undershoot actual inflation steadily decreases as the maturity horizon increases. In both cases, however, the degree to which TBI rates overestimate or underestimate actual annualized inflation is small, as evidenced by the average and median deviations cited above. Given that TBI expectations overshoot actual inflation in the long term and undershoot inflation in the short term, it is likely that the liquidity premium has a considerable effect in the short term but gets more than offset by the inflation premium in the long term. Note, however, that only TBI rates for longer horizons are available for matching to their respective annualized CPI-U inflation rates in the early years of the TBI data.
As noted earlier, the TBI data begin in January 2003, 6 years after the first issuance of inflation-indexed debt. Given that the TIPS market was more established by then, it was more liquid, causing the liquidity premium to be smaller. Indeed, for maturities ranging from 3.5 years (the first horizon at which more than 50 percent of the observed TBI rates overshoot actual inflation) to 12.5 years (the horizon after which the number of observations falls below 30), the average deviation between expected and realized inflation never exceeds 54 basis points and the median deviation never exceeds 66 basis points. (Moreover, over this time span, the average of averages across all horizons is 21 basis points and the average of medians is 34 basis points.) Because observations at the 12.5-year maturity horizon begin in July 2015 and end in January 2018, they are based on TBI rates calculated for January 2003 through July 2004. (See figure 5.)
While the average and median differences between TBI rates and actual annualized inflation rates are small, the dispersion of those differences decreases as the maturity horizon increases. This result holds when one measures dispersion by standard deviation, range, and maximum and minimum differences. The standard deviation of the differences between expected and realized inflation decreases from a peak of 2.95 at the 0.5-year horizon (175 observations) to 0.13 at the 14.5-year horizon (7 observations). (With only one observation at the 15-year horizon, the standard deviation is not defined.) The range of differences decreases from a peak of 23.61 at the 0.5-year horizon to 0.34 at the 14.5-year horizon. (With only one observation at the 15-year horizon, the maximum and minimum differences are the same.) The largest maximum difference between expected and realized inflation (10.44) is observed at the 0.5-year horizon, and the smallest maximum difference (0.25) is observed at the 14.5-year horizon. The largest minimum difference (−13.77) is observed at the 0.5-year horizon, and the smallest minimum difference (−0.09) is observed at the 14.5-year horizon. (See figures 6, 7, 8, and 9.)
This article finds that TBI rates reasonably approximated inflation reality before, during, and after the Great Recession. In the analysis, the average and median deviations between TBI rates and their respective annualized CPI-U inflation rates never exceed 81 basis points. Moreover, the dispersion of deviations, as measured by standard deviation and range, decreases as the maturity horizon increases. Given that TBI expectations overshoot actual inflation in the long term and undershoot inflation in the short term, it is likely that the liquidity premium has a considerable effect in the short term but gets more than offset by the inflation premium in the long term.
Abrahams, Michael, Tobias Adrian, Richard K. Crump, and Emanuel Moench. “Decomposing real and nominal yield curves.” Staff Report 570, Federal Reserve Bank of New York, September 2012, revised February 2015, https://www.newyorkfed.org/medialibrary/media/research/staff_reports/sr570.pdf.
Andonov, Aleksandar, Florian Bardong, and Thorsten Lehnert. “TIPS, inflation expectations, and the financial crisis.” Financial Analysts Journal, vol. 66, no. 6, November/December 2010, pp. 27–39.
Andreasen, Martin M., and Jens H. E. Christensen. “TIPS liquidity and the outlook for inflation.” Federal Reserve Bank of San Francisco Economic Letter, November 21, 2016, https://www.frbsf.org/economic-research/publications/economic-letter/2016/november/tips-liquidity-and-the-outlook-for-inflation/.
Andreasen, Martin M., Jens H. E. Christensen, and Simon Riddell. “The TIPS liquidity premium.” Working Paper 2017-11, Federal Reserve Bank of San Francisco, March 2018, https://www.frbsf.org/economic-research/files/wp2017-11.pdf.
Ang, Andrew, Geert Bekaert, and Min Wei. “Do macro variables, asset markets, or surveys forecast inflation better?” Journal of Monetary Economics, vol. 54, no. 4, May 2007, pp. 1163–1212.
———. “The term structure of real rates and expected inflation.” Working Paper 12930, National Bureau of Economic Research, February 2007, https://www.nber.org/papers/w12930.pdf.
Aruoba, S. Borağan. “Term structures of inflation expectations and real interest rates: the effects of unconventional monetary policy.” Staff Report 502, Federal Reserve Bank of Minneapolis, August 2014, https://www.minneapolisfed.org/research/sr/sr502.pdf.
———. “Term structures of inflation expectations and real interest rates.” Federal Reserve Banks of Minneapolis and Philadelphia, January 18, 2018, http://econweb.umd.edu/~webspace/aruoba/research/paper22/Aruoba_Inflation_Expectations.pdf.
Bekaert, Geert, and Xiaozheng Wang. “Inflation risk and the inflation risk premium.” Economic Policy, vol. 25, no. 64, October 2010, pp. 755–806, https://www0.gsb.columbia.edu/faculty/gbekaert/papers/inflation_risk.pdf.
Campbell, John Y., and Robert J. Shiller. “A scorecard for indexed government debt.” National Bureau of Economic Research, January 1996, https://www.nber.org/chapters/c11029.pdf.
Campbell, John Y., Robert J. Shiller, and Luis M. Viceira. “Understanding inflation-indexed bond markets.” Working Paper 15014, National Bureau of Economic Research, May 2009, https://www.nber.org/papers/w15014.pdf.
Carlstrom, Charles T., and Timothy S. Fuerst. “Expected inflation and TIPS.” Federal Reserve Bank of Cleveland, November 1, 2004, https://www.clevelandfed.org/newsroom-and-events/publications/economic-commentary/economic-commentary-archives/2004-economic-commentaries/ec-20041101-expected-inflation-and-tips.aspx.
Christensen, Jens, and James Gillan. “TIPS liquidity, breakeven inflation, and inflation expectations.” Federal Reserve Bank of San Francisco Economic Letter, June 20, 2011, https://www.frbsf.org/economic-research/publications/economic-letter/2011/june/tips-liquidity-breakeven-inflation-expectations/.
Coroneo, Laura. “TIPS liquidity premium and quantitative easing.” University of York Discussion Papers in Economics, vol. 15, no. 23, October 27, 2015, https://www.york.ac.uk/media/economics/documents/discussionpapers/2015/1523.pdf.
Craig, Ben. “Why are TIIS yields so high? The case of the missing inflation-risk premium.” Federal Reserve Bank of Cleveland, March 15, 2003, https://www.clevelandfed.org/newsroom-and-events/publications/economic-commentary/economic-commentary-archives/2003-economic-commentaries/ec-20030315-why-are-tiis-yields-so-high-the-case-of-the-missing-inflation-risk-premium.aspx.
D’Amico, Stefania, Don H. Kim, and Min Wei. “Tips from TIPS: the informational content of Treasury Inflation-Protected Security prices.” Federal Reserve Board, Finance and Economics Discussion Series, 2014, https://www.federalreserve.gov/pubs/feds/2014/201424/201424pap.pdf.
Dudley, William C., Jennifer Roush, and Michelle Steinberg Ezer. “The case for TIPS: an examination of the costs and benefits.” Federal Reserve Bank of New York Economic Policy Review, vol. 15, no.1, July 2009, https://www.newyorkfed.org/medialibrary/media/research/epr/09v15n1/0907dudl.pdf.
Fisher, Irving. “Appreciation and interest.” Publications of the American Economic Association, vol. XI, no. 4, August 1896, pp. 331–442, https://www.policonomics.com/wp-content/uploads/Appreciation-and-Interest.pdf.
———. The theory of interest, as determined by impatience to spend income and opportunity to invest it. New York: The Macmillan Company, 1930, http://files.libertyfund.org/files/1416/Fisher_0219.pdf.
———. The rate of interest: its nature, determination, and relation to economic phenomena. New York: The Macmillan Company, 1907, https://socialsciences.mcmaster.ca/econ/ugcm/3ll3/fisher/RateofInterest.pdf.
Fisher, Mark. “Modeling the term structure of interest rates: an introduction.” Federal Reserve Bank of Atlanta Economic Review, 3rd quarter 2004, https://www.frbatlanta.org/-/media/documents/research/publications/economic-review/2004/vol89no3_fisher.pdf.
Gibson, Rajna, François-Serge Lhabitant, and Denis Talay. “Modeling the term structure of interest rates: a review of the literature.” RiskLab, June 2001, http://www2.risklab.ch/ftp/papers/TermStructureSurvey.pdf.
Girola, James A. “The Treasury real yield curve and breakeven inflation.” PowerPoint presentation. U.S. Department of the Treasury, July 21, 2015, https://www.treasury.gov/resource-center/economic-policy/corp-bond-yield/Documents/tii_may2015.pdf.
———. “The yield curve for Treasury nominal coupon issues.” PowerPoint presentation. U.S. Department of the Treasury, May 16, 2014, https://www.treasury.gov/resource-center/economic-policy/corp-bond-yield/Documents/trp_apr2014.pdf.
Gospodinov, Nikolay, and Bin Wei. “A note on extracting inflation expectations from market prices of TIPS and inflation derivatives.” Federal Reserve Bank of Atlanta, November 2015, https://www.frbatlanta.org/-/media/documents/news/speeches/2015/note-on-extracting-inflation-expectations.pdf.
Grishchenko, Olesya V., and Jing-Zhi Huang. “The inflation risk premium: evidence from the TIPS market.” The Journal of Fixed Income, vol. 22, no. 4, spring 2013, pp. 5–30.
Kathari, S. P., and Jay Shanken. “Asset allocation with inflation-protected bonds.” Financial Analysts Journal, vol. 60, no. 1, January/February 2004, pp. 54–70.
Kitsul, Yuriy, and Jonathan H. Wright. “The economics of options-implied inflation probability density functions.” Working Paper 18195, National Bureau of Economic Research, June 2012, https://www.nber.org/papers/w18195.
Pflueger, Carolin E., and Luis M. Viceira. “An empirical decomposition of risk and liquidity in nominal and inflation-indexed government bonds.” Boston, MA: Harvard Business School, March 2012.
Shen, Pu. “Liquidity risk premia and breakeven inflation rates.” Federal Reserve Bank of Kansas City Economic Review, 2nd quarter 2006.
U.S. Bureau of Labor Statistics. Handbook of methods, chapter 17, “The Consumer Price Index (updated 2-14-2018),” https://www.bls.gov/opub/hom/pdf/cpi-20180214.pdf.
Zaloom, Caitlin. “How to read the future: the yield curve, affect, and financial prediction.” Public Culture, vol. 21, no. 2, spring 2009, pp. 245–268, https://as.nyu.edu/content/dam/nyu-as/faculty/documents/zaloom.howtoreadfuture.pdf.
Jonathan D. Church, "Inflation expectations and inflation realities: a comparison of the Treasury Breakeven Inflation curve and the Consumer Price Index before, during, and after the Great Recession," Monthly Labor Review, U.S. Bureau of Labor Statistics, December 2019, https://doi.org/10.21916/mlr.2019.26
1 Treasury Inflation-Protected Securities (TIPS) would subsequently be renamed Treasury Inflation-Indexed Securities, but TIPS remains in the market lexicon.
2 For a TIPS timeline, see https://www.treasurydirect.gov/indiv/research/history/histtime/histtime_tips.htm. See also https://www.treasurydirect.gov/indiv/research/indepth/tips/res_tips.htm.
3 John Y. Campbell and Robert J. Shiller, “A scorecard for indexed government debt” (National Bureau of Economic Research, January 1996), https://www.nber.org/chapters/c11029.pdf.
4 Caitlin Zaloom, “How to read the future: the yield curve, affect, and financial prediction,” Public Culture, no. 21, no. 2, spring 2009, pp. 245–268, https://as.nyu.edu/content/dam/nyu-as/faculty/documents/zaloom.howtoreadfuture.pdf.
5 See Irving Fisher, “Appreciation and interest,” Publications of the American Economic Association, vol. XI, no. 4, August 1896, pp. 331–442, https://www.policonomics.com/wp-content/uploads/Appreciation-and-Interest.pdf; Fisher, The theory of interest, as determined by impatience to spend income and opportunity to invest it (New York: The Macmillan Company, 1930), http://files.libertyfund.org/files/1416/Fisher_0219.pdf; and Fisher, The rate of interest: its nature, determination, and relation to economic phenomena (New York: The Macmillan Company, 1907), https://socialsciences.mcmaster.ca/econ/ugcm/3ll3/fisher/RateofInterest.pdf.
6 For more information on the derivation of the TBI curve, see James A. Girola, “The Treasury real yield curve and breakeven inflation,” PowerPoint presentation (U.S. Department of the Treasury, July 21, 2015), https://www.treasury.gov/resource-center/economic-policy/corp-bond-yield/Documents/tii_may2015.pdf.
7 See ibid., slides 33 and 34.
8 Olesya V. Grishchenko and Jing-Zhi Huang, “The inflation risk premium: evidence from the TIPS market,” The Journal of Fixed Income, vol. 22, no. 4, spring 2013, pp. 5–30.
9 Geert Bekaert and Xiaozheng Wang, “Inflation risk and the inflation risk premium,” Economic Policy, vol. 25, no. 64, October 2010, pp. 755–806, https://www0.gsb.columbia.edu/faculty/gbekaert/papers/inflation_risk.pdf.
10 Examples of papers attempting to estimate the liquidity premium include Charles T. Carlstrom and Timothy S. Fuerst, “Expected inflation and TIPS” (Federal Reserve Bank of Cleveland, November 1, 2004), https://www.clevelandfed.org/newsroom-and-events/publications/economic-commentary/economic-commentary-archives/2004-economic-commentaries/ec-20041101-expected-inflation-and-tips.aspx; Pu Shen, “Liquidity risk premia and breakeven inflation rates,” Economic Review (Federal Reserve Bank of Kansas City, 2nd quarter 2006); Jens Christensen and James Gillan, “TIPS liquidity, breakeven inflation, and inflation expectations,” Economic Letter (Federal Reserve Bank of San Francisco, June 20, 2011), https://www.frbsf.org/economic-research/publications/economic-letter/2011/june/tips-liquidity-breakeven-inflation-expectations/; Michael Abrahams, Tobias Adrian, Richard K. Crump, and Emanuel Moench, “Decomposing real and nominal yield curves,” Staff Report 570 (Federal Reserve Bank of New York, September 2012, revised February 2015), https://www.newyorkfed.org/medialibrary/media/research/staff_reports/sr570.pdf; Carolin E. Pflueger and Luis M. Viceira, “An empirical decomposition of risk and liquidity in nominal and inflation-indexed government bonds” (Boston, MA: Harvard Business School, March 2012); Stefania D’Amico, Don H. Kim, and Min Wei, “Tips from TIPS: the informational content of Treasury Inflation-Protected Security prices,” Finance and Economics Discussion Series (Federal Reserve Board, 2014), https://www.federalreserve.gov/pubs/feds/2014/201424/201424pap.pdf; Laura Coroneo, “TIPS liquidity premium and quantitative easing,” University of York Discussion Papers in Economics, vol. 15, no. 23, October 27, 2015, https://www.york.ac.uk/media/economics/documents/discussionpapers/2015/1523.pdf; Nikolay Gospodinov and Bin Wei, “A note on extracting inflation expectations from market prices of TIPS and inflation derivatives” (Federal Reserve Bank of Atlanta, November 2015), https://www.frbatlanta.org/-/media/documents/news/speeches/2015/note-on-extracting-inflation-expectations.pdf; and Martin M. Andreasen and Jens H. E. Christensen, “TIPS liquidity and the outlook for inflation,” Economic Letter (Federal Reserve Bank of San Francisco, November 21, 2016), https://www.frbsf.org/economic-research/publications/economic-letter/2016/november/tips-liquidity-and-the-outlook-for-inflation/. The bibliography provides a more comprehensive list of papers relevant to this discussion.
11 Andrew Ang, Geert Bekaert, and Min Wei, “Do macro variables, asset markets, or surveys forecast inflation better?” Journal of Monetary Economics, vol. 54, no. 4, May 2007, pp. 1163–1212.
12 For more information on these curves, see James A. Girola, “The yield curve for Treasury nominal coupon issues,” PowerPoint presentation (U.S. Department of the Treasury, May 16, 2014), https://www.treasury.gov/resource-center/economic-policy/corp-bond-yield/Documents/trp_apr2014.pdf; and Girola, “The Treasury real yield curve and breakeven inflation.”
13 As explained by Girola (“The Treasury real yield curve and breakeven inflation,” slide 15), “This is because no noticeable on-the-run effects appear in the TIPS market. Moreover, the number of TIPS is so small that it would not be possible to sort out statistically any on-the-run effects. Therefore, the TNC regression variables for on-the-run and first off-the-run are omitted from the TRC yield curve.”
14 TNC, TRC, and TBI data are available at https://www.treasury.gov/resource-center/economic-policy/corp-bond-yield/Pages/TNC-YC.aspx.
15 According to the Blended Retirement System policy of the Uniformed Services, “In computing the amount of the lump sum described in 7.a.(3)(c) of Attachment 1, the discounted present value will be determined in accordance with the rate that is an inflation-adjusted 7-year average of the Department of Treasury High-Quality Market (HQM) Corporate Bond Spot Rate Yield Curve at a 23-year maturity plus an adjustment factor of 4.28 percentage points. The inflation adjustment applied is the Department of Treasury ‘Breakeven Inflation Spot Rate Yield Curve.’” See attachment 2 in “Implementation of the Blended Retirement System,” memorandum (U.S. Department of Defense, January 27, 2017), http://militarypay.defense.gov/Portals/3/Documents/BlendedRetirementDocuments/Combined%20BRS%20Policy%20Document.pdf?ver=2018-01-02-105828-370.
16 For more information, see chapter 17, “The Consumer Price Index (updated 2-14-2018),” in Handbook of methods (U.S. Bureau of Labor Statistics, updated February 14, 2018), https://www.bls.gov/opub/hom/pdf/cpi-20180214.pdf.