An official website of the United States government
An official website of the United States government
The .gov means it's official.
Federal government websites often end in .gov or .mil. Before sharing sensitive information,
make sure you're on a federal government site.
The site is secure.
The
https:// ensures that you are connecting to the official website and that any
information you provide is encrypted and transmitted securely.
June 2011
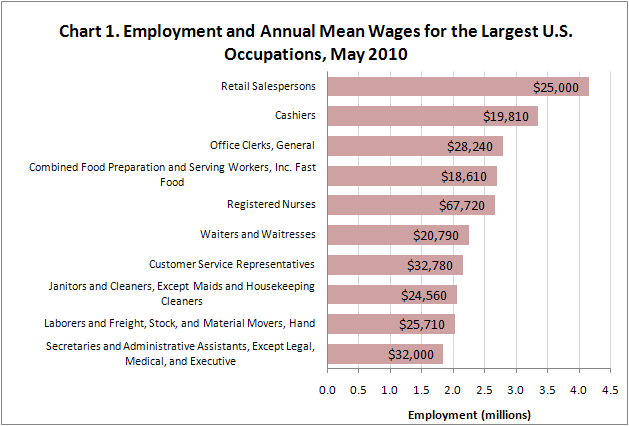
Ten occupations accounted for more than 1 out of every 5 U.S. jobs in May 2010. Retail salespersons and cashiers were the two largest occupations, with employment of 4.2 and 3.4 million, respectively. The largest occupations also included registered nurses; janitors; and laborers and hand freight, stock, and material movers.
The majority of these occupations had low wages: of the 10 largest occupations, only registered nurses, with an annual mean wage of $67,720, had an average wage above the U.S. all-occupations mean of $44,410. Annual mean wages for the remaining largest occupations ranged from $18,610 for combined food preparation and serving workers to $32,780 for customer service representatives. (See chart 1.)
Three of the 10 largest occupations were office and administrative support jobs: general office clerks, with employment of 2.8 million; customer service representatives (2.1 million); and secretaries and administrative assistants, except legal, medical, and executive (1.8 million). Together with other office and administrative support occupations, this was the largest occupational group, making up about 1 out of every 6 U.S. jobs. (See chart 2.) Other large occupations in this group included stock clerks and order fillers and bookkeeping,accounting, and auditing clerks.
Sales and related occupations and food preparation and serving related occupations were the second and third largest occupational groups, making up about 11 and 9 percent of U.S. employment, respectively. In addition to retail salespersons and cashiers, the largest sales occupations included first-line supervisors of retail sales workers and sales representatives, wholesale and manufacturing, except technical and scientific products. The largest food preparation and serving related occupations were combined food preparation and serving workers and waiters and waitresses—both among the 10 largest occupations—as well as restaurant cooks and food preparation workers. The smallest occupational groups included legal occupations and life, physical, and social science occupations, each making up less than 1 percent of total employment.
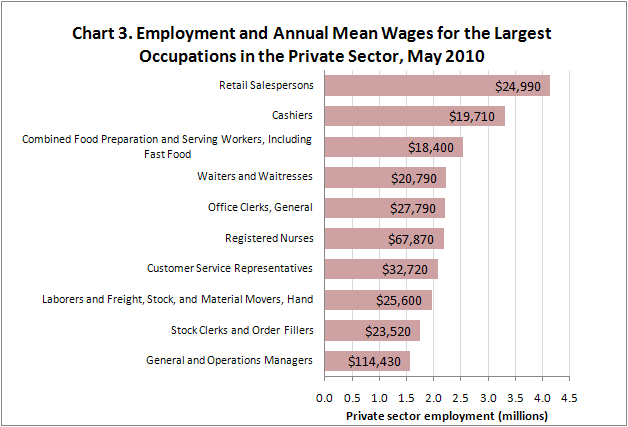
The occupations with the highest private sector employment are shown in chart 3. These are very similar to the largest occupations overall shown in chart 1: eight out of the 10 occupations are the same in both charts, with stock clerks and order fillers and general and operations managers rounding out the largest private sector occupations.
Teachers and teacher assistants made up half of the 10 largest occupations in the public sector, with the largest individual occupation, elementary school teachers, having employment of nearly 1.4 million. (See chart 4.) These teaching occupations were found primarily in local government. Correctional officers and jailers was the largest occupation in state government, with employment of 256,570. Registered nurses, police and sheriff’s patrol officers, janitors, general office clerks, and secretaries and administrative assistants were among the largest occupations in both state and local government. Other large occupations in local government included firefighters and school or special client bus drivers, while graduate teaching assistants and postsecondary health specialties teachers were among the largest state government occupations. Four occupations specific to the U.S. Postal Service made up about 21 percent of federal government employment; aside from these occupations, the largest occupations in federal government included all other business operations specialists, registered nurses, compliance officers, and management analysts.
Organizations providing health care and social assistance, such as hospitals, residential care facilities, and child day care services and preschools, accounted for about 14 percent of U.S. jobs, more than any other type of employer. Over half of employment in this sector was in healthcare-related occupations, including the two largest occupations, registered nurses, with sector employment of nearly 2.3 million, and nursing aides, orderlies, and attendants, with employment of 1.3 million. (See chart 5.) Home health aides, licensed practical and licensed vocational nurses, medical assistants, and dental assistants also were among the largest healthcare-related occupations in this sector; other large occupations included personal care aides, medical secretaries, childcare workers, and preschool teachers.
Retail trade was the second-largest industry sector, accounting for about 13 percent of overall employment. Over 60 percent of retail trade jobs were in just four occupations: retail salespersons, cashiers, stock clerks and order fillers, and first-line supervisors of retail salesworkers. Providers of educational services, manufacturers, and accommodation and food service establishments also were among the largest employers, with each of these three industry sectors accounting for 9 to 10 percent of U.S. employment. Education, training, and library occupations—including teacher assistants and elementary, middle, and secondary school teachers—made up 59 percent of employment in the educational services sector. Production occupations such as team assemblers and machinists made up about half of manufacturing employment, while 80 percent of jobs in the accommodation and food services sector were in food preparation and serving related occupations.
The U.S. mean wage across all occupations was $21.35 per hour or $44,410 per year in May 2010, but wages for individual occupations and occupational groups varied greatly around that average. The highest paying occupational groups—management and legal occupations—had annual mean wages more than double the all-occupations average, while annual mean wages for computer and mathematical occupations and architecture and engineering occupations were more than $30,000 above the U.S. average. (See chart 6.) Healthcare practitioners and technical occupations paid an average of $71,280 per year; although this group contained many of the highest-paying individual occupations, including specialist physicians and dentists, it also contained occupations with more moderate wages, such as medical and clinical laboratory technicians ($38,190) and recreational therapists ($41,440). The lowest paying occupational groups—food preparation and serving related; farming, fishing, and forestry; and personal care and service—had annual mean wages of less than $25,000.
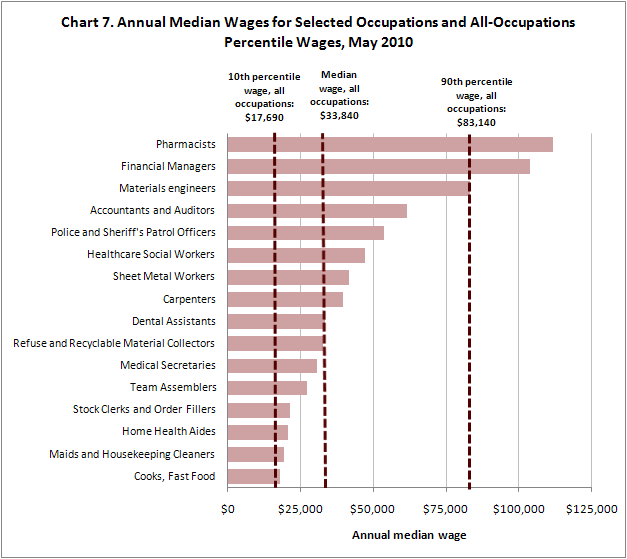
Median wages for selected occupations, along with percentile wages across all occupations, are shown in chart 7. Ten percent of jobs in the economy had wages at or below the 10th percentile wage of $17,690 per year. Because these low-paying jobs were in a variety of occupations, and because each occupation had a variety of wages, no individual occupation had a median wage below the 10 percentile; however, the lowest paying occupations had median wages only slightly above this level. Most of the lowest paying occupations were related to food preparation and serving or personal care and service, including fast food cooks, with an annual median wage of $18,100; dishwashers ($18,150); shampooers ($18,270); and amusement and recreation attendants ($18,450). Other relatively low paying occupations included cashiers ($18,500), graders and sorters of agricultural products ($19,180), childcare workers, and maids and housekeeping cleaners (both $19,300).
About half of jobs paid above and half below the U.S. all-occupations median wage of $33,840 annually. Occupations with median wages close to the all-occupations median included a number of office and administrative support, construction and extraction, and production occupations. For example, semiconductor processors, with an annual median wage of $33,130; printing press operators ($33,680); and welders, cutters, solderers, and brazers ($35,450) were some of the production occupations with median wages within 5 percent of the U.S. all-occupations median, while loan interviewers and clerks ($33,970); bookkeeping, accounting, and auditing clerks ($34,030); roofers ($34,220); and highway maintenance workers ($34,780) were some of the office support and construction occupations with wages in this range. Outside of these occupational groups, occupations with median wages near the all-occupations median included rehabilitation counselors ($32,350), dental assistants ($33,470), and parking enforcement workers ($35,390). (See chart 7.)
The highest-paid 10 percent of jobs had median wages of $83,140 or higher. Most of the occupations with median wages above this level were healthcare practitioners, such as pharmacists ($111,570) and general dentists ($141,040), or management occupations, such as human resources managers ($99,180) and financial managers ($103,910). Several computer, engineering, and science occupations also had median wages above the all-occupations 90th percentile, as did some higher-paying postsecondary teaching occupations such as postsecondary law teachers ($94,260). Architecture and engineering, science, postsecondary teaching, and healthcare practitioners and technical occupations also were prevalent among the occupations with median wages below the 90th percentile but above the all-occupations 75th percentile of $54,250; several business and financial operations occupations also had median wages in this range, including accountants and auditors ($61,690) and management analysts ($78,160).
California, Texas, New York, Florida, and Illinois were the states with the highest total employment, accounting for more than one-third of U.S. jobs. These and other states with high overall employment also had the highest employment of many individual occupations. However, smaller states often had higher shares of their employment in specific jobs, in part because of factors like geographical characteristics and industry mix. For example, Louisiana, a medium-sized state in terms of total employment, and Alaska, a smaller state, had among the highest employment concentrations of several water transportation occupations, such as sailors and marine oilers; captains, mates, and pilots of water vessels; and ship engineers. Nebraska and Idaho had some of the highest concentrations of food scientists and technologists, while South Dakota had high concentrations of animal scientists and soil and plant scientists.
Metropolitan areas and divisions with the highest total employment included New York-White Plains-Wayne, N.Y.-N.J.; Los Angeles-Long Beach-Glendale, Calif.; Chicago-Naperville-Joliet, Ill.; and Houston-Sugar Land-Baytown, Texas. As at the state level, these large metropolitan areas also tended to have high employment of many individual occupations, although smaller areas often had higher shares of their employment in a given occupation.
In some cases, both overall employment size and an above-average employment concentration contributed to an area’s high employment of a particular occupation. Employment and employment concentrations of computer hardware engineers in selected areas, as well as total area employment, are shown in chart 8. In 2010, computer hardware engineers made up about .5 jobs per 1,000 in the United States as a whole. San Jose-Sunnyvale-Santa Clara, CA, had the highest employment concentration of computer hardware engineers—over 9 jobs per thousand—as well as relatively high total employment; both of these factors helped give San Jose the highest employment of this occupation.
The Washington-Arlington-Alexandria, DC-VA-MD-WV, metropolitan division; the Boston-Cambridge-Quincy, MA-NH, NECTA division; and San Diego-Carlsbad-San Marcos, CA, also had some of the highest employment levels for computer hardware engineers. In part, this resulted from somewhat above-average employment concentrations in this occupation, but these also were large areas overall, with total employment ranging from 1.2 million in San Diego to 2.3 million in the Washington metropolitan division. On the other hand, Huntsville, AL; Fort Collins-Loveland, CO; and the Lowell-Billerica-Chelmsford, MA-NH, NECTA division had some of the highest concentrations of computer hardware engineers, ranging from 4.6 to 5.6 per 1,000 jobs. This did not always translate into high employment levels: for example, Fort Collins-Loveland employed about 700 computer hardware engineers, compared with over 3,400 in the much larger Washington, DC, metropolitan division. Wages for computer hardware engineers in the areas shown ranged from $90,720 in San Diego to $118,970 in San Jose.
Complete Occupational Employment Statistics data for May 2010 are available from the OES home page. This highlight was prepared by Audrey Watson. For more information, please contact the OES program.
Last Modified Date: January 3, 2019