An official website of the United States government
An official website of the United States government
The .gov means it's official.
Federal government websites often end in .gov or .mil. Before sharing sensitive information,
make sure you're on a federal government site.
The site is secure.
The
https:// ensures that you are connecting to the official website and that any
information you provide is encrypted and transmitted securely.
22-2356-CHI
Wednesday, January 04, 2023
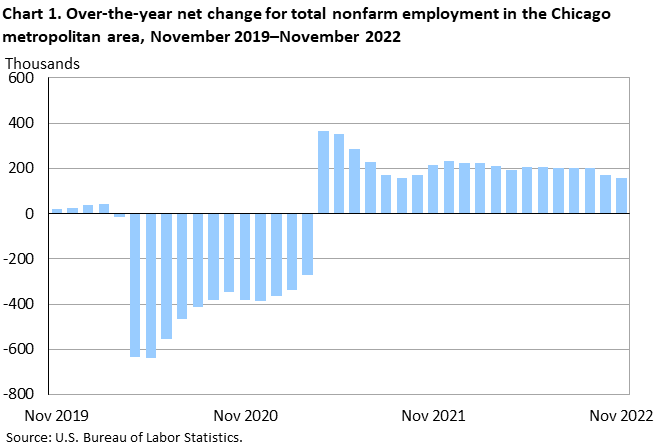
Total nonfarm employment for the Chicago-Naperville-Elgin, IL-IN-WI, metropolitan area increased by 158,000 over the year in November, the U.S. Bureau of Labor Statistics reported today. (See chart 1 and table 1.) Regional Commissioner Jason Palmer noted that the local rate of job gain, 3.4 percent, compared to the 3.2-percent national increase. (All data in this release are not seasonally adjusted; accordingly, over-the-year analysis is used throughout.)
Chicago-Naperville-Elgin, IL-IN-WI, is made up of four metropolitan divisions—separately identifiable employment centers within the greater metropolitan area. Chicago-Naperville-Arlington Heights, IL, with 80 percent of the metropolitan area’s total nonfarm employment, gained 134,200 jobs over the year. Lake County-Kenosha County, IL-WI (9 percent of the area’s employment), gained 11,500 jobs and employment in Elgin, IL (5 percent of the area’s employment), rose by 7,700 jobs. Employment in Gary, IN (6 percent of the area’s employment), was little changed over the year.
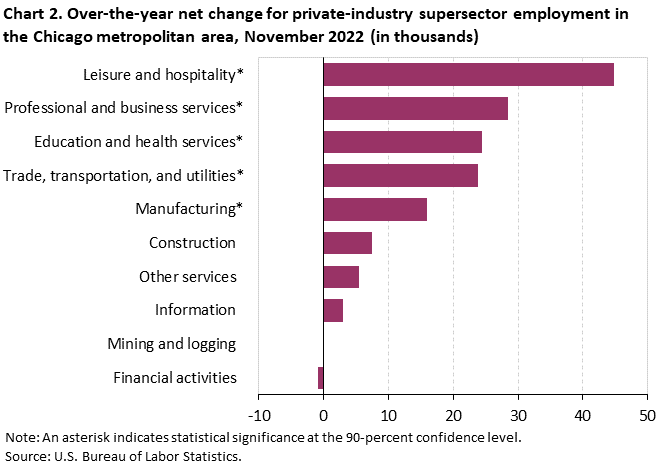
Industry employmentIn Chicago-Naperville-Elgin, IL-IN-WI, leisure and hospitality had the largest gain (+44,800) among the metropolitan area’s private-industry supersectors. (See chart 2.) Chicago-Naperville-Arlington Heights, IL, added 39,600 jobs in this supersector. The 10.5-percent increase in the metropolitan area’s leisure and hospitality supersector compared to the 7.2-percent increase on a national level.
Professional and business services gained 28,500 jobs over the year in the metropolitan area. The Chicago-Naperville-Arlington Heights, IL, division accounted for most of the gain with an addition of 28,100 jobs. Within this metropolitan division, the professional, scientific, and technical services sector added 17,400 jobs. The metropolitan area had a 3.4-percent gain in professional and business services employment compared to the 3.2-percent increase for the nation.
Education and health services employment rose by 24,400 over the year in the metropolitan area. The Chicago-Naperville-Arlington Heights, IL, division added 19,200 jobs. The metropolitan area had a 3.4-percent annual gain in employment compared to the 3.9-percent increase nationally.
Trade, transportation, and utilities gained 23,900 jobs over the year, an increase of 2.5 percent. Within this supersector, the wholesale trade sector accounted for 9,800 of the jobs added. Nationwide, trade, transportation, and utilities employment rose 1.9 percent.
Manufacturing (+15,900) was the only other supersector in the metropolitan area to report a significant over-the-year job gain in November.
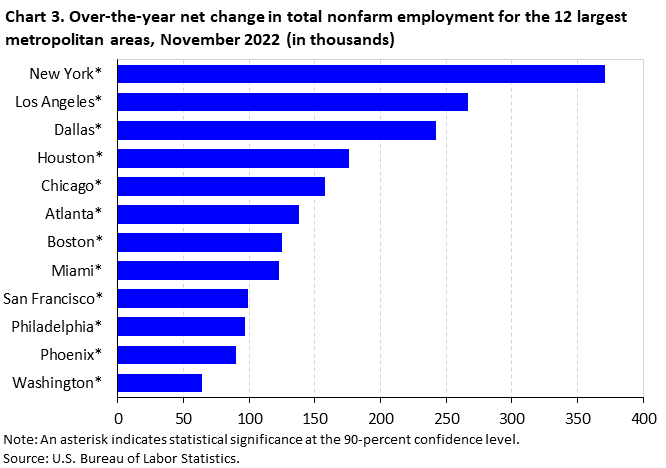
Twelve largest metropolitan areasChicago-Naperville-Elgin, IL-IN-WI, was 1 of the nation’s 12 largest metropolitan statistical areas in November 2022. All 12 areas gained jobs over the year. New York-Newark-Jersey City, NY-NJ-PA, had the largest increase (+371,100). Washington-Arlington-Alexandria, DC-VA-MD-WV, had the smallest increase (+63,900) among the largest areas. (See table 2 and chart 3.)
Dallas-Fort Worth-Arlington, TX, had a 6.1-percent rate of job gain, followed by Houston-The Woodlands-Sugar Land, TX (+5.6 percent). The rates of job gain in the remaining 10 areas ranged from 4.8 percent in Atlanta-Sandy Springs-Roswell, GA, to 1.9 percent in Washington-Arlington-Alexandria, DC-VA-MD-WV.
The Metropolitan Area Employment and Unemployment release for December 2022 is scheduled to be released on Wednesday, February 1, 2023, at 10:00 a.m. (ET).
With the release of January 2023 data on March 13, 2023, the Current Employment Statistics (CES) State and Area division will revise the basis for industry classification from the 2017 North American Industry Classification System (NAICS) to NAICS 2022. The conversion to NAICS 2022 will result in revisions reflecting content and coding changes within the mining and logging, manufacturing, wholesale trade, retail trade, information, financial activities, and other services sectors. The majority of the changes associated with the 2022 NAICS update impact levels of detail not published by CES State and Area. Details of updated titles and new, discontinued, and collapsed industries resulting from the NAICS 2022 update, as well as changes due to the annual benchmarking process, will be available on March 13, 2023. More information on NAICS 2022 is available from the Census Bureau’s North American Industry Classification System page.
This release presents nonfarm payroll employment estimates from the CES program. The CES survey is a Federal-State cooperative endeavor between State employment security agencies and the U.S. Bureau of Labor Statistics.
Definitions. Employment data refer to persons on establishment payrolls who receive pay for any part of the pay period which includes the 12th of the month. Persons are counted at their place of work rather than at their place of residence; those appearing on more than one payroll are counted on each payroll. Industries are classified on the basis of their principal activity in accordance with the 2017 version of the North American Industry Classification System.
Method of estimation. CES State and Area employment data are produced using several estimation procedures. Where possible these data are produced using a "weighted link relative" estimation technique in which a ratio of current-month weighted employment to that of the previous-month weighted employment is computed from a sample of establishments reporting for both months. The estimates of employment for the current month are then obtained by multiplying these ratios by the previous month's employment estimates. The weighted link relative technique is utilized for data series where the sample size meets certain statistical criteria. For some employment series, the estimates are produced with a model that uses direct sample estimates (described above) combined with other regressors to decrease volatility in estimation.
Annual revisions. Employment estimates are adjusted annually to a complete count of jobs, called benchmarks, derived principally from tax reports which are submitted by employers who are covered under state unemployment insurance (UI) laws. The benchmark information is used to adjust the monthly estimates between the new benchmark and the preceding one and also to establish the level of employment for the new benchmark month. Thus, the benchmarking process establishes the level of employment, and the sample is used to measure the month-to-month changes in the level for the subsequent months. Information on recent benchmark revisions is available online at www.bls.gov/web/laus/bmrk_article.htm.
Reliability of the estimates. The estimates presented in this release are based on sample surveys, administrative data, and modeling and, thus, are subject to sampling and other types of errors. Sampling error is a measure of sampling variability—that is, variation that occurs by chance because a sample rather than the entire population is surveyed. Survey data also are subject to nonsampling errors, such as those which can be introduced into the data collection and processing operations. Estimates not directly derived from sample surveys are subject to additional errors resulting from the specific estimation processes used. The sums of individual items may not always equal totals shown in the same tables due to rounding.
Employment estimates. Changes in metropolitan area nonfarm payroll employment are cited in the analysis of this release only if they have been determined to be statistically significant at the 90-percent confidence level. Measures of sampling error for the total nonfarm employment series are available for metropolitan areas and metropolitan divisions at www.bls.gov/web/laus/790stderr.htm.
Area definitions. The substate area data published in this news release reflect the delineations issued by the U.S. Office of Management and Budget on April 10, 2018. The 12 metropolitan areas discussed in this release are the metropolitan areas with the largest population according to the U.S. Census Bureau.
The Chicago-Naperville-Elgin, IL-IN-WI Metropolitan Statistical Area includes Cook, DeKalb, DuPage, Grundy, Kane, Kendall, Lake, McHenry, and Will Counties in Illinois; Jasper, Lake, Newton, and Porter Counties in Indiana; and Kenosha County in Wisconsin.
Additional information
Employment data from the CES program are available on the BLS website at www.bls.gov/sae/.
Information in this release will be made available to individuals with sensory impairments upon request. Voice phone: (202) 691-5200; Telecommunications Relay Service: 7-1-1.
| Area and Industry | Nov 2021 | Sep 2022 | Oct 2022 | Nov 2022(p) | Nov 2021 to Nov 2022(p) | |
|---|---|---|---|---|---|---|
| Net change | Percent change | |||||
Chicago-Naperville-Elgin, IL-IN-WI Metropolitan Statistical Area | ||||||
Total nonfarm | 4,645.7 | 4,758.6 | 4,794.7 | 4,803.7 | 158.0 | 3.4 |
Mining and logging | 1.9 | 1.9 | 1.9 | 1.9 | 0.0 | 0.0 |
Construction | 182.5 | 192.2 | 193.8 | 189.9 | 7.4 | 4.1 |
Manufacturing | 400.6 | 413.9 | 416.0 | 416.5 | 15.9 | 4.0 |
Trade, transportation, and utilities | 963.3 | 964.6 | 977.2 | 987.2 | 23.9 | 2.5 |
Information | 75.2 | 78.0 | 77.9 | 78.2 | 3.0 | 4.0 |
Financial activities | 318.8 | 318.3 | 318.0 | 317.9 | -0.9 | -0.3 |
Professional and business services | 837.3 | 859.4 | 869.1 | 865.8 | 28.5 | 3.4 |
Education and health services | 725.1 | 733.8 | 745.8 | 749.5 | 24.4 | 3.4 |
Leisure and hospitality | 425.0 | 469.3 | 468.5 | 469.8 | 44.8 | 10.5 |
Other services | 184.1 | 188.2 | 188.8 | 189.6 | 5.5 | 3.0 |
Government | 531.9 | 539.0 | 537.7 | 537.4 | 5.5 | 1.0 |
Chicago-Naperville-Arlington Heights, IL Metropolitan Division | ||||||
Total nonfarm | 3,707.8 | 3,805.1 | 3,835.7 | 3,842.0 | 134.2 | 3.6 |
Mining and logging | 1.4 | 1.4 | 1.4 | 1.4 | 0.0 | 0.0 |
Construction | 135.1 | 142.4 | 143.8 | 140.6 | 5.5 | 4.1 |
Manufacturing | 270.3 | 279.9 | 281.6 | 281.6 | 11.3 | 4.2 |
Trade, transportation, and utilities | 757.4 | 758.9 | 769.7 | 775.6 | 18.2 | 2.4 |
Information | 68.6 | 71.5 | 71.4 | 71.7 | 3.1 | 4.5 |
Financial activities | 276.0 | 276.7 | 276.2 | 275.9 | -0.1 | 0.0 |
Professional and business services | 704.1 | 724.4 | 734.0 | 732.2 | 28.1 | 4.0 |
Education and health services | 598.5 | 603.9 | 614.3 | 617.7 | 19.2 | 3.2 |
Leisure and hospitality | 333.9 | 372.7 | 371.8 | 373.5 | 39.6 | 11.9 |
Other services | 152.4 | 155.7 | 156.1 | 156.7 | 4.3 | 2.8 |
Government | 410.1 | 417.6 | 415.4 | 415.1 | 5.0 | 1.2 |
Elgin, IL Metropolitan Division | ||||||
Total nonfarm | 253.2 | 257.0 | 259.0 | 260.9 | 7.7 | 3.0 |
Mining and logging | 0.2 | 0.2 | 0.2 | 0.2 | 0.0 | 0.0 |
Construction | 14.2 | 15.1 | 15.1 | 14.9 | 0.7 | 4.9 |
Manufacturing | 34.3 | 37.0 | 37.2 | 37.5 | 3.2 | 9.3 |
Trade, transportation, and utilities | 50.1 | 50.2 | 50.5 | 50.8 | 0.7 | 1.4 |
Information | 2.0 | 2.0 | 2.0 | 2.0 | 0.0 | 0.0 |
Financial activities | 10.3 | 9.4 | 9.6 | 9.6 | -0.7 | -6.8 |
Professional and business services | 36.2 | 34.0 | 34.7 | 35.0 | -1.2 | -3.3 |
Education and health services | 31.9 | 31.9 | 32.1 | 32.2 | 0.3 | 0.9 |
Leisure and hospitality | 23.1 | 26.6 | 26.2 | 26.9 | 3.8 | 16.5 |
Other services | 9.4 | 9.7 | 9.8 | 9.9 | 0.5 | 5.3 |
Government | 41.5 | 40.9 | 41.6 | 41.9 | 0.4 | 1.0 |
Lake County-Kenosha County, IL-WI Metropolitan Division | ||||||
Total nonfarm | 415.2 | 425.1 | 427.2 | 426.7 | 11.5 | 2.8 |
Mining and logging | 0.1 | 0.1 | 0.1 | 0.1 | 0.0 | 0.0 |
Construction | 15.1 | 16.0 | 16.1 | 15.7 | 0.6 | 4.0 |
Manufacturing | 62.9 | 63.9 | 63.8 | 64.2 | 1.3 | 2.1 |
Trade, transportation, and utilities | 96.6 | 97.5 | 98.3 | 101.1 | 4.5 | 4.7 |
Information | 2.8 | 2.7 | 2.7 | 2.7 | -0.1 | -3.6 |
Financial activities | 23.6 | 23.2 | 23.2 | 23.3 | -0.3 | -1.3 |
Professional and business services | 70.8 | 73.9 | 73.6 | 71.5 | 0.7 | 1.0 |
Education and health services | 46.6 | 48.7 | 49.9 | 49.6 | 3.0 | 6.4 |
Leisure and hospitality | 36.0 | 38.4 | 38.3 | 37.5 | 1.5 | 4.2 |
Other services | 12.1 | 12.5 | 12.6 | 12.6 | 0.5 | 4.1 |
Government | 48.6 | 48.2 | 48.6 | 48.4 | -0.2 | -0.4 |
Gary, IN Metropolitan Division | ||||||
Total nonfarm | 269.5 | 271.4 | 272.8 | 274.1 | 4.6 | 1.7 |
Mining and logging | 0.2 | 0.2 | 0.2 | 0.2 | 0.0 | 0.0 |
Construction | 18.1 | 18.7 | 18.8 | 18.7 | 0.6 | 3.3 |
Manufacturing | 33.1 | 33.1 | 33.4 | 33.2 | 0.1 | 0.3 |
Trade, transportation, and utilities | 59.2 | 58.0 | 58.7 | 59.7 | 0.5 | 0.8 |
Information | 1.8 | 1.8 | 1.8 | 1.8 | 0.0 | 0.0 |
Financial activities | 8.9 | 9.0 | 9.0 | 9.1 | 0.2 | 2.2 |
Professional and business services | 26.2 | 27.1 | 26.8 | 27.1 | 0.9 | 3.4 |
Education and health services | 48.1 | 49.3 | 49.5 | 50.0 | 1.9 | 4.0 |
Leisure and hospitality | 32.0 | 31.6 | 32.2 | 31.9 | -0.1 | -0.3 |
Other services | 10.2 | 10.3 | 10.3 | 10.4 | 0.2 | 2.0 |
Government | 31.7 | 32.3 | 32.1 | 32.0 | 0.3 | 0.9 |
| Area | Nov 2021 | Sep 2022 | Oct 2022 | Nov 2022(p) | Nov 2021 to Nov 2022(p) | |
|---|---|---|---|---|---|---|
| Net change | Percent change | |||||
United States(1) | ||||||
Total nonfarm | 150,210 | 153,204 | 154,416 | 154,990 | 4,780 | 3.2 |
Mining and logging | 587 | 637 | 642 | 641 | 54 | 9.2 |
Construction | 7,582 | 7,877 | 7,896 | 7,827 | 245 | 3.2 |
Manufacturing | 12,530 | 12,890 | 12,925 | 12,941 | 411 | 3.3 |
Trade, transportation, and utilities | 28,705 | 28,589 | 28,834 | 29,249 | 544 | 1.9 |
Information | 2,914 | 3,041 | 3,052 | 3,077 | 163 | 5.6 |
Financial activities | 8,865 | 8,969 | 9,009 | 9,018 | 153 | 1.7 |
Professional and business services | 21,983 | 22,468 | 22,707 | 22,689 | 706 | 3.2 |
Education and health services | 24,155 | 24,618 | 24,953 | 25,088 | 933 | 3.9 |
Leisure and hospitality | 14,755 | 15,971 | 15,918 | 15,812 | 1,057 | 7.2 |
Other services | 5,583 | 5,721 | 5,752 | 5,771 | 188 | 3.4 |
Government | 22,551 | 22,423 | 22,728 | 22,877 | 326 | 1.4 |
Atlanta-Sandy Springs-Roswell, GA | ||||||
Total nonfarm | 2,899.4 | 2,997.6 | 3,019.4 | 3,037.6 | 138.2 | 4.8 |
Mining and logging | 1.9 | 2.0 | 2.0 | 2.0 | 0.1 | 5.3 |
Construction | 134.0 | 131.1 | 132.7 | 133.1 | -0.9 | -0.7 |
Manufacturing | 172.8 | 177.3 | 176.4 | 176.1 | 3.3 | 1.9 |
Trade, transportation, and utilities | 632.0 | 642.1 | 646.6 | 657.0 | 25.0 | 4.0 |
Information | 112.8 | 123.6 | 124.3 | 126.6 | 13.8 | 12.2 |
Financial activities | 188.8 | 196.8 | 199.1 | 198.3 | 9.5 | 5.0 |
Professional and business services | 569.0 | 598.5 | 599.5 | 598.5 | 29.5 | 5.2 |
Education and health services | 382.1 | 392.3 | 396.5 | 399.0 | 16.9 | 4.4 |
Leisure and hospitality | 273.7 | 293.1 | 297.3 | 301.1 | 27.4 | 10.0 |
Other services | 99.2 | 101.5 | 102.6 | 103.4 | 4.2 | 4.2 |
Government | 333.1 | 339.3 | 342.4 | 342.5 | 9.4 | 2.8 |
Boston-Cambridge-Nashua, MA-NH (NECTA) | ||||||
Total nonfarm | 2,734.9 | 2,819.5 | 2,846.0 | 2,859.8 | 124.9 | 4.6 |
Mining, logging, and construction | 128.5 | 135.7 | 135.3 | 135.1 | 6.6 | 5.1 |
Manufacturing | 181.1 | 185.9 | 185.8 | 185.3 | 4.2 | 2.3 |
Trade, transportation, and utilities | 406.2 | 412.1 | 415.5 | 421.7 | 15.5 | 3.8 |
Information | 82.3 | 87.7 | 89.1 | 89.6 | 7.3 | 8.9 |
Financial activities | 179.8 | 180.1 | 182.2 | 183.4 | 3.6 | 2.0 |
Professional and business services | 529.4 | 550.3 | 558.2 | 559.1 | 29.7 | 5.6 |
Education and health services | 595.9 | 609.8 | 616.7 | 623.7 | 27.8 | 4.7 |
Leisure and hospitality | 227.9 | 259.9 | 259.8 | 256.1 | 28.2 | 12.4 |
Other services | 94.3 | 94.5 | 94.4 | 94.9 | 0.6 | 0.6 |
Government | 309.5 | 303.5 | 309.0 | 310.9 | 1.4 | 0.5 |
Chicago-Naperville-Elgin, IL-IN-WI | ||||||
Total nonfarm | 4,645.7 | 4,758.6 | 4,794.7 | 4,803.7 | 158.0 | 3.4 |
Mining and logging | 1.9 | 1.9 | 1.9 | 1.9 | 0.0 | 0.0 |
Construction | 182.5 | 192.2 | 193.8 | 189.9 | 7.4 | 4.1 |
Manufacturing | 400.6 | 413.9 | 416.0 | 416.5 | 15.9 | 4.0 |
Trade, transportation, and utilities | 963.3 | 964.6 | 977.2 | 987.2 | 23.9 | 2.5 |
Information | 75.2 | 78.0 | 77.9 | 78.2 | 3.0 | 4.0 |
Financial activities | 318.8 | 318.3 | 318.0 | 317.9 | -0.9 | -0.3 |
Professional and business services | 837.3 | 859.4 | 869.1 | 865.8 | 28.5 | 3.4 |
Education and health services | 725.1 | 733.8 | 745.8 | 749.5 | 24.4 | 3.4 |
Leisure and hospitality | 425.0 | 469.3 | 468.5 | 469.8 | 44.8 | 10.5 |
Other services | 184.1 | 188.2 | 188.8 | 189.6 | 5.5 | 3.0 |
Government | 531.9 | 539.0 | 537.7 | 537.4 | 5.5 | 1.0 |
Dallas-Fort Worth-Arlington, TX | ||||||
Total nonfarm | 3,992.4 | 4,135.5 | 4,192.0 | 4,234.6 | 242.2 | 6.1 |
Mining, logging, and construction | 220.1 | 232.6 | 235.0 | 238.1 | 18.0 | 8.2 |
Manufacturing | 287.9 | 301.8 | 304.0 | 306.0 | 18.1 | 6.3 |
Trade, transportation, and utilities | 888.7 | 891.5 | 902.1 | 921.8 | 33.1 | 3.7 |
Information | 84.6 | 87.7 | 86.7 | 87.7 | 3.1 | 3.7 |
Financial activities | 350.5 | 367.8 | 370.6 | 372.3 | 21.8 | 6.2 |
Professional and business services | 725.3 | 758.9 | 774.2 | 777.0 | 51.7 | 7.1 |
Education and health services | 471.3 | 492.7 | 503.1 | 505.6 | 34.3 | 7.3 |
Leisure and hospitality | 383.7 | 421.8 | 425.3 | 431.6 | 47.9 | 12.5 |
Other services | 126.6 | 133.5 | 135.2 | 136.0 | 9.4 | 7.4 |
Government | 453.7 | 447.2 | 455.8 | 458.5 | 4.8 | 1.1 |
Houston-The Woodlands-Sugar Land, TX | ||||||
Total nonfarm | 3,160.7 | 3,289.1 | 3,322.5 | 3,337.0 | 176.3 | 5.6 |
Mining and logging | 62.1 | 68.6 | 69.1 | 69.8 | 7.7 | 12.4 |
Construction | 214.6 | 241.4 | 238.9 | 233.1 | 18.5 | 8.6 |
Manufacturing | 215.8 | 227.9 | 227.2 | 228.0 | 12.2 | 5.7 |
Trade, transportation, and utilities | 660.6 | 664.7 | 676.1 | 687.0 | 26.4 | 4.0 |
Information | 31.0 | 32.3 | 32.5 | 32.7 | 1.7 | 5.5 |
Financial activities | 169.0 | 175.8 | 177.7 | 176.0 | 7.0 | 4.1 |
Professional and business services | 515.1 | 539.8 | 546.5 | 546.9 | 31.8 | 6.2 |
Education and health services | 426.6 | 437.7 | 441.6 | 445.0 | 18.4 | 4.3 |
Leisure and hospitality | 315.1 | 359.7 | 361.2 | 364.9 | 49.8 | 15.8 |
Other services | 113.8 | 113.2 | 112.5 | 110.8 | -3.0 | -2.6 |
Government | 437.0 | 428.0 | 439.2 | 442.8 | 5.8 | 1.3 |
Los Angeles-Long Beach-Anaheim, CA | ||||||
Total nonfarm | 6,074.6 | 6,221.1 | 6,298.7 | 6,341.5 | 266.9 | 4.4 |
Mining and logging | 2.0 | 2.0 | 2.0 | 2.0 | 0.0 | 0.0 |
Construction | 251.3 | 265.9 | 268.9 | 266.5 | 15.2 | 6.0 |
Manufacturing | 461.7 | 475.8 | 477.5 | 478.9 | 17.2 | 3.7 |
Trade, transportation, and utilities | 1,103.0 | 1,101.2 | 1,109.9 | 1,125.8 | 22.8 | 2.1 |
Information | 252.4 | 256.5 | 257.5 | 265.0 | 12.6 | 5.0 |
Financial activities | 323.7 | 325.8 | 329.2 | 329.2 | 5.5 | 1.7 |
Professional and business services | 981.6 | 1,005.8 | 1,020.0 | 1,027.9 | 46.3 | 4.7 |
Education and health services | 1,101.3 | 1,136.7 | 1,158.0 | 1,161.9 | 60.6 | 5.5 |
Leisure and hospitality | 675.0 | 731.1 | 739.0 | 740.1 | 65.1 | 9.6 |
Other services | 191.7 | 206.4 | 207.4 | 206.5 | 14.8 | 7.7 |
Government | 730.9 | 713.9 | 729.3 | 737.7 | 6.8 | 0.9 |
Miami-Fort Lauderdale-West Palm Beach, FL | ||||||
Total nonfarm | 2,749.2 | 2,824.4 | 2,855.3 | 2,871.9 | 122.7 | 4.5 |
Mining and logging | 0.8 | 0.9 | 0.9 | 0.9 | 0.1 | 12.5 |
Construction | 141.5 | 145.4 | 145.7 | 145.0 | 3.5 | 2.5 |
Manufacturing | 91.5 | 96.1 | 96.7 | 98.0 | 6.5 | 7.1 |
Trade, transportation, and utilities | 631.6 | 643.1 | 650.5 | 662.1 | 30.5 | 4.8 |
Information | 52.9 | 53.1 | 53.0 | 53.2 | 0.3 | 0.6 |
Financial activities | 201.3 | 205.2 | 207.3 | 207.2 | 5.9 | 2.9 |
Professional and business services | 482.7 | 490.4 | 498.4 | 495.5 | 12.8 | 2.7 |
Education and health services | 417.0 | 433.8 | 437.4 | 439.4 | 22.4 | 5.4 |
Leisure and hospitality | 308.5 | 331.2 | 336.8 | 342.2 | 33.7 | 10.9 |
Other services | 113.5 | 121.3 | 121.7 | 121.7 | 8.2 | 7.2 |
Government | 307.9 | 303.9 | 306.9 | 306.7 | -1.2 | -0.4 |
New York-Newark-Jersey City, NY-NJ-PA | ||||||
Total nonfarm | 9,590.4 | 9,809.4 | 9,893.8 | 9,961.5 | 371.1 | 3.9 |
Mining, logging, and construction | 395.0 | 400.4 | 402.0 | 399.2 | 4.2 | 1.1 |
Manufacturing | 337.6 | 341.7 | 342.6 | 343.5 | 5.9 | 1.7 |
Trade, transportation, and utilities | 1,667.3 | 1,663.4 | 1,678.6 | 1,701.7 | 34.4 | 2.1 |
Information | 318.8 | 331.6 | 332.5 | 331.4 | 12.6 | 4.0 |
Financial activities | 771.6 | 783.5 | 782.8 | 785.1 | 13.5 | 1.7 |
Professional and business services | 1,589.1 | 1,635.4 | 1,642.5 | 1,659.6 | 70.5 | 4.4 |
Education and health services | 2,046.4 | 2,069.9 | 2,106.1 | 2,127.3 | 80.9 | 4.0 |
Leisure and hospitality | 781.1 | 886.8 | 881.8 | 872.1 | 91.0 | 11.7 |
Other services | 382.0 | 402.1 | 407.2 | 410.6 | 28.6 | 7.5 |
Government | 1,301.5 | 1,294.6 | 1,317.7 | 1,331.0 | 29.5 | 2.3 |
Philadelphia-Camden-Wilmington, PA-NJ-DE-MD | ||||||
Total nonfarm | 2,935.4 | 2,991.7 | 3,019.2 | 3,032.1 | 96.7 | 3.3 |
Mining, logging, and construction | 122.6 | 124.4 | 123.8 | 122.5 | -0.1 | -0.1 |
Manufacturing | 175.0 | 180.0 | 180.1 | 181.3 | 6.3 | 3.6 |
Trade, transportation, and utilities | 544.2 | 546.8 | 553.9 | 561.8 | 17.6 | 3.2 |
Information | 50.3 | 50.3 | 50.2 | 50.1 | -0.2 | -0.4 |
Financial activities | 217.9 | 220.2 | 221.3 | 221.4 | 3.5 | 1.6 |
Professional and business services | 481.2 | 496.7 | 502.0 | 504.7 | 23.5 | 4.9 |
Education and health services | 654.4 | 668.7 | 679.0 | 685.2 | 30.8 | 4.7 |
Leisure and hospitality | 240.7 | 259.3 | 258.1 | 250.7 | 10.0 | 4.2 |
Other services | 115.2 | 119.1 | 119.9 | 121.5 | 6.3 | 5.5 |
Government | 333.9 | 326.2 | 330.9 | 332.9 | -1.0 | -0.3 |
Phoenix-Mesa-Scottsdale, AZ | ||||||
Total nonfarm | 2,278.3 | 2,321.9 | 2,346.0 | 2,368.5 | 90.2 | 4.0 |
Mining and logging | 2.9 | 3.1 | 3.2 | 3.2 | 0.3 | 10.3 |
Construction | 139.4 | 147.4 | 148.0 | 148.8 | 9.4 | 6.7 |
Manufacturing | 139.8 | 149.9 | 150.4 | 151.1 | 11.3 | 8.1 |
Trade, transportation, and utilities | 463.3 | 457.1 | 462.8 | 472.2 | 8.9 | 1.9 |
Information | 41.7 | 42.8 | 42.8 | 42.6 | 0.9 | 2.2 |
Financial activities | 217.5 | 214.4 | 216.2 | 217.7 | 0.2 | 0.1 |
Professional and business services | 381.1 | 387.3 | 388.5 | 389.4 | 8.3 | 2.2 |
Education and health services | 351.0 | 369.1 | 372.9 | 377.4 | 26.4 | 7.5 |
Leisure and hospitality | 224.5 | 232.6 | 238.5 | 239.1 | 14.6 | 6.5 |
Other services | 70.4 | 70.6 | 73.6 | 74.5 | 4.1 | 5.8 |
Government | 246.7 | 247.6 | 249.1 | 252.5 | 5.8 | 2.4 |
San Francisco-Oakland-Hayward, CA | ||||||
Total nonfarm | 2,403.4 | 2,464.0 | 2,493.2 | 2,502.6 | 99.2 | 4.1 |
Mining and logging | 0.4 | 0.4 | 0.4 | 0.4 | 0.0 | 0.0 |
Construction | 120.6 | 128.8 | 128.9 | 127.7 | 7.1 | 5.9 |
Manufacturing | 148.4 | 157.1 | 157.4 | 157.9 | 9.5 | 6.4 |
Trade, transportation, and utilities | 359.5 | 359.4 | 364.2 | 371.0 | 11.5 | 3.2 |
Information | 144.0 | 148.2 | 149.0 | 149.5 | 5.5 | 3.8 |
Financial activities | 140.5 | 140.9 | 142.3 | 143.4 | 2.9 | 2.1 |
Professional and business services | 506.6 | 525.8 | 533.7 | 532.1 | 25.5 | 5.0 |
Education and health services | 371.8 | 371.4 | 378.7 | 381.3 | 9.5 | 2.6 |
Leisure and hospitality | 217.9 | 241.0 | 242.3 | 241.4 | 23.5 | 10.8 |
Other services | 78.6 | 84.4 | 85.7 | 85.8 | 7.2 | 9.2 |
Government | 315.1 | 306.6 | 310.6 | 312.1 | -3.0 | -1.0 |
Washington-Arlington-Alexandria, DC-VA-MD-WV | ||||||
Total nonfarm | 3,293.1 | 3,315.2 | 3,338.9 | 3,357.0 | 63.9 | 1.9 |
Mining, logging, and construction | 163.0 | 166.8 | 167.4 | 166.8 | 3.8 | 2.3 |
Manufacturing | 55.6 | 56.6 | 57.2 | 57.0 | 1.4 | 2.5 |
Trade, transportation, and utilities | 411.4 | 406.4 | 408.9 | 418.4 | 7.0 | 1.7 |
Information | 77.4 | 79.5 | 80.3 | 80.6 | 3.2 | 4.1 |
Financial activities | 154.2 | 147.8 | 147.5 | 148.0 | -6.2 | -4.0 |
Professional and business services | 795.7 | 802.1 | 805.7 | 806.1 | 10.4 | 1.3 |
Education and health services | 430.5 | 438.6 | 447.5 | 449.5 | 19.0 | 4.4 |
Leisure and hospitality | 286.8 | 307.5 | 308.3 | 309.6 | 22.8 | 7.9 |
Other services | 194.0 | 197.9 | 199.1 | 198.6 | 4.6 | 2.4 |
Government | 724.5 | 712.0 | 717.0 | 722.4 | -2.1 | -0.3 |
Footnotes | ||||||
Last Modified Date: Wednesday, January 04, 2023