An official website of the United States government
An official website of the United States government
The .gov means it's official.
Federal government websites often end in .gov or .mil. Before sharing sensitive information,
make sure you're on a federal government site.
The site is secure.
The
https:// ensures that you are connecting to the official website and that any
information you provide is encrypted and transmitted securely.
17-1604-CHI
Friday, February 23, 2018
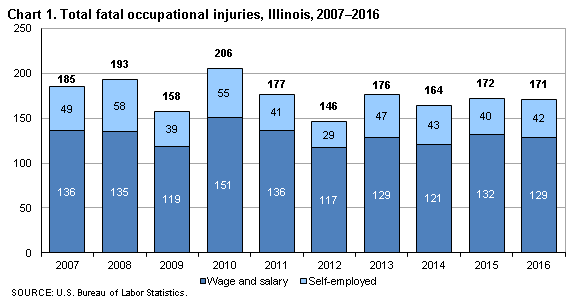
Fatal work injuries totaled 171 in 2016 for Illinois, the U.S. Bureau of Labor Statistics reported today. Assistant Commissioner for Regional Operations Charlene Peiffer noted that the number of work-related fatalities in Illinois was little changed from the previous year. Fatal occupational injuries in the state have ranged from a high of 262 in 1996 to a low of 146 in 2012. (See chart 1.)
Nationwide, a total of 5,190 fatal work injuries were recorded in 2016, a 7-percent increase from the 4,836 fatal injuries in 2015, according to the results from the Census of Fatal Occupational Injuries (CFOI) program. This was the third consecutive increase in annual workplace fatalities and the first time more than 5,000 fatalities have been recorded since 2008.
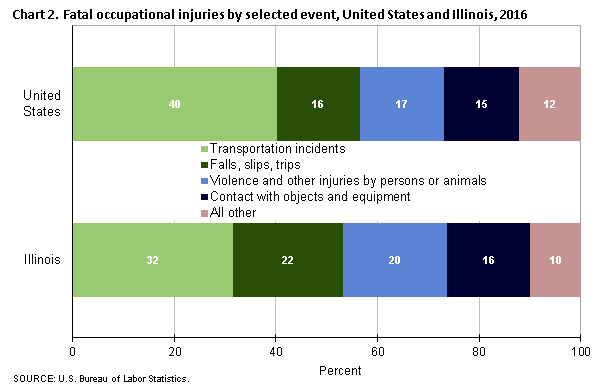
Type of incidentIn Illinois, transportation incidents resulted in 54 fatal work injuries and falls, trips, or slips accounted for 37 fatalities. These two major categories accounted for 53 percent of all workplace fatalities in the state. (See table 1.) Over the year, the number of worker deaths from transportation incidents decreased from 59, while worker fatalities due to falls, trips, or slips was up from 33.
Violence and other injuries by persons or animals was the third-most frequent fatal work event with 35 fatalities, up from 27 in the prior year. Contact with objects or equipment resulted in 28 work-related deaths compared to 29 in 2015.
Nationally, transportation incidents were the most frequent fatal workplace event in 2016, accounting for 40 percent of fatal work injuries. (See chart 2.) Violence and other injuries by persons or animals was the second-most common fatal event (17 percent), followed by falls, slips, or trips (16 percent).
IndustryThe private transportation and warehousing sector had the highest number of fatalities in Illinois with 35, up from 22 in the previous year. (See table 2.) Twenty of the 22 fatalities in the sector were the result of transportation incidents. Seventy-seven percent of those fatally injured in this sector worked in truck transportation.
The private construction sector had 29 workplace fatalities, down from 38 in the previous year. The specialty trade contractor industry accounted for 21, or 72 percent, of the fatal injuries in this sector.
OccupationThe transportation and material moving and construction and extraction occupational groups had the highest number of workplace fatalities with 51 and 31, respectively. (See table 3.) Heavy and tractor-trailer truck drivers suffered 36 of the work-related deaths within the transportation and material moving group. Construction trade workers accounted for 22 of the 31 fatalities among construction and extraction workers.
Additional highlightsBackground of the program. The Census of Fatal Occupational Injuries (CFOI), part of the BLS Occupational Safety and Health Statistics (OSHS) program, compiles a count of all fatal work injuries occurring in the U.S. during the calendar year. The CFOI program uses diverse state, federal, and independent data sources to identify, verify, and describe fatal work injuries. This ensures counts are as complete and accurate as possible. For the 2016 national data, over 23,300 unique source documents were reviewed as part of the data collection process. For technical information and definitions for CFOI, please go to the BLS Handbook of Methods on the BLS website at www.bls.gov/opub/hom/cfoi/home.htm.
Federal/State agency coverage. The CFOI includes data for all fatal work injuries, even those that may be outside the scope of other agencies or regulatory coverage. Thus, any comparison between the BLS fatality census counts and those released by other agencies should take into account the different coverage requirements and definitions being used by each agency. More on the scope of CFOI can be found at www.bls.gov/iif/cfoiscope.htm.
Acknowledgments. BLS thanks the Illinois Department of Public Health for their efforts in collecting accurate, comprehensive, and useful data on fatal work injuries. BLS also appreciates the efforts of all federal, state, local, and private sector entities that provided source documents used to identify fatal work injuries. Among these agencies are the Occupational Safety and Health Administration; the National Transportation Safety Board; the U.S. Coast Guard; the Mine Safety and Health Administration; the Office of Workers’ Compensation Programs (Federal Employees' Compensation and Longshore and Harbor Workers' Compensation divisions); the Federal Railroad Administration; the National Highway Traffic Safety Administration; state vital statistics registrars, coroners, and medical examiners; state departments of health, labor, and industrial relations and workers' compensation agencies; state and local police departments; and state farm bureaus.
Information in this release will be made available to sensory impaired individuals upon request. Voice phone: (202) 691-5200; Federal Relay Service: (800) 877-8339.
| Event or exposure (1) | 2015 | 2016 | |
|---|---|---|---|
| Number | Number | Percent | |
Total | 172 | 171 | 100 |
Violence and other injuries by persons or animals | 27 | 35 | 20 |
Intentional injury by person | 26 | 32 | 19 |
Homicides (Intentional injury by other person) | 18 | 22 | 13 |
Shooting by other person--intentional | 14 | 18 | 11 |
Suicides (Self-inflicted injury--intentional) | 8 | 10 | 6 |
Shooting--intentional self-harm | 3 | 5 | 3 |
Hanging, strangulation, asphyxiation--intentional self-harm | 3 | 4 | 2 |
Animal and insect related incidents | -- | 3 | 2 |
Bites and stings | -- | 3 | 2 |
Transportation incidents | 59 | 54 | 32 |
Pedestrian vehicular incident | 7 | 9 | 5 |
Pedestrian struck by vehicle in work zone | -- | 3 | 2 |
Pedestrian struck by vehicle in nonroadway area | 5 | 5 | 3 |
Roadway incidents involving motorized land vehicle | 29 | 37 | 22 |
Roadway collision with other vehicle | 20 | 21 | 12 |
Roadway collision--moving in same direction | 10 | 7 | 4 |
Roadway collision--moving in opposite directions, oncoming | 6 | 8 | 5 |
Roadway collision--moving perpendicularly | 3 | 5 | 3 |
Roadway collision with object other than vehicle | 5 | 10 | 6 |
Vehicle struck object or animal on side of roadway | 5 | 8 | 5 |
Roadway noncollision incident | 4 | 6 | 4 |
Jack-knifed or overturned, roadway | 3 | 6 | 4 |
Nonroadway incident involving motorized land vehicles | 16 | 6 | 4 |
Nonroadway noncollision incident | 12 | 3 | 2 |
Fires and explosions | 5 | 3 | 2 |
Falls, slips, trips | 33 | 37 | 22 |
Falls on same level | 7 | 11 | 6 |
Fall on same level due to tripping | -- | 4 | 2 |
Falls to lower level | 23 | 24 | 14 |
Fall through surface or existing opening | 2 | 3 | 2 |
Other fall to lower level | 20 | 19 | 11 |
Other fall to lower level less than 6 feet | -- | 4 | 2 |
Other fall to lower level 11 to 15 feet | -- | 4 | 2 |
Exposure to harmful substances or environments | 19 | 14 | 8 |
Exposure to electricity | 9 | 3 | 2 |
Exposure to other harmful substances | 7 | 10 | 6 |
Nonmedical use of drugs or alcohol--unintentional overdose | 7 | 8 | 5 |
Contact with objects and equipment | 29 | 28 | 16 |
Struck by object or equipment | 22 | 22 | 13 |
Struck by powered vehicle--nontransport | 13 | 10 | 6 |
Struck by powered vehicle tipping over--nontransport | 1 | 3 | 2 |
Struck by other falling powered vehicle | 4 | 3 | 2 |
Struck by falling object or equipment--other than powered vehicle | 9 | 9 | 5 |
Caught in or compressed by equipment or objects | 4 | 4 | 2 |
Caught in running equipment or machinery | 3 | 4 | 2 |
Footnotes: | |||
NOTE: Data for all years are final. Totals for major categories may include subcategories not shown separately. Percentages may not add to totals because of rounding. CFOI fatality counts exclude illness-related deaths unless precipitated by an injury event. Dashes indicate no data reported or data that do not meet publication criteria. | |||
| Industry (1) | 2015 | 2016 | |
|---|---|---|---|
| Number | Number | Percent | |
Total | 172 | 171 | 100 |
Private industry | 154 | 161 | 94 |
Natural resources and mining | 19 | 19 | 11 |
Agriculture, forestry, fishing and hunting | 16 | 17 | 10 |
Crop production | 11 | 14 | 8 |
Oilseed and grain farming | 2 | 3 | 2 |
Corn farming | 1 | 3 | 2 |
Construction | 38 | 29 | 17 |
Construction | 38 | 29 | 17 |
Construction of buildings | 6 | 3 | 2 |
Heavy and civil engineering construction | 4 | 5 | 3 |
Utility system construction | -- | 3 | 2 |
Specialty trade contractors | 27 | 21 | 12 |
Foundation, structure, and building exterior contractors | 11 | 10 | 6 |
Structural steel and precast concrete contractors | 3 | 4 | 2 |
Building equipment contractors | 10 | 4 | 2 |
Electrical contractors | 8 | 3 | 2 |
Building finishing contractors | 4 | 5 | 3 |
Manufacturing | 12 | 9 | 5 |
Manufacturing | 12 | 9 | 5 |
Trade, transportation, and utilities | 44 | 58 | 34 |
Wholesale trade | 10 | 11 | 6 |
Merchant wholesalers, durable goods | 5 | 5 | 3 |
Machinery, equipment, and supplies merchant wholesalers | -- | 3 | 2 |
Merchant wholesalers, nondurable goods | 5 | 6 | 4 |
Retail trade | 11 | 11 | 6 |
Transportation and warehousing | 22 | 35 | 20 |
Truck transportation | 12 | 27 | 16 |
General freight trucking | 8 | 15 | 9 |
General freight trucking, local | 3 | 7 | 4 |
General freight trucking, long-distance | 4 | 7 | 4 |
Specialized freight trucking | 3 | 11 | 6 |
Specialized freight (except used goods) trucking, local | -- | 3 | 2 |
Specialized freight (except used goods) trucking, long-distance | 3 | 8 | 5 |
Financial activities | 1 | 3 | 2 |
Real estate and rental and leasing | -- | 3 | 2 |
Professional and business services | 14 | 14 | 8 |
Professional and technical services | 3 | 4 | 2 |
Professional, scientific, and technical services | 3 | 4 | 2 |
Administrative and waste services | 11 | 10 | 6 |
Administrative and support services | 9 | 8 | 5 |
Services to buildings and dwellings | 6 | 4 | 2 |
Landscaping services | 4 | 3 | 2 |
Educational and health services | 2 | 5 | 3 |
Health care and social assistance | 2 | 4 | 2 |
Leisure and hospitality | 14 | 11 | 6 |
Arts, entertainment, and recreation | 4 | 4 | 2 |
Performing arts, spectator sports, and related industries | 1 | 4 | 2 |
Spectator sports | -- | 3 | 2 |
Spectator sports | -- | 3 | 2 |
Accommodation and food services | 10 | 7 | 4 |
Food services and drinking places | 9 | 6 | 4 |
Restaurants and other eating places | 7 | 4 | 2 |
Restaurants and other eating places | 7 | 4 | 2 |
Full-service restaurants | 5 | 3 | 2 |
Other services, except public administration | 9 | 11 | 6 |
Other services, except public administration | 9 | 11 | 6 |
Repair and maintenance | 6 | 6 | 4 |
Automotive repair and maintenance | 3 | 6 | 4 |
Automotive mechanical and electrical repair and maintenance | -- | 3 | 2 |
General automotive repair | -- | 3 | 2 |
Automotive body, paint, interior, and glass repair | -- | 3 | 2 |
Personal and laundry services | -- | 3 | 2 |
Government (2) | 18 | 10 | 6 |
Local government | 12 | 8 | 5 |
Footnotes: | |||
NOTE: Data for all years are final. Totals for major categories may include subcategories not shown separately. Percentages may not add to totals because of rounding. CFOI fatality counts exclude illness-related deaths unless precipitated by an injury event. Dashes indicate no data reported or data that do not meet publication criteria. | |||
| Occupation (1) | 2015 | 2016 | |
|---|---|---|---|
| Number | Number | Percent | |
Total | 172 | 171 | 100 |
Management occupations | 21 | 19 | 11 |
Other management occupations | 16 | 18 | 11 |
Farmers, ranchers, and other agricultural managers | 11 | 14 | 8 |
Farmers, ranchers, and other agricultural managers | 11 | 14 | 8 |
Arts, design, entertainment, sports, and media occupations | 4 | 3 | 2 |
Entertainers and performers, sports and related workers | -- | 3 | 2 |
Healthcare practitioners and technical occupations | 3 | 3 | 2 |
Protective service occupations | 10 | 8 | 5 |
Law enforcement workers | 3 | 3 | 2 |
Other protective service workers | 3 | 5 | 3 |
Security guards and gaming surveillance officers | -- | 4 | 2 |
Security guards | -- | 4 | 2 |
Building and grounds cleaning and maintenance occupations | 9 | 6 | 4 |
Grounds maintenance workers | 5 | 3 | 2 |
Grounds maintenance workers | 5 | 3 | 2 |
Personal care and service occupations | 2 | 5 | 3 |
Sales and related occupations | 9 | 12 | 7 |
Supervisors of sales workers | 5 | 7 | 4 |
First-line supervisors of sales workers | 5 | 7 | 4 |
First-line supervisors of retail sales workers | 3 | 5 | 3 |
Farming, fishing, and forestry occupations | 6 | 4 | 2 |
Agricultural workers | 4 | 3 | 2 |
Miscellaneous agricultural workers | 4 | 3 | 2 |
Construction and extraction occupations | 39 | 31 | 18 |
Supervisors of construction and extraction workers | -- | 4 | 2 |
First-line supervisors of construction trades and extraction workers | -- | 4 | 2 |
First-line supervisors of construction trades and extraction workers | -- | 4 | 2 |
Construction trades workers | 35 | 22 | 13 |
Carpenters | 3 | 6 | 4 |
Carpenters | 3 | 6 | 4 |
Construction laborers | 12 | 8 | 5 |
Construction laborers | 12 | 8 | 5 |
Electricians | 6 | 3 | 2 |
Electricians | 6 | 3 | 2 |
Extraction workers | 2 | 3 | 2 |
Installation, maintenance, and repair occupations | 10 | 14 | 8 |
Vehicle and mobile equipment mechanics, installers, and repairers | 4 | 8 | 5 |
Automotive technicians and repairers | -- | 5 | 3 |
Automotive service technicians and mechanics | -- | 4 | 2 |
Other installation, maintenance, and repair occupations | 5 | 6 | 4 |
Line installers and repairers | 1 | 3 | 2 |
Production occupations | 12 | 6 | 4 |
Metal workers and plastic workers | 3 | 3 | 2 |
Transportation and material moving occupations | 34 | 51 | 30 |
Motor vehicle operators | 24 | 43 | 25 |
Driver/sales workers and truck drivers | 20 | 41 | 24 |
Heavy and tractor-trailer truck drivers | 16 | 36 | 21 |
Light truck or delivery services drivers | -- | 4 | 2 |
Material moving workers | 8 | 8 | 5 |
Laborers and material movers, hand | 3 | 5 | 3 |
Laborers and freight, stock, and material movers, hand | -- | 5 | 3 |
Footnotes: | |||
NOTE: Totals for major categories may include subcategories not shown separately. Percentages may not add to totals because of rounding. CFOI fatality counts exclude illness-related deaths unless precipitated by an injury event. Dashes indicate no data reported or data that do not meet publication criteria. | |||
| Worker characteristics | 2015 | 2016 | |
|---|---|---|---|
| Number | Number | Percent | |
Total | 172 | 171 | 100 |
Employee status | |||
Wage and salary workers (1) | 132 | 129 | 75 |
Self-employed (2) | 40 | 42 | 25 |
Gender | |||
Men | 162 | 157 | 92 |
Women | 10 | 14 | 8 |
Age (3) | |||
20 to 24 years | 15 | 8 | 5 |
25 to 34 years | 19 | 25 | 15 |
35 to 44 years | 31 | 33 | 19 |
45 to 54 years | 44 | 35 | 20 |
55 to 64 years | 33 | 48 | 28 |
65 years and over | 27 | 21 | 12 |
Race or ethnic origin (4) | |||
White, non-Hispanic | 122 | 122 | 71 |
Black or African-American, non-Hispanic | 24 | 19 | 11 |
Hispanic or Latino | 19 | 27 | 16 |
Asian, non-Hispanic | 6 | 3 | 2 |
Footnotes: | |||
NOTE: Data for all years are final. Totals for major categories may include subcategories not shown separately. Percentages may not add to totals because of rounding. CFOI fatality counts exclude illness-related deaths unless precipitated by an injury event. Dashes indicate no data reported or data that do not meet publication criteria. | |||
Last Modified Date: Friday, February 23, 2018