An official website of the United States government
An official website of the United States government
The .gov means it's official.
Federal government websites often end in .gov or .mil. Before sharing sensitive information,
make sure you're on a federal government site.
The site is secure.
The
https:// ensures that you are connecting to the official website and that any
information you provide is encrypted and transmitted securely.
Businesses made many adjustments to their operations and policies during the coronavirus disease 2019 (COVID-19) pandemic. One key adjustment was shifting some employees from working in person at offices and stores to teleworking (also known as working from home or remote work). By limiting in-person contact among employees, telework allowed businesses to maintain operations and workers to remain employed.
Many researchers have demonstrated the importance of telework to the U.S. economy during the COVID-19 pandemic. Since early 2020, when the pandemic hit, telework has expanded sharply.1 Jose Maria Barrero, Nicholas Bloom, and Steven J. Davis estimate that telework accounted for about 50 percent of paid work hours between April and December 2020, compared with 5 percent before the pandemic.2 At the beginning of the pandemic, the extent of job loss was much lower for workers who were able to telework. Matthew Dey, Harley Frazis, Mark A. Loewenstein, and Hugette Sun found that, between February and April 2020, employment fell 8 percent among workers in occupations in which telework is feasible, compared with 21 percent among workers in occupations in which telework is not feasible.3
In this article, we examine telework during the pandemic by using data from the 2021 Business Response Survey to the Coronavirus Pandemic (BRS), which was collected between July and September 2021. The BRS is a special U.S. Bureau of Labor Statistics survey that describes how U.S. businesses have changed their operations and employment since the pandemic hit. We show how telework is related to other employer pandemic responses, including offering flexible work schedules, changing the physical size of workplaces, and relocating. We also show how telework varies by establishment characteristics, such as industry, average wages paid, and geography.
According to an earlier BRS survey conducted between July and September 2020, 31 percent of establishments increased telework offered to employees because of the pandemic.4 Notably, there was substantial variation by establishment size and industry. Large establishments (those with 500 or more employees) were more than twice as likely to have increased telework than were smaller establishments.5 In the sectors of educational services, finance and insurance, information, and management of companies, more than 50 percent of establishments increased telework.6 By contrast, in both agriculture and accommodation and food services, less than 10 percent of establishments did so.7 Many questions remained after the 2020 BRS: How many jobs involved telework? What portion of jobs involved teleworking full time? Did all jobs within an establishment involve teleworking similar amounts of time? One goal of the 2021 BRS was to provide answers to these questions.
Other researchers have estimated the extent of telework during the pandemic. Using data from the Current Population Survey, Matthew Dey, Harley Frazis, David S. Piccone Jr., and Mark A. Loewenstein found that, between October and December 2020, 22 percent of workers were teleworking because of the pandemic.8 The Federal Reserve Bank of Atlanta estimated that, as of January 2021, 15 percent of private sector jobs involved teleworking full time and 36 percent involved teleworking at least 1 day per week.9 Beyond giving estimates for the share of jobs that involve telework, we show how telework is associated with establishment characteristics and establishment responses to the pandemic.
There were 83,032 respondents to the 2021 BRS, which was conducted from July to September 2021 and collected information from a representative sample of private sector establishments in the United States.10 One part of the survey asked a sequence of three questions about the telework behavior of employees at each establishment.11 Specifically, it asked respondents to report the percentage of their employees currently teleworking all the time, some of the time (but not all), and rarely or never, allowing us to distinguish among three groups of workers. The survey instructions directed respondents to ensure that the three responses summed to approximately 100 percent, so that each employee would be counted in one of the three groups.
For each group, the survey instrument provided a drop-down menu of 13 potential responses (all percentages): 0, 5, 10, 20, 30, 40, 50, 60, 70, 80, 90, 95, and 100. Some collected data were edited to improve their accuracy. First, because some respondents appear to have misunderstood the sequence of questions, more than 20 percent of those who provided a response for all three groups reported 0 percent for each group. Upon further analysis and a brief followup survey (described in 2021 BRS technical notes), it was determined that a very large percentage of these respondents intended to report that 100 percent of their employees rarely or never teleworked.12 For the purposes of the present analysis, these respondents are treated as reporting that 100 percent of their employees rarely or never telework.
Another issue is that some respondents gave implausible responses for the three groups—responses totaling a number either too low or too high to be usable. We constructed an acceptable range for this total and dropped any respondents falling outside that range. Because the respondents had to use a drop-down menu with limited response options, some of them might have had a valid set of answers with a total as low as 80 (actual percentages: 29–29–42; rounding down would give a 20–20–40 response) or as high as 120 (actual percentages: 33–33–34; rounding up would give a 40–40–40 response). If a respondent provided a response for at least one but not all three groups, we imputed 0 for the missing responses.
Because the answers of some respondents did not sum to exactly 100, a final step in the data editing process involved normalizing all responses so that their total equals 100. For instance, a response of
The final sample of usable responses contains data for 72,324 establishments.
For each establishment, there are three responses to the telework questions:
Our estimates are weighted averages across all respondents with a valid response to the telework questions and a valid response to any additional question used in a tabulation. The weights used to calculate these averages are employment weights, constructed as described in the 2021 BRS technical notes.13 To estimate, for example, the percentage of jobs that involve teleworking full time, we use the formula

where  is the employment weight for establishment
  , which is based on the sector, state, and size class of establishment . In the calculation of , the employment for every combination of sector, state, and size class in the fourth quarter of 2020 in the Quarterly Census of Employment and Wages (the sample frame for the BRS) is divided evenly among all valid respondents in the same cell.
To estimate the percentage of jobs that involve teleworking at least some of the time, we combine the estimates of the percentage of jobs that involve teleworking full time and the percentage of jobs that involve teleworking some of the time:

Lastly, we provide estimates for a related question asking whether telework increased for some or all employees since the start of the pandemic. These estimates, which represent the percentage of establishments that responded “yes,” are weighted averages calculated with a formula similar to
Overall, 33 percent of establishments increased telework for some or all employees during the pandemic.14 (See table 1.) At the time of the 2021 BRS, 13 percent of jobs involved teleworking full time. More broadly, 22 percent of jobs involved teleworking at least some of the time (that is, some of the time or full time), with the remaining 78 percent involving teleworking rarely or never.
| Category | Percent of establishments | Percent of jobs that involve teleworking | Percent of establishments that increased telework | ||
|---|---|---|---|---|---|
| Full time | At least some | Rarely or never | |||
All | 100.0 | 12.6 | 21.8 | 78.1 | 32.7 |
Started employee flexibilities during pandemic | |||||
Flexible or staggered work hours | |||||
No | 75.4 | 10.2 | 16.8 | 83.1 | 25.4 |
Yes | 24.6 | 17.5 | 32.3 | 67.7 | 56.8 |
Compressed or alternative work schedules | |||||
No | 87.8 | 12.0 | 20.3 | 79.6 | 29.6 |
Yes | 12.2 | 15.0 | 28.8 | 71.2 | 53.4 |
Voluntary reduction in hours worked | |||||
No | 89.0 | 13.2 | 22.6 | 77.3 | 32.1 |
Yes | 11.0 | 8.6 | 16.8 | 83.2 | 37.3 |
Job sharing | |||||
No | 97.7 | 12.7 | 21.9 | 78.0 | 32.7 |
Yes | 2.3 | 8.0 | 16.4 | 83.6 | 29.6 |
Paid leave for dependent care | |||||
No | 93.5 | 12.6 | 21.8 | 78.1 | 31.9 |
Yes | 6.5 | 12.0 | 21.6 | 78.4 | 44.7 |
Changed pay because of pandemic | |||||
Increased base wages (straight-time wages or salary) | |||||
No | 85.5 | 14.2 | 24.2 | 75.8 | 33.2 |
Yes | 14.5 | 5.9 | 12.3 | 87.6 | 29.7 |
Temporarily paid a wage premium or extra hourly amount | |||||
No | 94.5 | 13.6 | 23.1 | 76.9 | 32.8 |
Yes | 5.5 | 6.0 | 13.7 | 86.2 | 30.1 |
Paid one-time special monetary awards or appreciation bonuses | |||||
No | 90.6 | 13.8 | 23.1 | 76.9 | 32.0 |
Yes | 9.4 | 8.1 | 16.8 | 83.1 | 39.0 |
Paid one-time bonuses to newly hired workers | |||||
No | 97.6 | 12.9 | 22.1 | 77.8 | 32.5 |
Yes | 2.4 | 7.8 | 17.0 | 83.0 | 41.5 |
Paid workers who referred others to apply for jobs at the business | |||||
No | 95.5 | 13.2 | 22.5 | 77.5 | 32.2 |
Yes | 4.5 | 8.7 | 17.4 | 82.6 | 45.5 |
At least one pay change | |||||
No | 75.8 | 15.9 | 26.1 | 73.9 | 32.3 |
Yes | 24.2 | 8.3 | 16.2 | 83.7 | 34.0 |
Source: U.S. Bureau of Labor Statistics, 2021 Business Response Survey to the Coronavirus Pandemic. | |||||
Telework is positively correlated with having flexible or staggered work schedules. Among establishments that started offering such schedules during the pandemic, 57 percent increased telework. By contrast, among establishments that did not start offering such schedules, only 25 percent increased telework. A similar pattern emerges for compressed or alternative work schedules, which suggests that the three employee flexibilities of telework, flexible work schedules, and compressed work schedules tend to be used together.
About one-fourth (24 percent) of establishments made at least one pay increase because of the pandemic. These pay changes include increasing base wages, temporarily paying a wage premium, paying a one-time special monetary award, paying a one-time bonus to newly hired workers, and paying workers who referred others to apply for jobs at an establishment. Establishments that increased pay had half as many jobs that involved teleworking full time (8 percent) as did establishments that did not change pay (16 percent). Focusing on establishments that increased base pay reveals a similar pattern; these establishments had roughly half as many jobs that involved teleworking full time (6 percent) as did establishments that did not change base pay (14 percent).
These findings suggest that establishments that are less generous with telework may compensate their employees with higher pay. However, given the many factors influencing wages, it might be difficult to identify a compensating differential in the data. In any case, the question of a compensating differential associated with telework is worth pursuing in future research. Using survey data, Barrero, Bloom, and Davis found that 63 percent of employees rated the value of 2 to 3 days working from home as being equivalent to a pay raise of some sort, suggesting the existence of a compensating differential associated with the nonpecuniary benefit of telework.15
Telework is also related to changes in the physical size of workplaces. Among the 6 percent of establishments that reduced the square footage of their workplaces since the start of the pandemic, 63 percent increased telework. (See table 2.) By contrast, among establishments that either kept their square footage the same or increased it, 31 percent increased telework. Relatedly, among the 4 percent of establishments planning to decrease their square footage in the next 12 months (as of the time of the survey), 52 percent increased telework since the start of the pandemic. Of the remaining establishments, 32 percent increased telework.
| Category | Percent of establishments | Percent of jobs that involve teleworking | Percent of establishments that increased telework | ||
|---|---|---|---|---|---|
| Full time | At least some | Rarely or never | |||
All | 100.0 | 12.6 | 21.8 | 78.1 | 32.7 |
Changed square footage of space since start of pandemic | |||||
Decreased | |||||
No | 94.5 | 11.4 | 20.6 | 79.4 | 31.2 |
Yes | 5.5 | 38.0 | 48.5 | 51.5 | 62.9 |
Increased | |||||
No | 96.4 | 12.7 | 21.9 | 78.1 | 32.6 |
Yes | 3.6 | 9.3 | 21.1 | 78.9 | 44.9 |
Stayed about the same | |||||
No | 9.0 | 22.7 | 33.8 | 66.2 | 56.3 |
Yes | 91.0 | 11.5 | 20.6 | 79.4 | 30.7 |
Expected to change square footage of space in next 12 months | |||||
Decreased | |||||
No | 96.0 | 11.4 | 20.5 | 79.4 | 32.3 |
Yes | 4.0 | 43.9 | 58.6 | 41.4 | 52.3 |
Increased | |||||
No | 96.4 | 12.5 | 21.6 | 78.4 | 32.4 |
Yes | 3.6 | 14.1 | 26.5 | 73.5 | 51.2 |
Stayed about the same | |||||
No | 7.6 | 25.7 | 39.1 | 60.9 | 51.8 |
Yes | 92.4 | 11.3 | 20.2 | 79.8 | 31.6 |
Relocation | |||||
Relocated since start of pandemic | |||||
No | 94.2 | 12.0 | 21.0 | 78.9 | 31.5 |
Yes | 5.8 | 27.9 | 43.2 | 56.8 | 58.1 |
Expected to relocate in next 12 months | |||||
No | 96.1 | 12.0 | 21.1 | 78.9 | 32.3 |
Yes | 3.9 | 29.2 | 44.5 | 55.5 | 50.2 |
Source: U.S. Bureau of Labor Statistics, 2021 Business Response Survey to the Coronavirus Pandemic. | |||||
Among the 6 percent of establishments that relocated since the start of the pandemic, 58 percent increased telework, compared with 32 percent among establishments that did not relocate.16 A similar pattern is observed in responses to the question about plans to relocate in the next 12 months (from the time of the survey). Among establishments that did plan to relocate, 50 percent increased telework, compared with 32 percent among establishments that did not plan to relocate.
The extent of telework at an establishment is related to the use of independent contractors. At the 11 percent of establishments that planned to use independent contractors, freelancers, or consultants after the pandemic, 24 percent of jobs involved teleworking full time and 39 percent involved teleworking at least some of the time. (See table 3.) By comparison, at the remaining establishments, only 11 percent of jobs involved teleworking full time and 20 percent involved teleworking at least some of the time. Furthermore, 59 percent of establishments that planned to use independent contractors, freelancers, or consultants increased telework since the start of the pandemic, compared with only 30 percent of establishments that did not plan to use these types of workers.
| Category | Percent of establishments | Percent of jobs that involve teleworking | Percent of establishments that increased telework | ||
|---|---|---|---|---|---|
| Full time | At least some | Rarely or never | |||
All | 100.0 | 12.6 | 21.8 | 78.1 | 32.7 |
Expected to use type of worker after pandemic is over | |||||
Independent contractors, freelancers, or consultants | |||||
No | 88.6 | 11.1 | 19.6 | 80.4 | 29.7 |
Yes | 11.4 | 23.7 | 39.3 | 60.7 | 58.7 |
Temporary help agency workers | |||||
No | 96.0 | 12.3 | 21.3 | 78.6 | 32.1 |
Yes | 4.0 | 13.4 | 24.6 | 75.4 | 59.7 |
Companies that provide contractors or subcontractors | |||||
No | 96.9 | 11.9 | 20.9 | 79.0 | 32.2 |
Yes | 3.1 | 20.5 | 32.9 | 67.1 | 61.2 |
Online platform companies using an app and commission | |||||
No | 98.8 | 12.4 | 21.6 | 78.4 | 32.8 |
Yes | 1.2 | 20.1 | 35.5 | 64.5 | 56.5 |
Expected to use at least one type of worker | |||||
No | 85.2 | 11.2 | 19.6 | 80.4 | 29.1 |
Yes | 14.8 | 17.3 | 29.8 | 70.2 | 55.9 |
Source: U.S. Bureau of Labor Statistics, 2021 Business Response Survey to the Coronavirus Pandemic. | |||||
Telework varies substantially by industry. In three sectors, more than 40 percent of jobs involved teleworking at least some of the time. These sectors are information (68 percent), financial activities (45 percent), and professional and business services (46 percent). (See chart 1 and table 4.) The information sector is the only sector in which more than half of jobs involved teleworking full time. In four sectors, less than 10 percent of jobs involved teleworking at least some of the time. These sectors are natural resources and mining (6 percent), construction (9 percent), retail trade (7 percent), and accommodation and food services (2 percent).
| Category | Percent of establishments | Percent of jobs that involve teleworking | Percent of establishments that increased telework | ||
|---|---|---|---|---|---|
| Full time | At least some | Rarely or never | |||
All | 100.0 | 12.6 | 21.8 | 78.1 | 32.7 |
Industry sector | |||||
Natural resources and mining | 1.4 | 2.1 | 5.6 | 94.3 | 10.5 |
Utilities | 0.2 | 11.4 | 19.7 | 80.3 | 32.7 |
Construction | 8.4 | 3.3 | 9.2 | 90.8 | 15.1 |
Manufacturing | 3.6 | 4.9 | 12.2 | 87.6 | 28.2 |
Wholesale trade | 6.1 | 14.6 | 26.4 | 73.5 | 41.9 |
Retail trade | 10.4 | 3.7 | 6.7 | 93.1 | 13.0 |
Transportation and warehousing | 2.6 | 6.0 | 10.8 | 89.1 | 21.1 |
Information | 2.0 | 52.2 | 68.0 | 32.0 | 58.9 |
Financial activities | 9.4 | 27.5 | 45.0 | 54.9 | 49.0 |
Professional and business services | 20.0 | 30.8 | 46.3 | 53.7 | 52.3 |
Educational services | 1.3 | 20.3 | 36.2 | 63.7 | 60.2 |
Health care and social assistance | 17.4 | 7.4 | 18.3 | 81.7 | 34.1 |
Arts, entertainment, and recreation | 1.6 | 6.6 | 14.1 | 85.9 | 33.0 |
Accommodation and food services | 7.4 | 0.7 | 1.8 | 98.2 | 3.1 |
Other services | 8.3 | 13.4 | 23.4 | 76.6 | 24.4 |
County population in 2020 | |||||
Less than 50,000 | 10.6 | 3.1 | 7.4 | 92.6 | 16.8 |
50,000 to 150,000 | 11.9 | 4.8 | 10.8 | 89.0 | 22.8 |
150,000 to 400,000 | 18.4 | 8.1 | 16.0 | 83.9 | 28.2 |
400,000 to 1 million | 25.9 | 14.0 | 24.4 | 75.5 | 35.4 |
1 million or more | 33.3 | 18.0 | 29.8 | 70.1 | 37.3 |
County urban–rural classification | |||||
Large central metropolitan | 34.9 | 18.6 | 30.9 | 69.0 | 39.3 |
Large fringe metropolitan | 24.1 | 12.2 | 22.0 | 78.0 | 31.2 |
Medium metropolitan | 19.3 | 8.6 | 15.9 | 84.1 | 29.1 |
Small metropolitan | 8.8 | 4.5 | 10.6 | 89.2 | 22.5 |
Micropolitan | 7.8 | 4.2 | 9.4 | 90.6 | 19.0 |
Noncore | 5.2 | 2.6 | 7.0 | 93.0 | 18.0 |
County poverty rate in 2019 | |||||
Less than 9 percent | 21.4 | 14.7 | 24.7 | 75.3 | 32.9 |
9 to 12 percent | 24.0 | 12.6 | 22.0 | 77.9 | 32.1 |
12 to 15 percent | 27.8 | 11.3 | 20.2 | 79.8 | 31.8 |
15 percent or more | 26.8 | 10.2 | 18.8 | 81.0 | 28.5 |
Note: Definitions of industry sectors correspond to codes from the 2017 North American Industry Classification System. County urban–rural classification is based on the 2013 National Center for Health Statistics Urban–Rural Classification Scheme for Counties (https://www.cdc.gov/nchs/data_access/urban_rural.htm). Source: U.S. Bureau of Labor Statistics, 2021 Business Response Survey to the Coronavirus Pandemic. | |||||
The three sectors with the highest percentage of establishments that increased telework during the pandemic are information (59 percent), professional and business services (52 percent), and educational services (60 percent). These sectors also are among the four sectors with the highest percentage of jobs that involved teleworking at least some of the time. In addition, published BRS estimates show that these sectors are the three sectors with the highest percentage of establishments that relocated, and they are among the four sectors with the highest percentage of establishments that reduced their workplace square footage.17 These findings are further evidence of the connection between telework and establishment decisions about physical location.
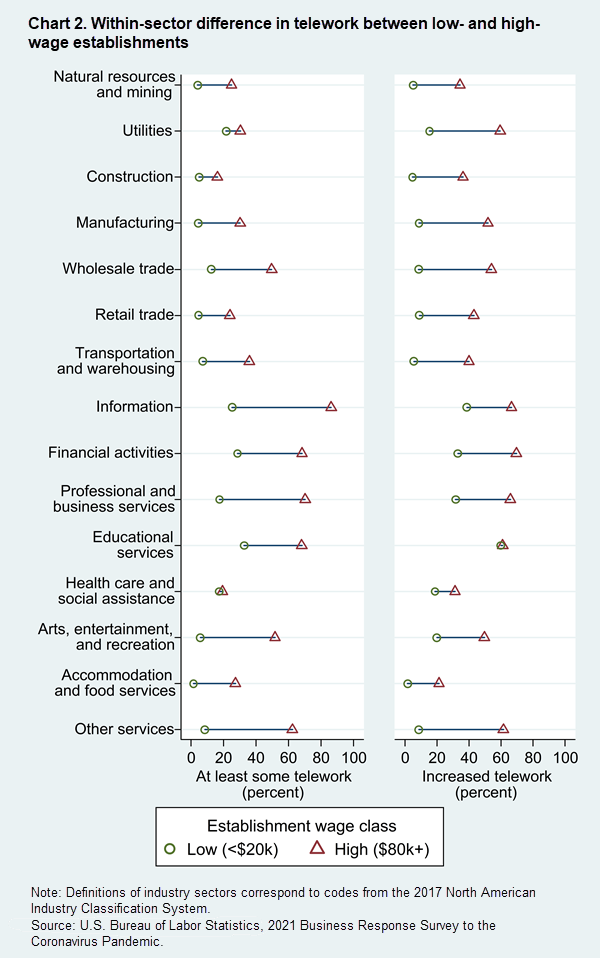
Another useful comparison involves examining differences in telework by the average wages paid by establishments. In previous work with Mark A. Loewenstein, David S. Piccone Jr., and Anne Polivka, we found that, compared with low-wage establishments, high-wage establishments within the same sector were more likely to have telework (before or during the pandemic) and more likely to increase telework during the pandemic.18 This finding demonstrates that variation across sectors explains only some of the telework patterns developing during the pandemic. Variation within sectors also played a role.
Following the approach adopted by Michael Dalton et al., the present analysis compares establishments paying an average wage (per job, per year) above $80,000 in 2020 (“high wage”) with establishments paying less than $20,000 (“low wage”).19 We find that, within sectors, high-wage establishments consistently used more telework and were more likely to increase telework during the pandemic. In every sector, high-wage establishments had a larger share of jobs that involved at least some telework. Furthermore, high-wage establishments were more likely to have increased telework since the start of the pandemic. (See chart 2.)
The extent of telework also varies considerably by geography. At establishments in counties with a population greater than 1 million in 2020, 30 percent of jobs involved teleworking at least some of the time.20 (See table 4.) By contrast, at establishments in small counties (those with a population of less than 50,000), only 7 percent of jobs involved teleworking at least some of the time. At establishments in large central metropolitan counties, 31 percent of jobs involved teleworking at least some of the time, compared with only 7 to 9 percent at establishments in nonmetropolitan counties.
Another interesting way to analyze the data geographically is by considering local poverty rates. The official poverty rate for the nation was 10.5 percent in 2019.21 At establishments in counties with poverty rates greater than 15 percent in 2019, 10 percent of jobs involved teleworking full time, compared with 15 percent at establishments in counties with poverty rates of less than 9 percent.
Using data from the 2021 Business Response Survey, we find that, between July and September 2021, 13 percent of jobs in U.S. private sector businesses involved teleworking full time and 22 percent involved teleworking at least some of the time. One-third (33 percent) of establishments increased telework for some or all employees during the COVID-19 pandemic. Telework was less common in establishments that increased base wages during the pandemic. The share of establishments that increased telework was larger among establishments that started offering flexible work hours or compressed work schedules after the pandemic hit. Telework was also associated with reductions in workplace square footage and relocation: the share of establishments that increased telework was larger among establishments that reduced square footage or relocated during the pandemic. We find that, compared with high-paying establishments within the same industry, low-paying establishments had a smaller share of jobs that involved telework. This shows that, besides paying less, jobs in low-paying establishments provided less opportunity for remote work during the pandemic.
Michael Dalton and Jeffrey A. Groen, "Telework during the COVID-19 pandemic: estimates using the 2021 Business Response Survey," Monthly Labor Review, U.S. Bureau of Labor Statistics, March 2022, https://doi.org/10.21916/mlr.2022.8
1 Matthew Dey, Harley Frazis, David S. Piccone Jr., and Mark A. Loewenstein, “Teleworking and lost work during the pandemic: new evidence from the CPS,” Monthly Labor Review, July 2021, https://doi.org/10.21916/mlr.2021.15; and Alexander Bick, Adam Blandin, and Karel Mertens, “Work from home before and after the COVID-19 outbreak,” Working Paper 2017 (Federal Reserve Bank of Dallas, June 2020, revised February 2021), https://doi.org/10.24149/wp2017r2.
2 Jose Maria Barrero, Nicholas Bloom, and Steven J. Davis, “Why working from home will stick,” Working Paper 28731 (Cambridge, MA: National Bureau of Economic Research, April 2021), http://www.nber.org/papers/w28731.
3 Matthew Dey, Harley Frazis, Mark A. Loewenstein, and Hugette Sun, “Ability to work from home: evidence from two surveys and implications for the labor market in the COVID-19 pandemic,” Monthly Labor Review, June 2020, https://doi.org/10.21916/mlr.2020.14.
4 “2020 results of the Business Response Survey” (U.S. Bureau of Labor Statistics), https://www.bls.gov/brs/2020-results.htm.
5 See “Table 15a: Establishments that increased telework, by size class” (U.S. Bureau of Labor Statistics), https://www.bls.gov/brs/data/tables/2020/spreadsheets/covid-table15-q5-size-class.xlsx.
6 See “Table 13a: Establishments that increased telework, by industry” (U.S. Bureau of Labor Statistics), https://www.bls.gov/brs/data/tables/2020/spreadsheets/covid-table13-q5-naics.xlsx.
7 Ibid.
8 Dey et al., “Teleworking and lost work during the pandemic.”
9 “WFH is onstage and here to stay,” Policy Hub: Macroblog (Federal Reserve Bank of Atlanta, February 24, 2021), https://www.atlantafed.org/blogs/macroblog/2021/02/24/wfh-onstage-and-here-to-stay.
10 For general information on the 2021 Business Response Survey (BRS), including news releases, data tables, and technical notes, see www.bls.gov/brs.
11 See “U.S. Business Response Survey to the Coronavirus Pandemic questionnaire” (U.S. Bureau of Labor Statistics), https://www.bls.gov/brs/about/survey/brs-questionnaire-2021.pdf.
12 The 2021 BRS technical notes are available at https://www.bls.gov/brs/methods/2021-technical-notes.htm. In the followup survey, 92 percent of establishments that had indicated 0 percent for all three groups reported having no employees that telework.
13 Ibid.
14 The overall and sector-specific estimates of the percentage of establishments that increased telework differ from published BRS estimates primarily because of a difference in the sample used. In this article, the sample is restricted to respondents with a valid response to the sequence of three telework questions. In addition, the estimates may be affected by slight differences in methodology. The relevant published estimates can be found in “Table 1: Establishments that increased telework for some or all employees, by industry” (U.S. Bureau of Labor Statistics), https://www.bls.gov/brs/data/tables/2021/spreadsheets/covid2-table1-q1-naics.xlsx. The overall estimate from the published table is 34.5 percent, compared with 32.7 percent for this article. The sector-specific estimates differ by an average of 2.2 percentage points, with a minimum of 0.4 percentage point and a maximum of 6.0 percentage points.
15 Barrero, Bloom, and Davis, “Why working from home will stick.”
16 Because of the nature of the BRS sample frame, cross-state relocations occurring after December 2020 were not captured, which makes our estimated relocation rate of 5.8 percent a slight underestimate. All other relocations were captured through the time of the survey. Nationwide, 0.6 percent of establishments reported moving across state lines since the start of the pandemic. If an establishment was just as likely to move outside of a state during the 8 months from April 2020 through December 2020 as it was during the 8 months from January 2021 through September 2021, we may expect the relocation rate to be 6.4 percent instead of 5.8 percent.
17 The sector-specific estimates for the percentage of establishments that relocated can be obtained from “Table 103: Establishments that did not relocate since the start of the pandemic, by industry” (U.S. Bureau of Labor Statistics), https://www.bls.gov/brs/data/tables/2021/spreadsheets/covid2-table103-q12-4-naics.xlsx. (The percentage of establishments that relocated can be computed as 100 minus the percentage of establishments that did not relocate.) The published sector-specific estimates for the percentage of establishments that reduced the square footage of their workplaces can be found in “Table 76: Establishments that decreased their square footage of space, by industry” (U.S. Bureau of Labor Statistics), https://www.bls.gov/brs/data/tables/2021/spreadsheets/covid2-table76-q10-1-naics.xlsx.
18 Michael Dalton, Jeffrey A. Groen, Mark A. Loewenstein, David S. Piccone Jr., and Anne E. Polivka, “The K-shaped recovery: examining the diverging fortunes of workers in the recovery from the COVID-19 pandemic using business and household survey microdata,” The Journal of Economic Inequality, vol. 19, no. 3, August 2021, pp. 527–550, https://doi.org/10.1007/s10888-021-09506-6.
19 To calculate an average wage for an establishment, we use data for 2020 from the Quarterly Census of Employment and Wages. In the calculation, an establishment’s total wages across all four quarters are summed and divided by the average monthly employment for that establishment.
20 In these data, county designations are based on establishment location. The county of the establishment is not necessarily the same as the county of residence of the establishment’s workers.
21 Emily A. Shrider, Melissa Kollar, Frances Chen, and Jessica Semega, Income and poverty in the United States: 2020, Report P60-273 (U.S. Census Bureau, September 2021), https://www.census.gov/library/publications/2021/demo/p60-273.html.