An official website of the United States government
An official website of the United States government
The .gov means it's official.
Federal government websites often end in .gov or .mil. Before sharing sensitive information,
make sure you're on a federal government site.
The site is secure.
The
https:// ensures that you are connecting to the official website and that any
information you provide is encrypted and transmitted securely.
The Producer Price Index (PPI) is our nation’s primary measure of price changes in the domestic supply chain, allowing us to monitor how price increases or decreases are passed through from producers to consumers. This Principal Federal Economic Indicator marked its 125th anniversary in March 2016. Over its history, the PPI has set precedents for timely and accurate price index data. Its methodology and content evolved early on, as our economy was changing from one based on agriculture to one based on manufacturing. Today, the PPI continues to evolve as the service-providing sectors now contribute more to gross domestic product than the goods-producing sectors.
The PPI has also set precedents for helping inform the inflation expectations of economists and government leaders. It was the first economic indicator to show the macroeconomic effects of trade and war. It was the first measure to reveal the negative consequences that can arise from deflation and the impacts of fiscal and monetary policy on prices. Capturing a long history of price changes, the PPI continues to provide insights into bellwethers of economic turmoil and growth.
The PPI has been well documented since World War II, but its early history is less well known.1 This article tells the story of the first 50 years of the PPI and how it established its reputation as a key economic indicator.

March 3, 2016, marked the 125th anniversary of the PPI—one of the oldest economic time series compiled by the federal government. The index, known as the Wholesale Price Index (WPI) until 1978, was established as part of a U.S. Senate resolution on March 3, 1891, the last day of the last session of the 51st U.S. Congress.2 This Congress was famously known as the “Billion-Dollar Congress,” because of its expensive initiatives, such as expanding the Navy and creating pensions for families of military members who served in the Civil War. It operated in an era of industrialization, immigration, and economic growth.3 Two of its most well-known bills were the Sherman Antitrust Act, which sought to protect consumers from certain anticompetitive business practices that tended to raise prices (e.g., monopolies and cartels),4 and the McKinley Tariff Act of 1890, which raised duties on imports with the goal of protecting domestic industries from foreign competition.5 Born out of the necessity to measure the impact of such economic policies, the resolution marking the origin of the PPI read thus:
Resolved, The Committee on Finance be, and they are hereby, authorized and directed, by subcommittee or otherwise, to ascertain in every practicable way, and to report from time to time to the Senate, the effect of the tariff laws upon the imports and exports, the growth, development, production, and prices of agricultural and manufactured articles, at home and abroad….6
In response to this resolution, Senator Nelson W. Aldrich, who later played a role in the establishment of the Federal Reserve System, authored a report on Retail Prices and Wages in July 1892.7 According to this report, the demand for price and wage data arose because the lack of reliable data had caused persistent disputes over economic facts. In addition, legislators realized it would be impossible to judge the relative economic progress of the United States and its people without measures of prices and wages. For these reasons, the Senate Committee on Finance made sure to establish a legacy of objective and accurate data:
There was no expectation that the members of the committee would agree about the political or even the economic bearings of the facts ascertained; but all were desirous that hereafter there should be no reason to question the integrity of the facts.8
A Bureau of Labor Statistics (BLS) committee headed by Dr. Roland Falkner, a statistics professor from the University of Pennsylvania, was tasked with collecting prices and producing the original index data.9 At the Senate committee’s request, prices were collected from seven main distribution centers across the country:
Over a 28-month period beginning in mid-1889, BLS obtained 52,393 price quotations for 218 items purchased by wholesalers (commonly referred to as “jobbers” at the time).10 In a rather informal collection process, experts in the field (today known as field economists) received the following instructions:
As soon as you have completed the collection of wages and prices in [your city], please collect the quotations for wholesale prices….You can change the word “retail” to “wholesale” and make the blank conform. By “wholesale prices” I mean…the prices to jobbers.11
Once collected, these data were compiled by BLS into the first WPI, which was made up of eight equally weighted groupings of products:
The data produced by the BLS committee were published in Senator Aldrich’s 1892 report, which showed that prices fell 0.3 percent from June 1889 to September 1891.12 After this first publication, in 1893, the Senate committee and BLS completed their initial mission by publishing a report on historical prices for the years 1840–90.13 This massive compilation was the first of its kind in U.S. history and was made possible only by the dedicated efforts of field economists and with cooperation from the business community.
After several years of planning, in 1900, BLS published Wholesale Prices, 1890 to 1899, the first publication produced without congressional oversight.14 But it wasn’t until March 1902 that the regular annual publication of Course of Wholesale Prices (hereafter referred to as Wholesale Prices) began.15 Each annual publication contained monthly data for the previous calendar year and analysis of the data both for that year and from the base period, 1890.
Since the initial annual publication of Wholesale Prices, which contained data for 1890–1901, BLS made routine methodological improvements. For example, in that publication, items were sorted into groupings based on origin, rather than end use, which was how they were organized in the original reports prepared in coordination with Congress. In addition, farm products were separated from the category of food, forming a ninth major grouping.16
Each annual WPI publication—typically published in March—included a comprehensive analysis of price movements in the U.S. economy from the base period of 1890 through the most recently completed calendar year.17 Monthly prices were usually from the first day of each month, and data sources included trade journals, manufacturers, and, to a lesser extent, boards of trade and other government bureaus. Average nominal prices for all items were published alongside the index data. Later, the publication also featured price data for up to 26 foreign countries.
The first principal indicator of wholesale price changes, or headline index, was the WPI for All Commodities, which combined indexes for about 250 select items from all nine major groupings. Although weighting was not yet used to combine indexes, the choice of index for inclusion in the aggregate WPI was based on the “relative importance” of that index’s product in the U.S. economy. The term “relative importance” was carried over to describe weights once they were implemented in 1914. To this day, PPI tables of weights continue to be referred to as relative importance tables.
Most of the original products remain in the current survey in some variant, although a few, such as wool broadcloth, granite plates and teacups, and wooden pails and tubs, have become obsolete.18 In contrast, a number of manufactured products covered in the PPI today—products such as processed foods, consumer goods, plastic products, most chemicals, and machinery—are noticeably absent from the original index.
BLS also published composite indexes, to compare changes in prices for raw materials in the WPI with those for manufactured goods. Such indexes, which grouped goods by level of processing, would later become the focus of PPI reports. Since the initial publication of Wholesale Prices, the history of the PPI—just like that of the U.S. economy—has been one of constant improvement and growth.
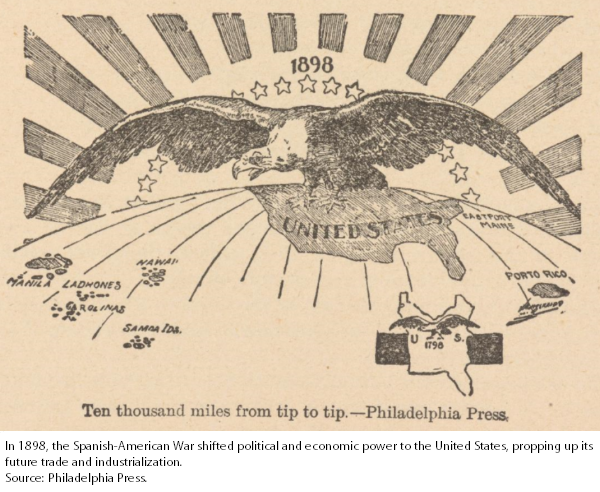
The stock market crash and the bank failures that set off an economic downturn in 189319 were reflected in WPI declines in the first 7 years for which data exist. In 1898, the Spanish–American War shifted political and economic power to the United States, propping up its future trade and industrialization.20 The WPI reflected this upturn in 1898 and increased by more than 8.0 percent in 1899 and 1900. This was the first recorded pickup in inflation during wartime, an occurrence that would become a trend. From 1901 to 1913, the index rose moderately, at an annual average rate of 1.6 percent.21 (See figure 1.)
At a time marked by advances in assembly line manufacturing and the U.S. acquisition of the Panama Canal, which further opened the nation’s economy to trade, BLS in 1908 added new products to the WPI.22 Among the 1908 additions were horses, dressed poultry, and canned food. Concerns about accurate techniques for substituting old with new products into aggregate WPIs led to the introduction of two indexes: one with the list of products included before additions or substitutions were made and one with the new list of goods.23 This labor-intensive practice continued as new products were added again in 1914, 1915, and 1921, so customers could compare price changes between any two years with WPIs made of identical goods.
In 1914, war was declared in Europe, the U.S. Federal Reserve banks opened for business, and the WPI underwent its first major revision. Most significantly, weights were applied to WPIs for the first time on the basis of 1909 U.S. Census of Manufacturers value-of-shipments data. To conform to the new weighting system, all indexes were retroactively calculated back to 1890. The base dates for all WPIs were also updated to 1914, to use the latest and most trustworthy data as a base and to accommodate the addition of new goods. The number of series published increased to 340, and BLS began publishing WPI data for all commodities and major commodity groupings in the Monthly Labor Review in 1915. WPI data were included in the first issue of the Review alongside data for the Consumer Price Index, which had just appeared in 1914.24
The annual publication of Wholesale Prices was suspended in 1918 because of the U.S. entry into World War I. Resuming publication in 1921, BLS issued a report with WPI data for 1917–19, to highlight price changes during the war.25 Although a major revision had taken place as recently as 1914, the data were revised once again, this time with a prewar base year of 1913. As in the previous rebasing, index numbers were revised all the way back to 1890. This recalculation accommodated the addition of indexes for goods introduced in the 1919 data and the revision of previous data with more pricing information. Further, weights for several home furnishings were obtained for the first time, and a new aggregate index for furniture was added. The number of series published now totaled 371. A useful highlight of this bulletin were charts printed on perforated translucent paper, which allowed data users to tear out and overlay charted data for easy comparison.
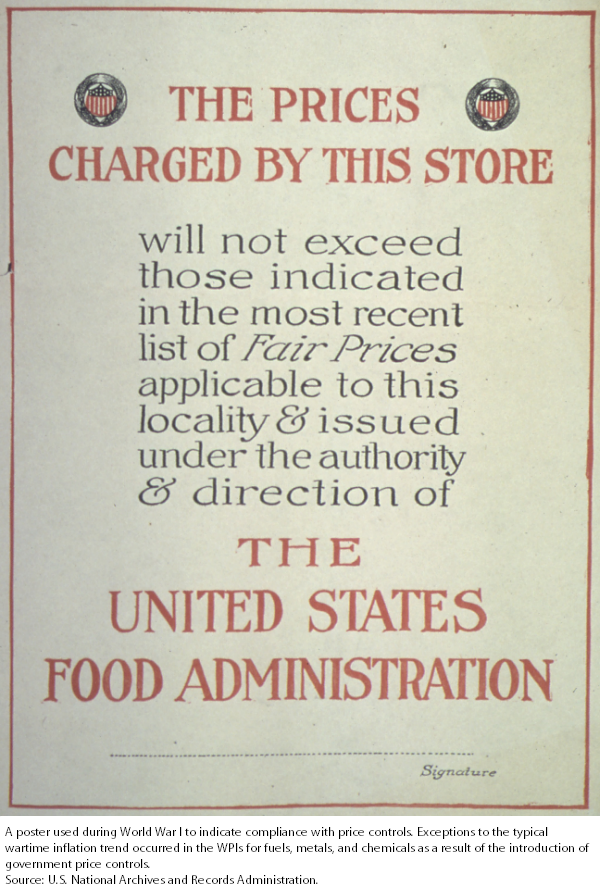
Data during World War I revealed unprecedented price increases between 1917 and 1919, with the all-commodities index rising 56 percent. Historically, to that point, the headline index had moved most closely with the WPI for farm products, which rose 65 percent during the 1917–19 period. Other notable increases were seen in the indexes for cloth and clothing, house furnishings, and building materials, which more than doubled during the war. Exceptions to the typical wartime inflation trend occurred in the indexes for fuels, metals, and chemicals, because of the introduction of government price controls. In addition to the usual analysis, data for 1919 were supplemented with extensive commentary on how the war affected price changes for certain important food commodities.26 Before resuming publication of Wholesale Prices, BLS also assisted with a special report, History of Prices During the War, published by the U.S. War Industries Board in 1919.27
In 1922, BLS published a number of bulletins to bring WPI data completely up to date. Beer, whiskey, and liquors were dropped from the index because of the 18th amendment prohibition on the sale of alcoholic beverages. Overall, the total number of WPI series grew to 450.28 For the first time, BLS had enough data to create new subgroupings under the existing nine major groupings. For example, under the farm products grouping, subgroupings were created for grains and for livestock and poultry. Subgroupings for drugs and pharmaceuticals, paper and pulp, and iron and steel were also among the more notable additions.
Along with the addition of new subgroupings, significant changes in methodology were implemented. BLS returned to grouping products by end use (as in the original indexes produced in coordination with Congress), as opposed to by origin. This resulted in some products falling into multiple categories; for example, steel and nails fell under both building materials and metal products, and potatoes fell under both food and farm products. However, each product was still weighted only once in the WPI for All Commodities.29 The relative-importance weights were also updated with data from the 1919 Census of Manufacturers.30
The last WPI revision before the Great Depression occurred with the release of 1927 data. Data were rebased from 1913 to 1926 and revised with weights updated from the 1923 and 1925 biennial censuses.31 With more than 100 newly introduced indexes, the total number of series went up to 550. Notable additions to the WPI survey were automobiles, tires, and sewing machines. New aggregate WPIs were also introduced for nonagricultural goods, raw materials, semi-manufactured articles, and finished products.
Because of the high volume of indexes added by 1927, the revision was completed in stages, and the final report with revised data back to 1890 was published in January 1929.32 Table 1 presents a list of the major product groupings and subgroupings in this report.
| Major grouping | Subgroupings |
|---|---|
Farm products | Grains, livestock and poultry, other farm products |
Foods | Meats; butter, cheese, and milk; other foods |
Hides and leather products(1) | Hides and skins(1), leather, boots and shoes, other leather products(1) |
Textile products(1) | Cotton goods, silk and rayon(1), woolen and worsted goods(1), other textile products(1) |
Fuel and lighting | Anthracite coal, bituminous coal, coke(1), manufactured gas(1), petroleum products(1) |
Metals and metal products | Iron and steel, nonferrous metals, agricultural implements(1), automobiles(1), other metal products(1) |
Building materials | Lumber, brick, Portland cement(1), structural steel, paint materials(1), other building materials |
Chemicals and drugs | Chemicals, drugs and pharmaceuticals, fertilizer materials, mixed fertilizers(1) |
House-furnishing goods | Furniture, furnishings |
Miscellaneous | Cattle feed, paper and pulp, rubber(1), automobile tires(1), other miscellaneous |
| Notes: (1) New category introduced in 1927. Source: U.S. Bureau of Labor Statistics. | |
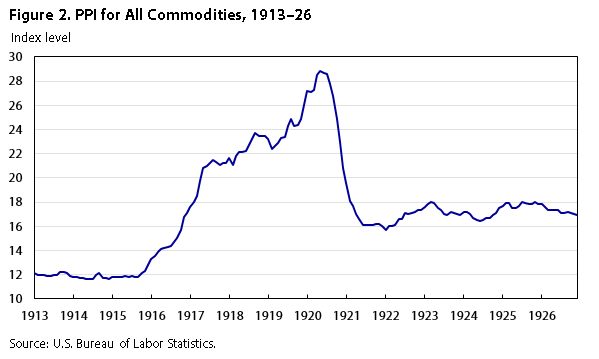
After the end of World War I in 1918, the WPI continued its upward trend through mid-1920, but, in early 1921, it abruptly returned to its pre-1918 level. From 1922 to 1925, the index displayed volatility, although in a tight range. (See figure 2.)
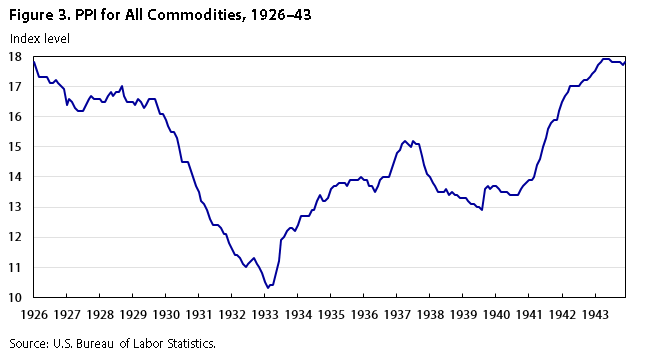
The WPI demonstrated its potential as a leading economic indicator with broad-based declines beginning in 1926. On October 24, 1929, a day known as “Black Thursday,” the stock market crashed, precipitating the Great Depression.33 By October 1930, the WPIs for all major commodity groupings had dropped below their 1926 base, and declines continued through 1932. According to WPI data, it took until 1943 for prices to recover to their predepression levels, partly because of a midrecovery recession in 1937. In comparison, during the 2007–09 Great Recession, the PPI for All Commodities turned down in July 2008 but recovered within 6 years.
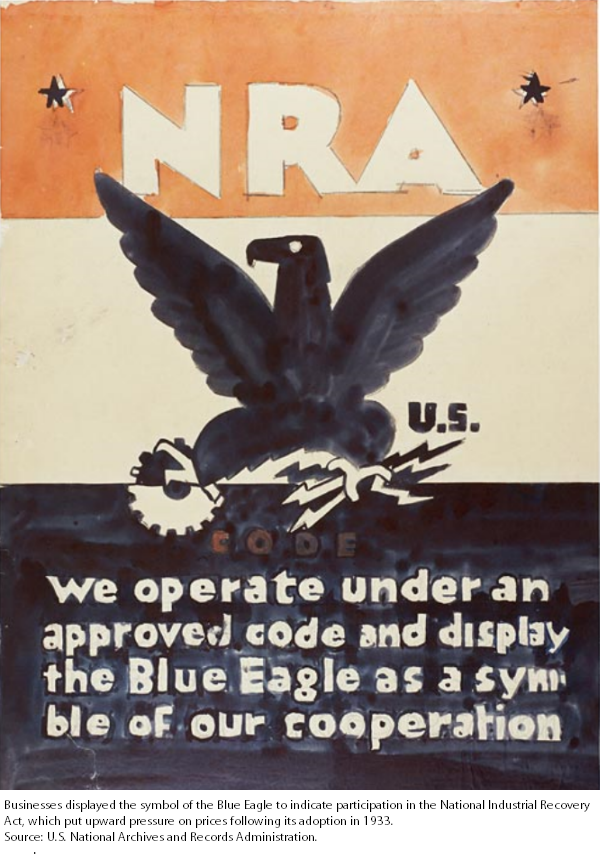
Before 1925, shorter periods of deflation had occurred periodically, but the 1925–33 deflationary period was, and remains, the longest streak of year-over-year declines reflected in the all-commodities index. In the 1930s, it became widely accepted that long-run price declines had intensified the Great Depression,34 and deflation attained its unsavory status. Seeking to get deflation under control, the federal government passed two new pieces of legislation in 1933, both of which contributed to an upturn in the WPI. The first, the Agricultural Adjustment Act, levied new taxes on certain farm products. This measure, combined with a major drought that led to the 1934 “Dust Bowl,” put upward pressure on farm and food prices.35 The second legislation, the National Industrial Recovery Act, created inflation pressure in nonfood prices by deregulating industries, allowing them to fix prices and create production quotas.36
With the beginning of the Great Depression, the need for economic data became more urgent than ever. BLS responded to this need in 1930, when it began publishing monthly bulletins with WPI data to supplement the comprehensive annual issue of Wholesale Prices. The new bulletins presented analyses on price movements for the most recent year, for the most recent month, and for selected weeks. These short-term analyses contrasted with those included in the annual publication, which emphasized historical price movements in the WPI from the base date.
The economic volatility of the 1930s also encouraged experimentation with the content of the WPI publication. In 1932, the number of WPI price series expanded from 550 to 784. The new series were almost entirely for fully manufactured goods. Some commodities were rearranged, and new subgroupings were added. Weights were updated in 1932 with the most recent Census of Manufacturers data, but revised figures were only calculated back to 1926, rather than 1890, as had been done in past revisions. Notices touting improvements in sample coverage, transaction descriptions, and weights for specific WPI groupings (such as farm machinery and cement) began appearing in the reports as well.37 These notices resemble today’s PPI notices of resampling of industries. The focus of the written analysis in the monthly WPI reports also began to shift, from the all-commodities index to both the aggregates excluding food and the indexes for goods by level of processing. In addition, the emphasis frequently shifted between short- and long-term price changes. For a time in 1935 and 1936, weekly analysis led the headline paragraph. During the same period, the WPI program switched from publishing international prices and average nominal prices on a monthly basis to publishing them only a few times a year.
In mid-1936, the monthly WPI report announced methodological improvements that would ensure increased WPI coverage, more detailed descriptions for sampled transactions, and better accuracy of prices and item classifications.38 In January 1937, the program moved from calculating WPIs as chain-type indexes to calculating them with a fixed-base formula. No immediate difference between the two types of indexes was noticeable for overlapping data in 1936; however, in the long run, it was expected that the new methodology would be crucial to maintaining accurate inflation data as product substitutions were made. With nearly 800 series being published in 1937, products were constantly growing obsolete or being replaced by newer alternatives.39
The WPI for All Commodities finally broke its depression slump in mid-1933, finishing the year with a double-digit advance. Bolstered by the impacts of the Agricultural Adjustment Act and the Dust Bowl, farm and food price increases led the broad-based rise in WPIs through 1936. In the midst of economic recovery, however, came the recession of 1937–38. This downturn has recently gained the attention of researchers, because of its parallels with the slow recovery from the 2007–09 Great Recession. Several factors have been cited as causes for the 1930s “recession within depression,” including higher taxes, rollbacks in government stimulus spending, and an increase in reserve requirements for banks by the Federal Reserve. These policies were implemented when the economy was not quite ready to absorb them.40 Since this time, measures of inflation, such as the PPI, have gained recognition as crucial indicators for policymakers.
After falling to a 5-year low in mid-1939, the WPI turned upward again, mainly because of the outbreak of World War II. The subsequent production increases to support the war effort boosted the economy through the duration of the war. (See figure 3.)
Since World War II, the PPI has grown to cover nearly all output in the goods-producing sectors and much of the output in the construction, utilities, and service sectors. In total, the PPI now tracks prices for over three-quarters of private domestic production, from raw materials to final-demand goods and services. In addition, indexes measuring price changes are available by industry, end use, and stage of production. Each month, the PPI program publishes nearly 10,000 individual indexes, which are used commonly by private businesses and the government as indicators of inflation. As evidence of its ongoing leadership in price-index development, the program has issued more than a dozen notices of expansion or methodology improvement in the last 5 years alone. The most prominent of these notices has been on the shift in focus of the PPI news release—a shift from the index for finished goods to the index for final demand.41
Lana Conforti, "The first 50 years of the Producer Price Index: setting inflation expectations for today," Monthly Labor Review, U.S. Bureau of Labor Statistics, June 2016, https://doi.org/10.21916/mlr.2016.25
1 See various articles on PPI methodology, https://www.bls.gov/ppi/methodology.htm; Edgar I. Eaton, “A description of the revised Wholesale Price Index,” Monthly Labor Review, vol. 74, no. 2, February 1952, pp.
2 “50th to 59th Congresses (1887–1907),” History, Art & Archives (U.S. House of Representatives), http://history.house.gov/Institution/Session-Dates/50-59/.
3 Cynthia C. Northrup, The American economy: a historical encyclopedia, volume 1 (Santa Barbara, CA: ABC-CLIO, 2011), p. 1257; and Sean D. Cashman, America in the Gilded Age: from the death of Lincoln to the rise of Theodore Roosevelt (New York, NY: New York University Press, 1993).
4 “The antitrust laws,” Guide to Antitrust Laws (Federal Trade Commission), https://www.ftc.gov/tips-advice/competition-guidance/guide-antitrust-laws/antitrust-laws.
5 “The McKinley Tariff of 1890,” History, Art & Archives (U.S. House of Representatives), http://history.house.gov/HistoricalHighlight/Detail.
6 Journal of the Senate, 51st Congress, 2d session (1891), p. 218.
7 Nelson W. Aldrich, Retail prices and wages, Report 986, Committee on Finance (Government Printing Office, 1892), https://books.google.com/books?id=d5g0AQAAMAAJ. See also “Jekyll Island and the creation of the Fed,” Classroom Economist (Federal Reserve Bank of Atlanta), https://www.frbatlanta.org/education/classroom-economist/jekyll-island.aspx.
8 Aldrich, Retail prices and wages, p. II.
9 Publications on wholesale prices from 1900 to 1913 are labeled as reports of the Department of Labor (DOL), which actually referred to the Bureau of Labor, which was established in 1884. DOL, in its current form, was established in 1913. Also in 1913, the word “statistics” was added to the name Bureau of Labor, and BLS was made a branch under DOL. Going forward, this article will refer to BLS inclusive of the Bureau of Labor, as it was called before 1913. See “The Organic Act of the Department of Labor” (U.S. Department of Labor), https://www.dol.gov/general/aboutdol/history/dolhistoxford.
10 Aldrich, Retail prices and wages, p. CV.
11 Ibid., p. CXXIII.
12 Ibid., p. VI.
13 Aldrich, Retail prices, wages, and transportation, Report 1394, Committee on Finance (Government Printing Office, 1893), https://books.google.com/books?id=cziCjgEACAAJ.
14 Wholesale prices, 1890 to 1899, Bulletin 27 (U.S. Bureau of Labor Statistics, 1900) https://books.google.com/books?id=qF7GAAAAMAAJ.
15 Course of wholesale prices, 1890 to 1901 (U.S. Bureau of Labor Statistics, 1902), https://books.google.com/books?id=nokuAAAAYAAJ.
16 Ibid.
17 Unless otherwise specified, references to years of WPI publications will refer to the time period for which data are measuring prices, rather than the year the publication was released.
18 Course of wholesale prices, 1890–1902, Bulletin 45 (U.S. Bureau of Labor Statistics, March 1903), https://fraser.stlouisfed.org/docs/publications/bls/bls_v08_0045_1903.pdf.
19 Mark Carlson, “Causes of bank suspensions in the Panic of 1893” (Federal Reserve Board, 2002), http://www.federalreserve.gov/pubs/feds/2002/200211/200211pap.pdf.
20 “The Spanish–American War, 1898,” Milestones, 1866–1898 (U.S. Department of State, Office of the Historian), https://history.state.gov/milestones/1866-1898/spanish-american-war.
21 Wholesale prices, 1890 to 1913, Bulletin 149 (U.S. Bureau of Labor Statistics, May 1914), https://fraser.stlouisfed.org/scribd/?item_id=497569&filepath=/docs/publications/bls/bls_0149_1914.pdf.
22 Wholesale prices, 1890 to 1908, Bulletin 81 (U.S. Bureau of Labor Statistics, March 1909), p. 219.
23 Wholesale prices, 1890 to 1914, Bulletin 181 (U.S. Bureau of Labor Statistics, October 1915), p. 255, https://fraser.stlouisfed.org/scribd/?item_id=476826&filepath=/docs/publications/bls/bls_0181_1915.pdf.
24 William J. Wiatrowski, “Reimagining the Monthly Review, July 1915,” Monthly Labor Review, February 2016, https://www.bls.gov/opub/mlr/2016/article/reimagining-the-monthly-review-july-1915.htm; and Stephen B. Reed, “One hundred years of price change: the Consumer Price Index and the American inflation experience,” Monthly Labor Review, April 2014, https://www.bls.gov/opub/mlr/2014/article/one-hundred-years-of-price-change-the-consumer-price-index-and-the-american-inflation-experience.htm.
25 Wholesale prices, 1890 to 1921, Bulletin 320 (U.S. Bureau of Labor Statistics, December 1922), p. 8, https://fraser.stlouisfed.org/scribd/?item_id=492994&filepath=/docs/publications/bls/bls_0320_1922.pdf.
26 Wholesale prices, 1890 to 1919, Bulletin 269 (U.S. Bureau of Labor Statistics, July 1920), https://fraser.stlouisfed.org/scribd/?item_id=476829&filepath=/docs/publications/bls/bls_0269_1920.pdf.
27 Wesley C. Mitchell, History of prices during the war (U.S. War Industries Board, 1919), https://books.google.com/books?id=lOEZAAAAYAAJ.
28 Wholesale prices, 1890 to 1921.
29 Although the use of weights in aggregate WPIs was a major improvement, by the 1960s the distortion in aggregate WPIs caused by multiple counting of price changes had become noticeable, leading BLS in 1978 to change focus from all-commodities WPIs to stage-of-processing PPIs. Multiple counting is present in all-commodities indexes because they include every given product at all levels of processing through the supply chain. For example, to the extent a price change is passed on from suppliers, a change in the price of raw cotton—which is converted to yarn, then to fabric, and finally to apparel—would be included five times in the all-commodities index. See John Early, “Improving the measurement of producer price change,” Monthly Labor Review, vol. 101, no. 4, April 1978, pp. 7–15.
30 Wholesale prices, 1890 to 1921.
31 Wholesale prices, 1913 to 1927, Bulletin 473 (U.S. Bureau of Labor Statistics, January 1929), https://fraser.stlouisfed.org/docs/publications/bls/bls_0473_1929.pdf.
32 Revised index numbers of wholesale prices, 1923 to July 1927, Bulletin 453 (U.S. Bureau of Labor Statistics, September 1927), https://fraser.stlouisfed.org/scribd/?title_id=4046&filepath=/docs/publications/bls/bls_0453_1927.pdf.
33 For historical recession dates, see “U.S. business cycle contractions and expansions” (Cambridge, MA: National Bureau of Economic Research), http://www.nber.org/cycles.html.
34 W. L. Crum, “The course of commodity prices,” The Review of Economics and Statistics, vol. 16, no. 10, October 1934, pp. 207–212, especially p. 207.
35 “Wholesale prices,” Monthly Labor Review, vol. 38, no. 2, February 1934, pp. 464–475; and Crum, “The course of commodity prices.”
36 The act’s purpose was “to encourage national industrial recovery, to foster fair competition, and to provide for the construction of certain useful public works, and for other purposes.” See “Transcript of National Industrial Recovery Act (1933),” https://www.ourdocuments.gov/doc.php?doc=66&page=transcript.
37 Wholesale prices, June 1936, Serial No. R. 419 (U.S. Bureau of Labor Statistics, 1936); and Wholesale Prices, March 1939, Serial No. R. 929 (U.S. Bureau of Labor Statistics, 1939).
38 “Wholesale prices,” Monthly Labor Review, vol. 43, no. 3, September 1936, pp. 772–782.
39 Jesse M. Cutts and Samuel J. Dennis, “Revised method of calculation of the Wholesale Price Index of the United States Bureau of Labor Statistics,” Journal of the American Statistical Association, vol. 32, no. 200, 1937, pp.
40 Patricia Waiwood, “Recession of 1937–38,” Federal Reserve History (Federal Reserve Bank of Richmond, November 2013), https://www.federalreservehistory.org/essays/recession-of-1937-38.
41 For special notices and more information on the PPI, visit https://www.bls.gov/ppi/. To subscribe for program updates, visit https://www.bls.gov/ppi/update.htm.