An official website of the United States government
An official website of the United States government
The .gov means it's official.
Federal government websites often end in .gov or .mil. Before sharing sensitive information,
make sure you're on a federal government site.
The site is secure.
The
https:// ensures that you are connecting to the official website and that any
information you provide is encrypted and transmitted securely.
Timely statistics on output, employment, and productivity are essential to understanding the performance of the U.S. economy. Labor productivity indicates how effectively labor inputs are converted into output and provides information needed to assess changes in technology, labor share, living standards, and competitiveness. The U.S. Bureau of Labor Statistics (BLS) produces both quarterly labor productivity measures for broad sectors of the U.S. economy and annual labor productivity measures for industries.1 Quarterly labor productivity data are analyzed as indicators of cyclical changes in the economy and are closely watched by the financial community, nonfinancial businesses, government policymakers, and researchers. Industry-level productivity statistics provide a means for comparing trends in efficiency and in technological improvements across industries, and indicate which industries are contributing to growth in the overall economy. Although annual industry productivity data can be used to analyze past industry performance and long-term trends, they are not frequent enough to provide indicators of current industry performance or identify which industries are driving current aggregate economic performance. Industry-level labor input data are available on a quarterly basis, but corresponding quarterly industry-level output data for nonmanufacturing industries—data that are necessary for constructing labor productivity measures—have not been available until recently.
In April 2014, the U.S. Bureau of Economic Analysis (BEA) began releasing quarterly gross domestic product (GDP)-by-industry measures.2 These new output measures were developed to be consistent with the annual industry accounts, and they appear to provide the data needed to construct more timely labor productivity measures. However, because complete output data are not yet available for all industries on a quarterly basis, these higher frequency data rely on assumptions about the relationships among industry inputs, outputs, and value added from the annual and benchmark statistics. This study examines the new quarterly GDP-by-industry statistics to determine whether they can be used to produce reasonable quarterly labor productivity measures at the industry level. This study develops quarterly labor hours and labor productivity measures for the 20 private industry groups for which BEA is releasing GDP-by-industry data.3 In addition, the study evaluates the volatility in the quarterly productivity measures to determine the value of these industry data for better understanding the sources of economic growth—in order to provide recommendations.
The preliminary and revised quarterly press release—“Productivity and Costs”—includes measures of labor productivity for six major U.S. sectors: business, nonfarm business, manufacturing, durable and nondurable goods manufacturing, and nonfinancial corporations.4 Labor productivity measures are calculated as growth in real output relative to growth in hours worked. BLS calculates quarterly labor productivity for the business and nonfarm business sectors by combining real output from the National Income and Product Accounts (NIPA), produced by the BEA, with measures of hours worked, prepared by the BLS Productivity Program. Output for the business sector is estimated as GDP less the output of general government, nonprofit institutions, and the household sector (including owner-occupied housing). Because input-cost measures are used to measure the output for general government services, the household sector, and nonprofit institutions, the trends in these output measures will, by definition, move with measures of input data and will tend to imply little or no labor productivity growth. Therefore, the business sector is the most aggregate sector for which reliable measures of productivity can be produced.5 Nonfarm business sector output further excludes the output of the farm sector, while the nonfinancial corporate sector even further excludes the output of unincorporated businesses and those corporations classified as offices of bank holding companies, offices of other holding companies, or offices in the finance and insurance sector.6
For the U.S. manufacturing sector, as well as for individual manufacturing industries, output is estimated by aggregating U.S. Census Bureau industry shipments data to obtain gross output and then removing transactions that occur within the sector or industry (intrasector or intra-industry transfers). This approach creates a measure of sectoral output that excludes those outputs produced and consumed within the sector or industry. To derive quarterly estimates from the annual manufacturing indexes, BLS adjusts the annual totals with the use of a quarterly reference series and a quadratic minimization formula.7 The quarterly reference series is constructed from the Federal Reserve monthly indexes of Industrial Production.8
Studies of output per hour in individual industries have been produced by BLS since the late 1800s. The BLS industry productivity program has evolved from producing industry-specific studies to the regular publication of annual measures of labor productivity for 199 unique 3- and 4-digit NAICS industries.9 BLS researchers construct industry output measures by using data primarily from the economic censuses and annual surveys of the U.S. Census Bureau, together with information on price changes primarily from BLS. Real output is most often derived by deflating nominal sales or values of production with the use of BLS price indexes and removing intra-industry transactions; however, for a few industries, output is measured by physical quantities of output.10
BEA GDP-by-industry data are available from 2005 to the present, with data for the most current quarter released 120 days after the end of the reference quarter. BEA began working on the prototype for quarterly GDP-by-industry data in 2007, and the measures have evolved over the past 8 years to reflect improved techniques.11 The quarterly data were developed to be consistent with the methodology used to construct time series estimates of the annual industry accounts, which are an extension of the annual input–output (I–O) accounts. The I–O accounts consist of two basic national accounting tables: a make table and a use table. The make table shows the production of goods and services by industry; the sum of the entries across all industries is the total output of commodity throughout the domestic economy. The use table shows the consumption of goods and services by each domestic industry and by final users. The use table also shows the compensation of employees; taxes on production and imports, less subsidies; and gross operating surplus. Together, these three components compose total value added. The make and use tables are constructed from various data sources and are balanced to align the estimates of industry inputs, outputs, and value added across the economy.12
GDP by industry is a key component of the annual industry accounts, measuring each domestic industry’s contribution to GDP.13 BEA uses the annual I–O table and annual GDP-by-industry measures as the starting point for creating quarterly GDP-by-industry estimates. BEA describes five steps taken to estimate quarterly GDP by industry: develop domestic supply by commodity, construct value added by industry, prepare initial use tables, balance use tables, and estimate price and quantity indexes for GDP by industry.14 The five steps are described as follows:
The new GDP-by-industry data provide more timely information on accelerations and decelerations in economic growth at the industry level. These data are a useful addition to the annual industry accounts that BEA publishes. This study makes use of the BEA 2005–14 quarterly output data published on January 22, 2015.
Labor productivity can be computed by using two different representations of output: sectoral or value added.16 Sectoral output is a broader measure of output that removes intermediate inputs produced within an industry or sector from gross output—the total value of goods and services produced by an industry or sector. As previously mentioned, GDP is a value-added measure of output and is equal to gross output less all purchased intermediate inputs.
BLS prefers to use the sectoral output concept when measuring economic growth. This approach acknowledges that changes in the price, quality, and availability of intermediate inputs will influence a firm’s decision concerning its use of capital and labor.17 As such, any changes in labor productivity may be due to technological progress, economies of scale, improved management techniques, and increased skills of the labor force, as well as changes to nonlabor inputs produced outside the industry or sector (i.e., capital services, energy, purchased intermediate materials, and purchased services).18 Labor productivity based on a sectoral output concept will therefore increase with outsourcing and with improvements in the quality of purchased intermediate inputs. If these purchased intermediate inputs are excluded from the value of output, they can no longer be a source of productivity growth.19 Therefore, BLS labor productivity measures for the manufacturing sector, individual manufacturing industries, and NIPA-level nonmanufacturing industries are calculated under a sectoral output approach.
However, there may be circumstances when a value-added output approach to measuring labor productivity, relating output solely to the primary inputs in production, is beneficial.20 For example, to study the relationship between growth in wages and labor productivity, a preferred approach may be one that removes outsourcing and the quality of intermediate inputs from the model.21 Unlike sectoral output measures, value-added output measures will decline with labor as a result of outsourcing; thus labor productivity will be less affected.22 BLS measures for business, nonfarm business, and nonfinancial corporate sector labor productivity are constructed under a value-added approach. Because there few intermediate inputs are purchased from outside these aggregate sectors, labor productivity measures based on value-added output and those based on sectoral output will be similar—the largest difference is due to purchased imported materials.23
Data users may need different output concepts for measuring labor productivity, depending upon which questions they are interested in answering. Value-added productivity measures more closely reflect an industry’s ability to translate technical change into final income, while sectoral productivity measures more closely reflect the technical efficiency with which industries transform inputs into output. Because the choice of sectoral output or value-added output will result in different accelerations and decelerations in measured labor productivity, it is important to be aware of which method is used when interpreting productivity data. For this study, labor productivity measures are presented under both the sectoral and the value-added output approach.
To construct sectoral output measures, intra-industry transactions were removed from the BEA quarterly real gross output-by-industry measures. These intermediate inputs were removed so that output is not overstated relative to the labor hours used to produce that output. Their removal was accomplished by estimating ratios of sectoral output to gross output with the use of industry current-dollar data from the BEA annual I–O use tables before redefinition. Intra-industry transactions were calculated as the sum of all outputs that are produced and used within the same industry group. These transactions were subtracted from gross output, and then a sectoral-output-to-gross-output ratio was constructed. The annual adjustment ratios for each industry group were converted into a quarterly series by using a moving-average procedure to smooth the data. Estimates of real sectoral output by industry were calculated by multiplying the sectoral adjustment ratios by the BEA quarterly real gross output-by-industry data.24
Because complete data for constructing quarterly I–O tables are not available, BEA relies on assumptions about the relationships among industry inputs, outputs, and value added from the annual and benchmark I-O statistics to estimate quarterly output data. Input measures, such as wages from the BLS Quarterly Census of Employment and Wages (QCEW) or employment from the BLS Current Employment Statistics (CES) program, are available more frequently than measures of output. Thus, it is important to determine the extent to which BEA uses these input measures to supplement output data. Although such techniques are suitable for output measurement, they can be troubling for productivity measurement if input and output measures are not sufficiently independent. If similar source data are used in measuring inputs and outputs, then, by definition, labor productivity will be biased toward zero.
Most BEA output measures are constructed from U.S. Census Bureau data; value-of-shipments data are used for mining and manufacturing, revenues for utilities, sales for wholesale and retail trade, and commissions for commodity brokerage. BEA makes strong use of the Census Bureau’s Quarterly Services Survey (QSS) and Service Annual Survey (SAS).25 Industry coverage within the QSS and SAS has been significantly expanded over the past 10 years, resulting in decreased dependence on input-based data for BEA output measures. Since its initial publication of quarterly revenue and expenses for selected information industries in the fourth quarter of 2003, the QSS has added data for selected detailed industries within the following industries: health services (fourth quarter of 2004, first quarter of 2009), professional and business services (third quarter of 2006), administrative services (third quarter of 2006), transportation (first quarter of 2009, first quarter of 2010), leisure (first quarter of 2009), other services (first quarter of 2009), finance (third quarter of 2009), utilities (first quarter of 2010), real estate (first quarter of 2010), educational services (first quarter of 2010), and accommodations (third quarter of 2012).26 The SAS underwent a similar expansion to annual statistics.27 Many of these data have become available only since 2009.
The direct and indirect use of input-based output data is found, to some extent, in 11 service-providing industries. Direct use occurs within portions of seven industries, where input data are either used to estimate the initial annual series or used as an extrapolator to construct the quarterly series. The primary source of input-based output data for estimation of quarterly current-dollar statistics is the BLS QCEW. The information, real estate, management services, administrative services, and other services industries all incorporate QCEW data into quarterly output estimates.
It is difficult to quantify the impact of input-based data that are used indirectly, because such use often represents only a small portion of the industry measure. Input-based data are used to estimate some price indexes in both the professional and business services and the educational services industries. Indirect use of input-based data is also present when estimates are based on NIPA Personal Consumption Expenditures that have been constructed from input-based data. Industries affected by the indirect use of input-based data include finance and insurance, real estate, professional and business services, educational services, health services, leisure, and accommodations.28
Gross output for most service-sector industries is derived from QSS data. However, labor productivity measures should be viewed with caution for those industries where input data are used to construct output measures.
BLS does not consider productivity for the total economy to be a reliable indicator, because of the correlation between measuring output and measuring labor input for several segments of the economy, especially nonprofit institutions serving households (NPISH). Because the output of NPISH cannot be measured independently of labor inputs, productivity measures that include NPISH will have a downward bias.
Information on the presence of NPISH within each industry group is available, allowing data users to estimate industry output and GDP share of nonprofits. Table 1 shows that NPISH are heavily concentrated in education (78 percent of educational services), health services (89 percent of hospitals and 63 percent of social assistance programs), leisure services (91 percent of museums, historical sites, and similar institutions), and other services (76 percent of religious, grantmaking, civic, professional, and similar organizations). From these data, it is estimated that input-based methods are affecting approximately 5 percent of measured GDP.
| Industry group | Detailed industry affected | Nonprofit percentage of output | Industry share of GDP | Percent of GDP affected |
|---|---|---|---|---|
| Information | Broadcasting and telecommunications | 1.70 | 2.76 | 0.01 |
| Professional and business services | Professional, scientific, and technical services | 2.40 | 6.39 | .12 |
| Educational services | Educational Services | 78.00 | 1.14 | .94 |
| Health services | Ambulatory health care services | 12.60 | 3.17 | .35 |
| Hospitals | 89.10 | 2.55 | 2.17 | |
| Nursing and residential care facilities | 40.70 | .76 | .29 | |
| Social assistance | 63.30 | .59 | .38 | |
| Leisure | Performing arts, spectator sports, and related industries | 25.10 | .48 | .04 |
| Museums, historical sites, and similar institutions | 91.10 | .05 | .04 | |
| Amusement, gambling, and recreation industries | 22.50 | .45 | .05 | |
| Accommodations | Accommodations | 1.90 | .72 | .00 |
| Other services | Religious, grantmaking, civic, professional, and similar organizations | 76.10 | .74 | .67 |
| Source: Authors’ calculations based on data from U.S. Bureau of Labor Statistics and U.S. Bureau of Economic Analysis. | ||||
For the BLS quarterly business sector labor productivity measures, BEA provides aggregate business sector output and BLS uses data from the Economic Census and BEA to remove labor hours for nonprofits. Because the new, quarterly BEA industry output data do not exclude output for nonprofit institutions, this study adjusts both output and hours measures to remove NPISH at the industry level. The data presented show industry measures, less the nonprofit portion of the industry, corresponding to the private business sector portion of each industry.
Figure 1 presents the differences between GDP by industry measured as sectoral output and value-added output for 2014. The dollar level of sectoral output will always be larger than the dollar level of value-added output. The difference between the two series represents the value of the intermediate inputs that the industry is purchasing from outside its borders. The largest differences are found in the manufacturing and real estate industries; the smallest differences are found in education services, leisure services, and utilities.
BLS does not currently publish quarterly hours worked for all people by industry.29 Quarterly hours data have been constructed for this research study and, unless otherwise noted, closely follow the methods used to calculate quarterly estimates of hours worked that underlie the business sector productivity data.
The primary source of hours data is the average-weekly-hours-paid series for production workers in goods-producing industries and for nonsupervisory workers in service-providing industries from the CES program.30 CES program surveys approximately 146,000 establishments, collecting employment and hours-paid data. Seasonally adjusted monthly data from the CES are used to construct quarterly averages of employment and quarterly employment-weighted averages of average weekly hours.31 The CES average weekly hours for production and nonsupervisory employees32 (AWHPCES ) are adjusted to an hours-worked basis by using an hours-worked-to-hours-paid ratio (hwhpPNCS ) estimated from data provided by the National Compensation Survey (NCS).33 The hours-worked adjustment controls for changes in vacation, holiday, and sick pay. Total hours worked by production and nonsupervisory employees (HP) are calculated as
 (1)
(1)
where NP is the CES employment of production and nonsupervisory employees.34
Average weekly hours for nonproduction and supervisory workers are estimated by applying a ratio adjustment from the BLS Current Population Survey (CPS) to the hours data for production and non-supervisory employees. The CPS ratio is equal to the average weekly hours worked by nonproduction and supervisory employees divided by the average weekly hours worked by production and nonsupervisory employees.35 This ratio is seasonally adjusted by means of an X-12-ARIMA program and is combined with the average-weekly-hours-worked series for production and nonsupervisory employees, as well as CES employment data.36 Total hours worked by nonproduction and supervisory employees (HNP) are estimated as
 (2)
(2)
where AWHNPCPSand AWHPCPS represent CPS measures of average weekly hours for nonproduction and supervisory employees and production and nonsupervisory employees, respectively. NNP is the CES employment notation for nonproduction and supervisory employees.37
Total hours is the sum of all employee hours and the hours worked by self-employed and unpaid family workers. Hours worked by self-employed and unpaid family workers are estimated by pooling 3 months of self-reported weekly hours from the CPS for the 20 major industry groups that match the GDP-by-industry series.38 There are too few observations from the CPS to construct data on self-employed and unpaid family workers for the management-of-companies-and-enterprises industry group. Therefore, data on the self-employed and unpaid family workers are created as the residual of all professional and business services, less professional and technical services and administrative and waste management services. For the agricultural services industry group, the category of hours worked on farms is constructed on the basis of CPS data.39 Although the use of quarterly CPS data for the 20 industries of interest in this study is reasonable, further industry detail on a quarterly basis may be beyond the limits of the available CPS data.
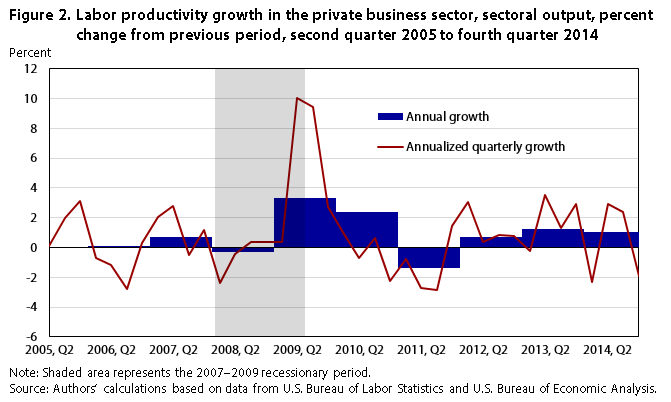
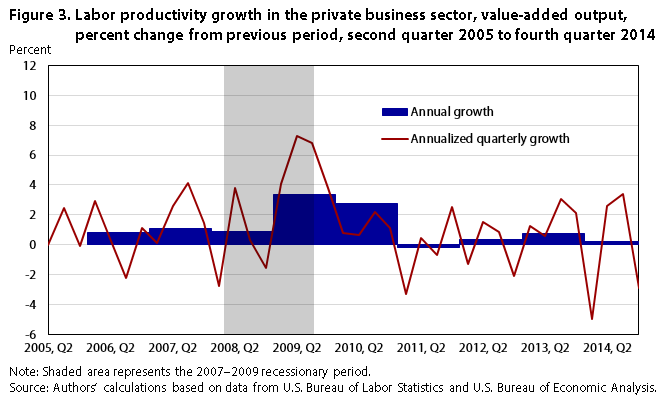
Quarter-to-quarter growth in labor productivity is calculated as quarter-to-quarter growth in output less quarter-to-quarter growth in labor hours and is expressed as an annual rate to facilitate comparisons with annual growth rates. Figures 2 and 3 use the sectoral output and value-added output approaches, respectively, to compare annual average growth rates of labor productivity with corresponding quarter-to-quarter growth rates in the private business sector.40
Notice that, under both sectoral and value-added methodologies, the quarterly productivity growth rates provide additional information that is not readily apparent from the annual labor productivity growth rates: the quarter-to-quarter labor productivity growth rates show higher peaks and deeper troughs than the annual growth rates. (See table 2). During the recessionary period, the fourth quarter of 2007 through the second quarter of 2009, average annual growth was modest (1.2 percent under the sectoral output approach; 1.6 percent under the value-added output approach), while quarterly data fluctuated considerably from period to period. (See tables 3 and 4.) Within time period, quarterly labor productivity growth rates ranged from −2.4 to 10.1 percent under the sectoral output approach and ranged from −2.8 to 7.3 percent under the value-added approach.
| Year and quarter | Value-added output | Sectoral output |
|---|---|---|
| 2005, Q2 | −0.01 | 0.00 |
| 2005, Q3 | 2.48 | 1.98 |
| 2005, Q4 | −.09 | 3.15 |
| 2006, Q1 | 2.90 | −.73 |
| 2006, Q2 | .22 | −1.18 |
| 2006, Q3 | −2.21 | −2.76 |
| 2006, Q4 | 1.14 | .32 |
| 2007, Q1 | .11 | 2.08 |
| 2007, Q2 | 2.59 | 2.80 |
| 2007, Q3 | 4.11 | −.53 |
| 2007, Q4 | 1.48 | 1.21 |
| 2008, Q1 | −2.79 | −2.35 |
| 2008, Q2 | 3.80 | −.45 |
| 2008, Q3 | .35 | .39 |
| 2008, Q4 | −1.56 | .40 |
| 2009, Q1 | 4.06 | .38 |
| 2009, Q2 | 7.27 | 1.06 |
| 2009, Q3 | 6.79 | 9.40 |
| 2009, Q4 | 3.78 | 2.75 |
| 2010, Q1 | .77 | .88 |
| 2010, Q2 | .68 | −.67 |
| 2010, Q3 | 2.20 | .67 |
| 2010, Q4 | 1.11 | −2.28 |
| 2011, Q1 | −3.3 | −.77 |
| 2011, Q2 | .47 | −2.75 |
| 2011, Q3 | −.68 | −2.86 |
| 2011, Q4 | 2.54 | 1.44 |
| 2012, Q1 | −1.29 | 3.03 |
| 2012, Q2 | 1.54 | .35 |
| 2012, Q3 | .84 | .81 |
| 2012, Q4 | −2.12 | .79 |
| 2013, Q1 | 1.24 | −.21 |
| 2013, Q2 | .59 | 3.54 |
| 2013, Q3 | 3.05 | 1.32 |
| 2013, Q4 | 2.11 | 2.91 |
| 2014, Q1 | −4.95 | −2.33 |
| 2014, Q2 | 2.58 | 2.92 |
| 2014, Q3 | 3.40 | 2.40 |
| 2014, Q4 | −2.91 | −1.91 |
| Source: Authors' calculations based on data from U.S. Bureau of Labor Statistics and U.S. Bureau of Economic Analysis. | ||
| Industry | 2005−14 | 2005, Q1− 2007, Q4 | 2007, Q4− 2009, Q2 | 2009, Q2− 2014, Q4 |
|---|---|---|---|---|
| Private business | 0.01 | 0.53 | 1.20 | 0.88 |
| Agriculture services | −.58 | −1.75 | 2.33 | −.86 |
| Mining | −.5 | −6.36 | 7.30 | .04 |
| Utilities | −1.46 | −.2 | −8.79 | .36 |
| Construction | −1.49 | −5.27 | 2.60 | −.82 |
| Manufacturing | 1.65 | 2.02 | −1.8 | 2.62 |
| Durable manufacturing | 1.90 | 2.33 | −5.87 | 4.56 |
| Nondurable manufacturing | 1.05 | .40 | .73 | 1.47 |
| Wholesale trade | 1.20 | .94 | −9.68 | 5.25 |
| Retail trade | 1.02 | 1.15 | −2.52 | 2.11 |
| Transportation | .43 | 2.03 | −3.36 | .87 |
| Information | 4.80 | 4.91 | 2.69 | 5.21 |
| Finance, insurance, and real estate | 1.65 | 2.20 | .97 | 1.51 |
| Finance | 1.18 | 3.05 | −.35 | .61 |
| Real estate | 1.55 | 1.51 | 1.81 | 1.41 |
| Professional, management, and administrative services | .62 | −.25 | 1.73 | .69 |
| Professional and business services | .15 | −.99 | .47 | .66 |
| Management services | 1.31 | −.92 | −4.18 | 4.38 |
| Administrative and waste management services | 1.33 | 1.66 | 3.76 | .21 |
| Education and health services | 1.25 | .86 | 1.02 | 1.48 |
| Education services | 1.49 | 2.58 | .92 | 1.08 |
| Health services | 1.20 | .59 | 1.00 | 1.54 |
| Leisure and hospitality | .42 | 1.02 | −1.08 | .58 |
| Leisure | 2.17 | 5.19 | .90 | .82 |
| Accommodations | .01 | .07 | −1.74 | .57 |
| Other services | .07 | −.06 | −2.2 | .90 |
| Goods | .70 | −.82 | 2.24 | .96 |
| Services | .97 | 1.10 | −.01 | 1.18 |
| Source: Authors' calculations based on data from U.S. Bureau of Labor Statistics and U.S. Bureau of Economic Analysis. | ||||
| Industry group | 2005−14 | 2005, Q1− 2007, Q4 | 2007, Q4− 2009, Q2 | 2009, Q2− 2014, Q4 |
|---|---|---|---|---|
| Private business | 1.06 | 1.06 | 1.59 | 0.83 |
| Agriculture services | .44 | −4.32 | 11.41 | −.35 |
| Mining | .60 | −4.95 | 16.75 | −1.75 |
| Utilities | 1.19 | 1.60 | −5.78 | 3.21 |
| Construction | −1.58 | −5.44 | 1.69 | −.57 |
| Manufacturing | 2.26 | 4.43 | 1.82 | 1.12 |
| Durable manufacturing | 3.27 | 5.73 | −.16 | 3.01 |
| Nondurable manufacturing | 1.08 | 3.01 | 3.23 | −.74 |
| Wholesale trade | .62 | 2.07 | −5.22 | 1.85 |
| Retail trade | .55 | .22 | −.06 | .91 |
| Transportation | .27 | 2.93 | −1.17 | −.69 |
| Information | 4.71 | 7.06 | 1.54 | 4.28 |
| Finance, insurance, and real estate | 2.14 | 1.80 | 3.99 | 1.62 |
| Finance | 2.08 | −.89 | 7.94 | 1.77 |
| Real estate | 2.19 | 3.58 | 3.20 | 1.00 |
| Professional, management, and administrative services | .62 | −.34 | 2.20 | .58 |
| Professional and business services | .28 | −.55 | 1.25 | .39 |
| Management services | −.18 | −4.86 | −4.96 | 4.14 |
| Administrative and waste management services | 1.27 | 1.70 | 3.61 | .14 |
| Education and health services | .50 | .18 | 2.05 | .17 |
| Education services | −.3 | .57 | 1.94 | −1.41 |
| Health services | .58 | .27 | 2.04 | .26 |
| Leisure and hospitality | −.2 | −.13 | −2.59 | .58 |
| Leisure | 1.78 | 2.84 | .45 | 1.56 |
| Accommodations | −.59 | −.6 | −3.35 | .39 |
| Other services | −.67 | −1.07 | −2.5 | .19 |
| Goods | 1.38 | .92 | 3.39 | .85 |
| Services | .94 | 1.09 | .93 | .82 |
| Source: Authors' calculations based on data from U.S. Bureau of Labor Statistics and U.S. Bureau of Economic Analysis. | ||||
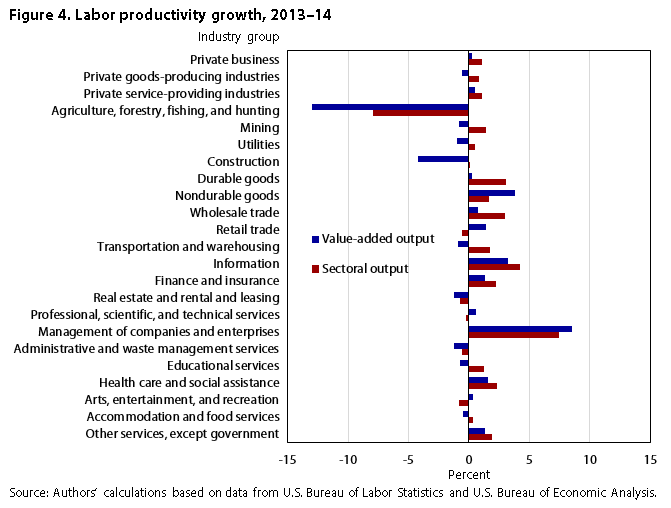
The heterogeneity among individual industries is lost when the data are presented at the aggregate level, as opposed to when data are shown in industry-level detail. Figure 4 presents the 2013–14 annual growth in labor productivity across all industries, under both the sectoral output and value-added output approach. For some industries, the story is the same for both output concepts, while in other industries the story is quite different. For example, in the retail trade sector, there is negative labor productivity growth from the sectoral output approach, but positive productivity growth with the value-added approach. Recall that the difference between sectoral and value-added output is that sectoral output excludes only those materials purchased from within the retail trade sector while value-added output excludes all intermediate purchases. Therefore, if sectoral labor productivity is declining, and value-added labor productivity is growing in retail trade, then the materials that are purchased from outside retail trade are declining.
Under the sectoral output approach, labor productivity growth between 2013 and 2014 varied among individual industries, ranging from a decline of 8.0 percent (agriculture, forestry, fishing and hunting) to an increase of 7.4 percent (management of companies and enterprises). Labor productivity growth of 1.1 percent reflects a growth of 1.1 percent for service-providing industries and a growth of 0.8 percent for goods-producing industries. Labor productivity for service-providing industries was higher than that of goods-producing industries, a result of strong growth in the management and information industries. Concurrently, the slower growth of goods-producing industries was triggered by declines in agriculture. Under the value-added approach, labor productivity growth between 2013 and 2014 also varied among individual industries, ranging from a decline of 13.0 percent (agriculture, forestry, fishing, and hunting) to an increase of 8.5 percent (management of companies and enterprises). Labor productivity growth of 0.3 percent for total private business reflects a growth of 0.5 percent for service-providing industries and a decline of 0.5 percent for goods-producing industries.
The heterogeneity in labor productivity growth among industries is more pronounced in quarterly data than in annual data. In any given quarter, labor productivity growth will vary dramatically across industries. Over the most recent quarters, the smallest across-industry variation was 17.0 percent in the second quarter of 2013, with accommodations and food services declining 4.0 percent and administrative services growing 13.2 percent. In contrast, the largest variation across industries was 47.0 percent in the first quarter of 2013, with administrative and waste management services declining 15.6 percent and agriculture growing 31.7 percent. We do not see a similar range of variation in the annual data. Table 5 presents quarterly labor productivity growth rates for the last eight quarters of the reference period under the sectoral output approach; value-added data are presented in table 6. It is clear that the quarterly data present a more dynamic picture than the annual data. In the nondurable manufacturing industry (see figure 5), annual labor productivity grew 1.7 percent from 2013 to 2014, representing five quarters of moderate growth (from 1.7 percent to 4.3 percent) interspersed with three quarters of decline (from −0.1 percent to −1.7 percent). During this same period, the wholesale trade industry experienced six quarters of increases with only two periods of decline, an observation that is not evident from the 3.0 percent annual growth rate, visible in figure 6. Such volatility occurs within each of the 20 industries, but is not readily apparent in annual data.
<id="columnhead8">
| Industry group | 2013 | 2014 | 2012–13 | 2013–14 | Minimum growth rate | Maximum growth rate | ||||||
|---|---|---|---|---|---|---|---|---|---|---|---|---|
| Q1 | Q2 | Q3 | Q4 | Q1 | Q2 | Q3 | Q4 | |||||
| Agriculture, forestry, fishing, and hunting | 31.72 | 11.32 | −13.83 | −4.65 | −7.78 | −1.66 | −26.33 | −1.96 | 9.07 | −7.97 | −26.33 | 31.72 |
| Mining | −3.6 | 3.84 | 8.02 | −14.17 | −2.87 | 26.07 | 1.10 | −17.34 | 4.09 | 1.42 | −17.34 | 26.07 |
| Utilities | −4.33 | 4.02 | −3.55 | 22.86 | −9.78 | −8.15 | 2.57 | 6.87 | −.16 | .47 | −9.78 | 22.86 |
| Construction | −4.48 | 3.87 | 6.66 | 2.67 | −3.91 | .42 | −2.63 | −3.08 | −.48 | .10 | −4.48 | 6.66 |
| Durable goods | 2.44 | 5.56 | 1.90 | 2.08 | 2.90 | 4.68 | 3.62 | .11 | 3.08 | 3.04 | .11 | 5.56 |
| Nondurable goods | 3.39 | 1.68 | −1.67 | −.12 | 2.28 | 4.05 | 4.33 | −.94 | 1.05 | 1.70 | −1.67 | 4.33 |
| Wholesale trade | 3.91 | .75 | 4.76 | 9.05 | −5.02 | 5.57 | 7.30 | 1.37 | 1.34 | 3.02 | −5.02 | 9.05 |
| Retail trade | 1.04 | .02 | 2.19 | 2.26 | −8.35 | 7.04 | .66 | −7.81 | 3.24 | −.61 | −8.35 | 1.04 |
| Transportation and warehousing | −5.8 | 4.35 | .25 | .59 | .83 | 2.93 | 2.26 | 4.82 | −1.66 | 1.75 | −5.8 | 4.82 |
| Information | .66 | 1.80 | 13.24 | 8.36 | −2.56 | 5.92 | .68 | 4.92 | 4.59 | 4.19 | −2.56 | 13.24 |
| Finance and insurance | 12.57 | −.04 | .41 | 8.83 | 1.83 | 1.92 | −1.34 | −1.21 | 3.67 | 2.23 | −1.34 | 12.57 |
| Real estate and rental and leasing | −4.33 | −.32 | −1.25 | .33 | −3.73 | .55 | 2.89 | −2.34 | −1.25 | −.71 | −4.33 | 2.89 |
| Professional, scientific, and technical services | −8.11 | 5.82 | 2.54 | −1.40 | −7.9 | 5.18 | 3.37 | −.08 | −2.7 | −.20 | −8.11 | 5.82 |
| Management of companies and enterprises | −1.63 | 1.72 | 7.63 | 3.54 | 7.02 | 13.39 | 8.69 | −2.41 | .87 | 7.43 | −1.63 | 13.39 |
| Administrative and waste management services | −15.63 | 13.20 | −5.47 | .08 | −2.57 | 1.20 | −4.11 | 3.72 | −1.46 | −.61 | −15.63 | 13.20 |
| Educational services | 3.09 | 3.56 | 3.26 | 1.97 | −1.16 | 2.30 | −.24 | 1.76 | 2.52 | 1.22 | −1.16 | 3.56 |
| Health care and social assistance | −1.01 | 4.95 | 3.55 | 4.48 | −5.42 | 6.55 | 6.08 | 3.56 | 1.81 | 2.34 | −5.42 | 6.55 |
| Arts, entertainment, and recreation | −14.49 | 8.57 | −.50 | 3.31 | −4.47 | −8.16 | 5.49 | 2.40 | −1.20 | −.78 | −14.49 | 8.57 |
| Accommodation and food services | .53 | −4.02 | −2.52 | 3.88 | −3.76 | 5.58 | .64 | .70 | −.41 | .35 | −4.02 | 5.58 |
| Other services, except government | −6.35 | −.85 | .58 | 2.77 | .42 | 2.48 | 7.66 | −3.00 | −.57 | 1.89 | −6.35 | 7.66 |
| Private Business Sector | −.21 | 3.54 | 1.32 | 2.91 | −2.33 | 2.92 | 2.40 | −1.91 | 1.23 | 1.05 | −2.33 | 3.54 |
Private goods-producing industries | 2.33 | 6.65 | 1.29 | .56 | .15 | 1.68 | 1.69 | −6.78 | 2.91 | .80 | −6.78 | 6.65 |
Private service-providing industries | −1.14 | 2.46 | 1.28 | 3.75 | −3.10 | 3.05 | 2.37 | −.01 | .67 | 1.09 | −3.10 | 3.75 |
| Source: Authors' calculations based on data from U.S. Bureau of Labor Statistics and U.S. Bureau of Economic Analysis. | ||||||||||||
| Industry group | 2013 | 2014 | 2012−13 | 2013−14 | Minimum growth rate | Maximum growth rate | ||||||
|---|---|---|---|---|---|---|---|---|---|---|---|---|
| Q1 | Q2 | Q3 | Q4 | Q1 | Q2 | Q3 | Q4 | |||||
| Agriculture, forestry, fishing, and hunting | 82.35 | 15.87 | −2.17 | −6.54 | −32.17 | 6.41 | −19.17 | −3.34 | 16.68 | −12.99 | −32.17 | 82.35 |
| Mining | −9.54 | 2.43 | −0.19 | .38 | −24.34 | 12.09 | 19.64 | 8.64 | 3.43 | −0.86 | −24.34 | 19.64 |
| Utilities | 5.68 | −2.38 | .44 | 5.00 | −22.87 | 16.49 | 16.67 | −7.88 | −0.39 | −1.01 | −22.87 | 16.67 |
| Construction | −3.73 | −3.77 | 4.41 | −2.13 | −10.19 | −5.01 | −1.36 | −5.77 | −1.69 | −4.18 | −10.19 | 4.41 |
| Durable goods | −1.14 | 3.03 | 3.53 | −1.19 | −3.42 | 2.49 | 3.91 | −3 | .61 | .25 | −3.42 | 3.91 |
| Nondurable goods | 12.20 | .11 | 5.66 | 9.56 | 3.36 | 5.41 | −5.23 | 3.46 | .85 | 3.78 | −5.23 | 12.20 |
| Wholesale trade | 1.16 | 3.28 | 2.10 | 1.06 | −6.48 | 3.77 | 7.82 | 1.23 | .56 | .73 | −6.48 | 7.82 |
| Retail trade | 12.76 | −5.26 | 1.66 | 3.82 | 1.65 | 3.72 | .11 | −4.43 | 2.69 | 1.42 | −5.26 | 12.76 |
| Transportation and warehousing | 1.54 | −3.57 | 2.82 | 3.66 | −3.4 | −2.83 | 2.46 | −9.43 | −2.33 | −0.93 | −9.43 | 3.66 |
| Information | 17.45 | 2.29 | 12.51 | 12.60 | −9.73 | 7.10 | 2.76 | 1.02 | 4.82 | 3.22 | −9.73 | 17.45 |
| Finance and insurance | 2.49 | 4.68 | 5.09 | 2.82 | −10.22 | 5.22 | 19.98 | −10.53 | 4.60 | 1.32 | −10.53 | 19.98 |
| Real estate and rental and leasing | .21 | −3.1 | 1.26 | 1.94 | −6.72 | −0.57 | 3.51 | −3.13 | −1.8 | −1.21 | −6.72 | 3.51 |
| Professional, scientific, and technical services | −14.17 | 2.06 | 7.17 | −3.07 | −4.79 | 5.38 | 2.14 | 1.54 | −2.35 | .63 | −14.17 | 7.17 |
| Management of companies and enterprises | −20.49 | 9.60 | 12.13 | 8.04 | 5.28 | 14.47 | 9.46 | −4.31 | 1.24 | 8.49 | −20.49 | 14.47 |
| Administrative and waste management services | −7.21 | 2.56 | −0.76 | .65 | −6.02 | 2.41 | −1.73 | −2.3 | −1.17 | −1.27 | −7.21 | 2.56 |
| Educational services | −4.42 | −0.78 | 1.24 | −0.15 | −2.63 | −2.57 | 3.10 | −1.36 | −1.27 | −0.78 | −4.42 | 3.10 |
| Health care and social assistance | 2.93 | .54 | 1.71 | −0.61 | 3.14 | 3.74 | −0.12 | −0.19 | 1.16 | 1.60 | −0.61 | 3.74 |
| Arts, entertainment, and recreation | −14.02 | 11.93 | −2.7 | 2.08 | −7.47 | 1.04 | 8.94 | .43 | −0.47 | .31 | −14.02 | 11.93 |
| Accommodation and food services | −1.13 | −5.9 | −1.26 | 2.91 | −2.61 | 1.47 | .74 | −2.83 | −1.56 | −0.46 | −5.9 | 2.91 |
| Other services, except government | −0.93 | −0.98 | 3.10 | 4.97 | −1.73 | −2.5 | 10.10 | −4.36 | .33 | 1.35 | −4.36 | 10.10 |
| Private Business Sector | 1.24 | .59 | 3.05 | 2.11 | −4.95 | 2.58 | 3.40 | −2.91 | .73 | .25 | −4.95 | 3.40 |
Private goods-producing industries | 5.34 | 1.49 | 2.58 | 1.93 | −5.36 | 1.78 | −0.87 | −1.48 | 1.42 | −0.54 | −5.36 | 5.34 |
Private service-providing industries | .01 | .32 | 3.19 | 2.17 | −4.82 | 2.82 | 4.69 | −3.32 | .52 | .48 | −4.82 | 4.69 |
| Source: Authors' calculations based on data from U.S. Bureau of Labor Statistics and U.S. Bureau of Economic Analysis. | ||||||||||||
Data users are often interested in short-term movements. However, such movements are subject to greater volatility than longer term movements. Macroeconomic series, such as GDP, frequently fluctuate around a trend that varies over time. Because of this tendency, the permanent trend should be separated from the transitory component. Most frequently, volatility is estimated on the basis of the standard deviation of the growth rate.41 Referring back to tables 5 and 6, we see that quarterly growth rates are much more volatile than annual average growth rates. From 2013 to 2014, growth in labor productivity in the retail trade industry declined an average of 0.6 percent across eight quarters under the sectoral output approach. The quarterly data reveal that growth ranged from a minimum of −8.3 percent in the first quarter of 2014 to a maximum of 10.0 percent in the first quarter of 2013. The value-added approach yields similar results for this industry, with quarterly growth ranging from a minimum of −5.3 percent in the second quarter of 2013 to a maximum of 12.8 percent in the first quarter of 2013. By contrast, the average annual growth rate from 2013 to 2014 was a constant 1.4 percent.
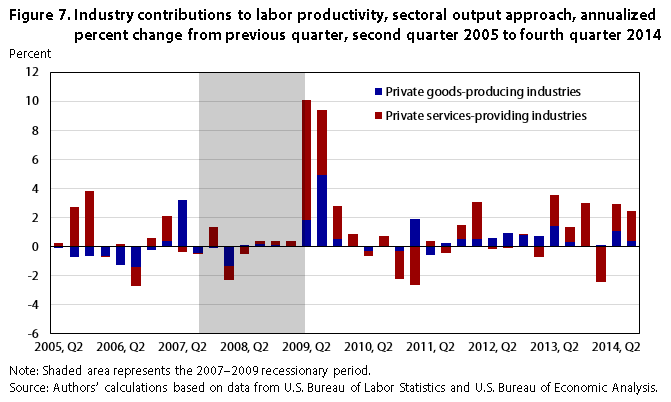
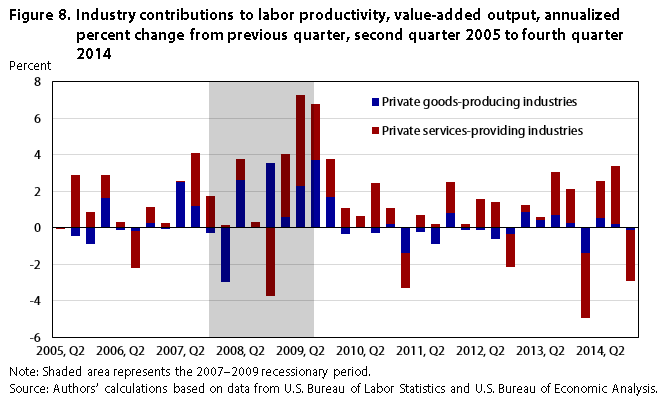
To examine how individual industries affect growth in the private business sector, industry contributions were calculated as the individual industry’s growth in labor productivity weighted by its average share of output in the two periods of interest.42 For ease of exposition, figures 7 and 8 show how the broad groups of private goods-producing and service-providing industries contribute to the growth in aggregate labor productivity measures. Notice that, in most quarters, service-providing industries are contributing to both the majority of gains and the majority of declines in aggregate labor productivity.
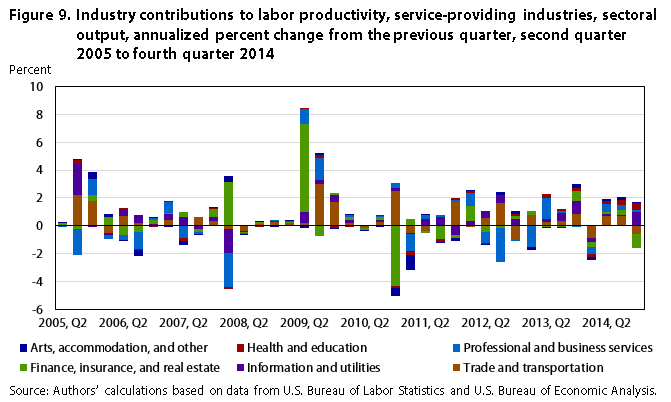
A closer look at individual service-providing industries reveals that, under the sectoral output approach, the finance, insurance, and real estate industry contributed to strong gains in the second quarter of 2009. (See figure 9.) In the fourth quarter of 2014, the losses in labor productivity are also primarily from this industry while the gains can be attributed primarily to the information and utilities industries.
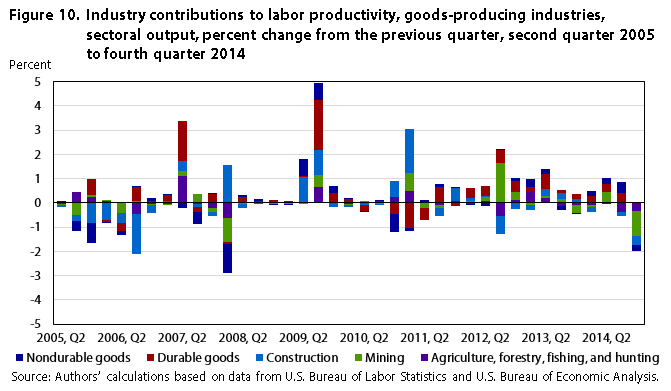
Among the goods-producing industries, there were early gains in construction and nondurable goods in the second quarter of 2009 followed by gains in all goods-producing industries in the third quarter of that year. (See figure 10.) However, in the fourth quarter of 2014, productivity declines were due largely to negative productivity growth in mining. These quarterly data on labor productivity by industry provide new insights into economic activity and highlight the heterogeneity among industries, complementing the existing aggregate labor productivity measures.
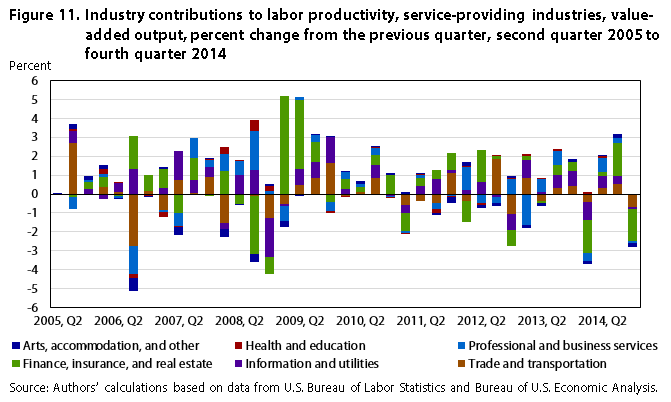
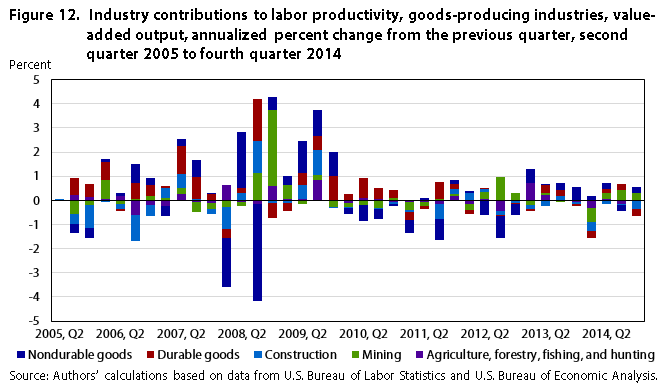
Under the value-added methodology, the finance, insurance, and real estate industry is the greatest contributor to aggregate gains in service-providing industries coming out of the recessionary period. (See figure 11.) However, in the fourth quarter of 2014 (the most recent quarter included in the figures), this industry contributed heavily to the decline in aggregate productivity. Among goods-producing industries, durable goods manufacturing exhibited strong growth, contributing significantly to aggregate labor productivity coming out of the recession. In this most recent quarter, productivity growth in durable manufacturing and construction were offset by productivity declines in mining and nondurable manufacturing, resulting in little growth in the goods-producing sector. (See figure 12.)
Sustained growth in labor productivity enables an economy to produce additional goods and services without an increase in labor resources, resulting in higher standards of living. Given the newly available quarterly GDP-by-industry data, this study showed that it is feasible to create reasonable quarterly hours-worked measures for 20 industry groups of interest; however, further industry detail on a quarterly basis may be beyond the limits of the available CPS hours data. Although quarterly labor productivity data at the industry level offer users insights into which industries are contributing the most to aggregate productivity growth, the high volatility in the data limit their usefulness.
This quarterly labor productivity measures developed in this study at the industry level are presented as growth in output relative to growth in hours worked. Labor productivity series were constructed out of both GDP-by-industry data and a broader measure of sectoral output.
It is apparent from the data that the choice of output approach affects labor productivity growth rates as well as individual industry contributions to aggregate economic growth. It is therefore important for data users to be aware of whether intermediate purchases from outside the industry are included or excluded from measures of output. In addition, adjustments were made to both output and labor data to eliminate known sources of productivity bias resulting from the use of input data in the construction of measured output. That is, the output and hours worked by NPISH were removed from the industry data. Although their removal improved the data, in some industries input and output data remain correlated, and users should be cautious when interpreting these data, particularly in the information, real estate, management services, administrative services, finance and insurance, professional and business services, leisure, accommodations, and other services industries.
Under both the sectoral and value-added methodologies, quarterly productivity growth rates provide additional information that cannot be gleaned from existing aggregate quarterly or annual industry measures. Heterogeneity among individual industries is lost when the data are presented at the aggregate level, and quarter-to-quarter labor productivity growth rates show higher peaks and deeper troughs than the annual growth rates exhibit for specific industries. In addition, the heterogeneity in labor productivity growth among industries is more pronounced in the quarterly data. However, because quarterly labor productivity data at the industry level are highly volatile, data users should use the information to supplement long-run analysis and should be cautious when drawing conclusions about the state of the economy on the basis of a single quarterly data point.
ACKNOWLEDGMENTS: The authors thank Mark Dumas, John Glaser, Christopher Kask, Paul Kern, Sabrina Pabilonia, Steven Rosenthal, John Ruser, Chris Sparks, Jay Stewart, Erich Strassner, Victor Torres, and David Wasshausen for helpful comments. All views expressed in this article are those of the authors and do not necessarily reflect the views or policies of the U.S. Bureau of Labor Statistics.
Lucy P. Eldridge and Jennifer Price, "Measuring quarterly labor productivity by industry," Monthly Labor Review, U.S. Bureau of Labor Statistics, June 2016, https://doi.org/10.21916/mlr.2016.28
1 Major sectors include business, nonfarm business, manufacturing, and nonfinancial corporations. Annual industry measures are calculated for two-, three-, four-, five-, and six-digit industries as defined by the North American Industry Classification System (NAICS). For more information, see Labor Productivity and Costs, (U.S. Bureau of Labor Statistics), https://www.bls.gov/lpc/home.htm.
2 “New quarterly statistics detail industries’ economic performance: statistics span first quarter of 2005 through fourth quarter of 2013 and Annual Results for 2013,” news release (U.S. Bureau of Economic Analysis, April 25, 2014), https://apps.bea.gov/newsreleases/industry/gdpindustry/2014/gdpind413.htm.
3 The government sector is not included in the study.
4 The press release includes quarterly and annual indexes, and percentage changes, for output per hour and related measures, such as unit labor costs, real and current dollar compensation per hour, and unit nonlabor payments. (See Labor Productivity and Costs.)
5 Although quarterly labor productivity measures are produced for the total economy, the methods for estimating output for some components of the economy are problematic for productivity measurement. Thus, measures of productivity for the total economy are considered less reliable than business sector measures and are not included in the press release.
6 Although the farm sector in the United States is small, it is highly volatile. For more information on BLS methods, see “Technical information about the BLS major sector productivity and cost measures” (U.S. Bureau of Labor Statistics, March 11, 2008), https://www.bls.gov/lpc/lpcmethods.pdf.
7 Frank T. Denton, “Adjustment of monthly or quarterly series to annual totals: an approach based on quadratic minimization,” Journal of the American Statistical Association, vol. 66, no. 333 (March 1971), pp. 99–102, http://www.oecd.org/std/21779760.pdf. The Denton proportional first-difference method preserves the pattern of growth in quarterly indicator series by minimizing the proportional period-to-period change while meeting the average annual level constraints.
8 Because of a lag in the availability of the annual benchmark data, more recent quarterly and annual manufacturing output measures are also extrapolated on the basis of changes to the indexes of Industrial Production.
9 Industry measures produced include output per hour, output per employee, output, implicit price deflators, employment, hours of employees, labor compensation, and unit labor costs. Separate news releases are issues for selected services, manufacturing, and trade.
10 BLS Handbook of Methods (U.S. Bureau of Labor Statistics), chapter 11, p. 2, https://www.bls.gov/opub/hom/pdf/homch11.pdf.
11 For more information on the evolution and early phases of the development of quarterly GDP-by-industry statistics, see Carol A. Robbins, Thomas F. Howells, and Wendy Li, "Experimental quarterly U.S. gross domestic product by industry statistics," Survey of Current Business (U.S. Bureau of Economic Analysis, February 2010), pp. 24–31, https://apps.bea.gov/scb/pdf/2010/02%20February/0210_gdp_indy.pdf.
12 Annual I–O accounts are available for 1997–2012 and include data on 69 industries. Benchmark I–O accounts include more detailed information for about 400 industries. Benchmark I–O accounts are prepared roughly every 5 years and are based on detailed data from the Economic Census conducted by the Census Bureau. The 2007 benchmark was released in December 2014. For more information, see Donald D. Kim, Erich H. Strassner, and David B. Wasshausen, “Industry economic accounts: results of the comprehensive revision, revised statistics for 1997–2012,” Survey of Current Business (U.S. Bureau of Economic Analysis, February 2014), pp.1–18, https://apps.bea.gov/scb/pdf/2014/02%20February/0214_industry%20economic%20accounts.pdf.
13 See “Measuring the nation’s economy: an industry perspective, a primer on BEA industry accounts” (U.S. Bureau of Economic Analysis, May 2011), https://www.bea.gov/resources/methodologies/industry-primer.
14 For a complete description of methods and source data, see Erich H. Strassner and David B. Wasshausen “New quarterly gross domestic product by industry statistics,” Survey of Current Business (U.S. Bureau of Economic Analysis, May 2014), https://apps.bea.gov/scb/pdf/2014/05%20May/0514_gdp-by-industry.pdf.
15 The domestic and foreign portions of intermediate inputs are deflated separately to account for commodities purchased as inputs from both domestic and foreign sources.
16 Labor productivity is not measured under a gross output concept because, under that concept, intermediate inputs made within an industry or sector would be double counted—counted by both the establishment producing the product and the establishment consuming the product.
17 Edwin R. Dean, Michael J. Harper, and Mark S. Sherwood, “Productivity measurement with changing weight indices of outputs and inputs,” Industry Productivity: International Comparison and Measurement Issues (Paris: Organisation for Economic Co-operation and Development, Washington, DC, 1996), chap. 7, pp. 183–215, http://www.oecd.org/sti/ind/1825894.pdf.
18 Multifactor productivity (MFP) data give a more comprehensive picture of productivity change over time, and they provide a decomposition of labor productivity change into sources of growth. However, because of the complexities associated with constructing MFP measures, these data are not available on a quarterly basis. BLS publishes MFP on major sectors and selected detailed industries on an annual basis. For more information, see https://www.bls.gov/mfp/.
19 See William Gullickson, “Measurement of productivity growth in U.S. manufacturing,” Monthly Labor Review, July 1995, pp.13–37, https://www.bls.gov/mfp/mprgul95.pdf.
20 For a complete discussion of the advantages and disadvantages of the two output concepts, see “Measuring productivity: measurement of aggregate and industry-level productivity growth,” OECD Manual (Paris: Organisation for Economic Co-operation and Development, 2001), chapter 3, pp. 23–38 https://www.oecd.org/std/productivity-stats/2352458.pdf.
21 Ibid., p. 28. If technical change within an industry does not affect all factors of production but operates primarily on the primary inputs, then the value-added approach is preferable.
22 Value-added labor productivity measures are generally less sensitive to outsourcing than are sectoral measures. But for multifactor productivity, sectoral measures are less sensitive to outsourcing than value-added measures are.
23 For more information on how imports affect productivity measures, see Lucy P. Eldridge and Michael J. Harper, “Effects of imported intermediate inputs on productivity,” Monthly Labor Review, June 2010, pp. 3–15, https://www.bls.gov/opub/mlr/2010/06/art1full.pdf.
24 Sectoral output measures for manufacturing industries are derived from BLS quarterly labor productivity data. Measures for nonmanufacturing industries were calculated for this study and may differ from annual BLS multifactor productivity because of data vintages.
25 See “NIPA Handbook: Concepts and methods of the U.S. national income and product accounts” (Bureau of Economic Analysis, February 2014), chapter 3, https://apps.bea.gov/national/pdf/NIPAhandbookch1-4.pdf.
26 “Annual benchmark report for services: fourth quarter 2003 to fourth quarter 2013” (U.S. Census Bureau, June 2014), https://www2.census.gov/services/qss/2013/benchmark_text-2013.pdf.
27 Annual SAS reports are available at the Census Bureau's "Service annual survey tables," https://www.census.gov/programs-surveys/sas/data/tables.html.
28 For more information on BEA data sources, see Strassner and Wasshausen, “New quarterly gross domestic product by industry statistics,” (BEA Briefing, May 2014), pp. 10–11, https://apps.bea.gov/scb/pdf/2014/05%20May/0514_gdp-by-industry.pdf.
29 BLS does produce quarterly hours for wage and salary workers on nonfarm payrolls for 14 major industry groups, available in tables at https://www.bls.gov/lpc/special_requests/tableb10.txt.
30 For more information on the CES, see Current Employment Statistics–CES (National)" (U.S. Bureau of Labor Statistics), https://www.bls.gov/ces/.
31 Seasonally adjusted three-digit CES data are used for nonmanufacturing industries, and two-digit data are used for durable and nondurable manufacturing. National Compensation Survey data are used at a slightly higher level of aggregation for nonmanufacturing. Employee data are then aggregated for the 20 industries of interest.
32 In goods-producing industries, workers are divided into production and nonproduction workers. Nonproduction workers include professional, specialty, and technical workers; executive, administrative, and managerial workers; sales workers; and administrative support workers, including clerical workers. In service-providing industries, workers are divided into supervisory and nonsupervisory workers. Supervisory workers include all executives and administrative and managerial workers. The CES program began collecting data on earnings and hours for all employees in September 2005. The BLS Productivity Program is currently evaluating whether to start using this new series.
33 Estimates of quarterly hours-worked-to-hours-paid ratios are derived from annual data at the three-digit industry level via a smoothing procedure. The BLS major sector productivity program makes use of ratios at a more aggregate level. For more information on the NCS, see "National Compensation Survey" (U.S. Bureau of Labor Statistics), https://www.bls.gov/ncs/.
34 To facilitate comparisons across various periods, quarterly estimates are expressed as annualized levels and quarterly growth rates are expressed as annual growth rates via the following formula:  .
.
35 See Lucy P. Eldridge, Marilyn E. Manser, and Phyllis Flohr Otto, “Alternative measures of supervisory employee hours and productivity growth,” Monthly Labor Review, vol. 127, no. 4, April 2004, pp. 9–28, https://www.bls.gov/opub/mlr/2004/04/art2full.pdf.
36 The X12-ARIMA program was developed by the U.S. Census Bureau. It is the same adjustment technique that CES employs to adjust employment and average weekly hours, and the same program used by Census and BEA to adjust output. Indirect seasonal adjustment (seasonally adjusting the components of the hours calculation rather than the final value) is preferred when component series are suspected of having distinct seasonal patterns. (See "X-13-ARIMA-SEATS Seasonal Adjustment Program" (U.S. Census Bureau), https://www.census.gov/data/software/x13as.html.) Given the limited observations for some industry groups, the CPS data are seasonally adjusted quarterly rather than monthly.
37 For this study, CPS ratios were constructed for 20 selected industry groups; BLS quarterly major-sector productivity measures use 14 industry categories, while annual labor productivity measures use ratios constructed at the three- and four-digit industry level. For more information on the CPS, see "Labor force statistics from the Current Population Survey" (U.S. Bureau of Labor Statistics), https://www.bls.gov/cps/.
38 The published quarterly labor productivity statistics aggregates employee hours for 14 major industry groups, then adds an aggregate value of hours worked for the self-employed and unpaid family workers. This aggregation is done because the major sector is the only series of interest.
39 Because the CES collects employment and average weekly hours only for the logging industry, nonfarm agricultural services employment data from the QCEW are combined with CES logging data to construct nonfarm employee hours. The data for constructing these estimates were released by the CES program in February 2015.
40 All series presented in this article were constructed by the authors. Differences between these data and the published BLS productivity statistics are a result of the difference in data vintage, as well as the adjustments made at different levels of industry aggregation.
41 See Joël Cariolle and Michaël Goujon, “Measuring macroeconomic instability: a critical survey illustrated with exports series,” Journal of Economic Surveys, vol. 29, no. 1, February 2015, pp. 1–26.
42 The authors explored different approaches for estimating the contributions to labor productivity growth, including those discussed in Evsey D. Domar, “On the measurement of technological change,” Economic Journal, December 1961, pp. 709–729, http://www.jstor.org/stable/2228246?seq=1#page_scan_tab_contents; and Marshal Reinsdorf and Robert Yuskavage, “Exact industry contributions to labor productivity change,” in Price and productivity measurement, vol. 6, chapter 5, (2010), http://www.indexmeasures.com/Vol6_10,09,26.pdf. Both approaches produce similar results. The authors used the Domar approach but scaled the contributions to the aggregate level in order to capture interactions between industries.