An official website of the United States government
An official website of the United States government
The .gov means it's official.
Federal government websites often end in .gov or .mil. Before sharing sensitive information,
make sure you're on a federal government site.
The site is secure.
The
https:// ensures that you are connecting to the official website and that any
information you provide is encrypted and transmitted securely.
U.S. employment is projected to increase 6.5 percent during the 2014–24 decade, from 150.5 million jobs in 2014 to 160.3 million jobs in 2024. The U.S. Bureau of Labor Statistics (BLS) Employment Projections program releases projections for 819 detailed occupations. Employment in 602 occupations is projected to increase, while employment in 217 occupations is projected to decline.
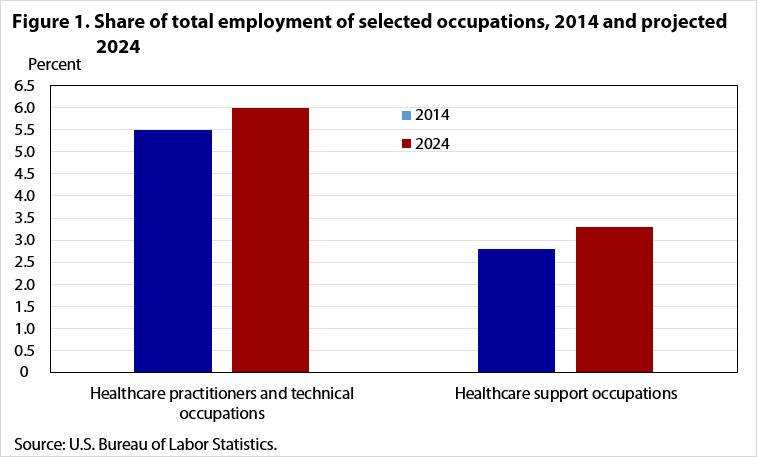
Healthcare support occupations and healthcare practitioners and technical occupations are projected to be the two fastest growing occupational groups, adding a combined 2.3 million jobs, about 1 in 4 new jobs. Figure 1 shows the share of total employment for these two groups in 2014 and projected 2024. The combined share of employment for these two groups is projected to increase from 8.3 percent of all jobs in 2014 to 9.2 percent of all jobs in 2024.
Only two major occupational groups are projected to see employment decline: production occupations and farming, fishing, and forestry occupations. Together, these two groups are projected to shed 339,300 jobs during the projection period.
BLS produces long-term occupational projections to provide career guidance for jobseekers, students, and current workers looking at changing occupations. In addition, policymakers and educational authorities use BLS employment projections for long-term policy planning. Individual states also derive their own state and local-area projections from the national employment projections.
This article provides a comprehensive overview of the occupational projections for 2014–24. It details the projections process and methodology and examines the projected changes to major occupational groups, with summary analysis behind each projection. In addition, it highlights the detailed occupations that are growing the fastest, adding the most jobs, declining most rapidly, or losing the most jobs.
More detailed analysis and descriptions of occupational projections can be found in the Occupational Outlook Handbook, a BLS career-guidance publication.1 In addition to describing why particular occupations are expected to grow or decline, the Handbook includes job descriptions, duties, median pay, and guidance on how to enter an occupation.
This article references projected growth rates through the use of a standard set of “growth adjectives.” These growth adjectives allow users to compare growth rates among different occupations. The growth adjectives used are as follows:
· Much faster than average: 13.5 percent or higher
· Faster than average: at least 8.5 percent but less than 13.5 percent
· As fast as average: at least 4.5 percent but less than 8.5 percent
· Slower than average: at least 1.5 percent but less than 4.5 percent
· Little or no change: at least –1.5 percent but less than 1.5 percent
· Decline: less than –1.5 percent
The BLS employment projections process consists of six interrelated steps, each of which is based on a different procedure or model and assumptions: labor force, aggregate economy, final demand (gross domestic product [GDP]) by consuming sector and by product, industry output, industry employment, and employment and openings by occupation.2
Labor force projections are the primary constraint on future economic growth in the BLS employment projections process, and demographic changes in the civilian noninstitutional population of the United States are important in determining the size of the future workforce. The population is getting older, with people ages 55 and older projected to increase their share of the civilian noninstitutional population from 34.2 percent in 2014 to 38.2 percent in 2024. Because older people are less likely to be in the labor force, labor force participation rates are projected to decrease from 62.9 percent to 60.9 percent between 2014 and 2024. The size of the labor force is projected to increase by only 7.8 million, or 5.0 percent, over the same decade.3
Declining labor force participation rates are expected to hinder economic growth between 2014 and 2024. Real GDP is projected to increase by 2.2 percent annually during this period. Although this increase is in line with GDP growth during the recent economic recovery from 2010 to 2014, the 10-year average growth for GDP exceeded 3.0 percent from the 1960s through most of the 2000s.4
Macroeconomic variables, such as labor force, GDP and its components, and labor productivity, coupled with individual industry projection models, determine projected industry output and employment.5 Projected staffing patterns (the distribution of employment by occupation within an industry) that BLS developed are then applied to projected wage and salary employment for each industry to determine projected employment for each occupation in the industry. Occupational employment data for self-employed workers are projected separately. Total projected occupational employment is the sum of the projected employment for each wage and salary industry and self-employed workers.
Projected rates of change and numeric change for occupations are calculated by comparing projected-year occupational employment with base-year occupational employment.
Two factors affect employment change in an occupation:
1. Changes in industry employment
2. Changes in the mix of occupations (staffing pattern) in an industry
When an industry grows or declines, the occupations within that industry typically follow suit. For example, all U.S. Postal Service mail carriers are employed in the Postal Service industry, which is projected to decline by 27.8 percent from 2014 to 2024. Because Postal Service mail carriers in the Postal Service are not expected to differ significantly in the future, their projected change in employment reflects the declining employment projected for the Postal Service industry: Postal Service mail carriers are projected to decline in employment by 26.2 percent between 2014 and 2024.
BLS economists use qualitative and quantitative analyses to project how staffing patterns are likely to change between the base year (2014) and the projected year (2024). They examine historical staffing pattern data,6 and they conduct research on factors that may affect the utilization of occupations within given industries during the projection period. Some factors that may affect an occupation’s staffing pattern include the following:
· Technology. Changes in technology, such as machines or software, can increase worker productivity so that the same amount of work requires fewer workers. Technology can also replace workers altogether. For example, advancements in surveying technology, such as robotic total stations, have increased the amount of work a surveyor or surveying technician can do, reducing the demand for surveying technicians.
· Replacement of one product or service for another. Changing consumer preferences for one product or service over another can affect which occupations are employed in an industry. For example, as demand for carpeting decreases because of the rising popularity of other types of flooring materials, demand for carpet installers will decrease in the construction industry.
· Outsourcing. Companies sometimes contract support functions to other companies instead of hiring their own workers. This practice can drive down use of those workers in the companies that outsource the work but may increase use in another industry if the work is being outsourced domestically. For example, many industries are expected to outsource human resources specialists to professional employer organizations—companies that provide human resources services to client businesses.
· Organizational/work restructuring. Any type of change in job duties that produces the same output may increase or decrease the utilization of some occupations relative to others. For example, some law firms are rethinking their project staffing and rebuilding their support staff by hiring paralegals, who may be given some of the administrative tasks previously assigned to legal secretaries.
These changes cause occupations to grow at different rates within a given industry. For example, employment in the local elementary and secondary schools industry is projected to increase by 4.8 percent, but cooks, institution and cafeteria in this industry are projected to decrease by 8.9 percent as more schools outsource their food services operations in the future. Conversely, employment of occupational therapists in local elementary and secondary schools is projected to grow by 16.5 between 2014 and 2024, faster than growth in the industry as a whole, because the share of children with illnesses and disorders that require the expertise of occupational therapists is expected to increase.
Education and training. BLS economists assign categories for typical education needed for entry, typical on-the-job training needed to attain competency in the occupation, and work experience in a related occupation to each detailed occupation in the National Employment Matrix. Assignments are based on analyses of qualitative and quantitative information.7
Occupation tables in this article include education category assignments for each occupation. Education assignments describe the typical level of education that most workers need to enter an occupation. The education categories BLS assigns to occupations are
· doctoral or professional degree;
· master’s degree;
· bachelor’s degree;
· associate’s degree;
· postsecondary nondegree award;
· some college, no degree;
· high school diploma or equivalent; and
· no formal educational credential.
Wage data. The wage data cited in this article are estimates of median annual wages in May 2014, as reported by the Occupational Employment Statistics (OES) survey. The median annual wage is the wage at which half of all workers earned more and half earned less. The median annual wage for all workers in May 2014 was $35,540. Median annual wages allow users to compare the earnings potential among occupations and occupational groups.
Replacement needs. In addition to employment growth, job openings arise when workers leave their occupation and need to be replaced, for reasons such as retirement or enrolling in school. Replacement needs exist independent of growth. Therefore, if an occupation is projected to gain 1,000 new jobs and 2,000 people who work in the occupation are expected to permanently leave it over the next 10 years, then the total number of projected job openings is 3,000.8
In most occupations, replacement needs provide more job openings than employment growth provides. Between 2014 and 2024, about 9.8 million new jobs are projected because of employment growth but 35.3 million openings are projected because of replacement needs.9
U.S. employment is projected to increase 6.5 percent during the 2014–24 decade, adding about 9.8 million new jobs. This growth rate assumes full-employment in the economy in 2024.
BLS categorizes occupations into 22 major groups, using the 2010 Standard Occupational Classification system.10 Occupations in each major group typically share similar duties or purposes; for example, protective service occupations include police officers, security guards, and correctional officers and jailers. Examining the growth of the major groups provides an overview of the key changes affecting employment in the projection period. Table 1 displays the projected employment change for all 22 major groups.
| 2014 National Employment Matrix title | Employment | Projected change, 2014–24 | Median annual wage, 2014(1) | |||
|---|---|---|---|---|---|---|
| 2014 | 2024 | Number | Percent | |||
| Total, all occupations | 00-0000 | 150,539.9 | 160,328.8 | 9,788.9 | 6.5 | $35,540 |
| Management occupations | 11-0000 | 9,157.5 | 9,662.9 | 505.4 | 5.5 | 97,230 |
| Business and financial operations occupations | 13-0000 | 7,565.3 | 8,197.8 | 632.4 | 8.4 | 64,790 |
| Computer and mathematical occupations | 15-0000 | 4,068.3 | 4,599.7 | 531.4 | 13.1 | 79,420 |
| Architecture and engineering occupations | 17-0000 | 2,532.7 | 2,599.9 | 67.2 | 2.7 | 75,780 |
| Life, physical, and social science occupations | 19-0000 | 1,310.4 | 1,408.0 | 97.6 | 7.4 | 61,450 |
| Community and social service occupations | 21-0000 | 2,465.7 | 2,723.4 | 257.7 | 10.5 | 41,290 |
| Legal occupations | 23-0000 | 1,268.2 | 1,332.8 | 64.6 | 5.1 | 76,860 |
| Education, training, and library occupations | 25-0000 | 9,216.1 | 9,913.7 | 697.6 | 7.6 | 46,660 |
| Arts, design, entertainment, sports, and media occupations | 27-0000 | 2,624.2 | 2,731.7 | 107.5 | 4.1 | 45,180 |
| Healthcare practitioners and technical occupations | 29-0000 | 8,236.5 | 9,584.6 | 1,348.1 | 16.4 | 61,710 |
| Healthcare support occupations | 31-0000 | 4,238.0 | 5,212.2 | 974.2 | 23.0 | 26,440 |
| Protective service occupations | 33-0000 | 3,443.8 | 3,597.7 | 153.9 | 4.5 | 37,180 |
| Food preparation and serving related occupations | 35-0000 | 12,467.6 | 13,280.4 | 812.9 | 6.5 | 19,130 |
| Building and grounds cleaning and maintenance occupations | 37-0000 | 5,617.2 | 5,967.0 | 349.8 | 6.2 | 23,270 |
| Personal care and service occupations | 39-0000 | 6,006.1 | 6,798.2 | 792.1 | 13.2 | 21,260 |
| Sales and related occupations | 41-0000 | 15,423.1 | 16,201.1 | 778.0 | 5.0 | 25,360 |
| Office and administrative support occupations | 43-0000 | 22,766.1 | 23,232.6 | 466.5 | 2.0 | 32,520 |
| Farming, fishing, and forestry occupations | 45-0000 | 972.1 | 914.9 | –57.2 | –5.9 | 20,250 |
| Construction and extraction occupations | 47-0000 | 6,501.7 | 7,160.7 | 659.0 | 10.1 | 41,380 |
| Installation, maintenance, and repair occupations | 49-0000 | 5,680.5 | 6,046.0 | 365.5 | 6.4 | 42,110 |
| Production occupations | 51-0000 | 9,230.3 | 8,948.3 | –282.1 | –3.1 | 31,720 |
| Transportation and material moving occupations | 53-0000 | 9,748.5 | 10,215.3 | 466.8 | 4.8 | 29,530 |
Notes: (1) Data are from the Occupational Employment Statistics program, U.S. Bureau of Labor Statistics. Notes: Differences may not sum correctly because of rounding. SOC = Standard Occupational Classification. Source: Employment Projections program, U.S. Bureau of Labor Statistics. | ||||||
Over the projection period, 20 of the 22 major occupational groups are projected to grow. However, production occupations are projected to decline 3.1 percent, and farming, fishing, and forestry occupations are projected to decline 5.9 percent.
Healthcare support occupations and healthcare practitioners and technical occupations are projected to add the most new jobs and be the fastest growing occupational groups. Healthcare practitioners is the only occupational group projected to add more than 1 million jobs. Job growth in both the third fastest growing occupational group, personal care and service occupations, and the fifth fastest growing group, community and social service occupations, should also be driven by demand for healthcare. The majority of new jobs in both of these major occupational groups are projected to be in the healthcare and social assistance industry.
The country’s demographics are skewing toward an older population, with 38.2 percent of the civilian noninstitutional population projected to be age 55 or older in 2024 compared with 34.2 percent in 2014. Demand for healthcare will increase as the share of the population over the age of 55 grows, because older people typically have greater healthcare needs. Also, the number of individuals who have access to health insurance is expected to continue to increase because of federal health insurance reform, which should lead to additional job growth.
In addition to adding the most jobs of all the major groups (1.3 million), the healthcare practitioners and technical occupations group had a median annual wage of $61,710 in May 2014, which is much higher than the median wage for all occupations of $35,540. Conversely, healthcare support occupations are projected to add the second most new jobs (974,200) of any occupational group but had an annual median wage of $26,440 in 2014, which is lower than the national median. Higher wages for healthcare practitioners and technical occupations reflect the higher levels of education and training typically needed to work in those occupations compared with healthcare support occupations.
This section highlights each of the 22 major occupational groups defined in the 2010 Standard Occupational Classification (SOC) system. They are discussed in the order they appear in the SOC and in table 1. For each group that is projected to grow, an in-text tabulation describes the detailed occupations (within the major group) that are projected to add the most new jobs and grow the fastest. The tabulation also describes the occupations that had the highest median annual wage in May 2014. For groups with declining employment, the fastest declining occupation and the occupation projected to lose the most jobs are included in the in-text tabulations instead of the occupations projected to grow the fastest or to add the most new jobs.
Management occupations. The in-text tabulation below describes the detailed occupations (within the major group) that are projected to add the most new jobs and grow the fastest. The tabulation also describes the occupations that had the highest median annual wage in May 2014.
| Category | Occupation | Projection |
| Most new jobs | General and operations managers | 151,100 |
| Fastest growing (in percent) | Medical and health services managers | 16.9 |
| Highest paying | Chief executives | $173,320 |
Employment in management occupations is projected to increase by 5.5 percent, about as fast as the average for all occupations, adding 505,400 new jobs between 2014 and 2024. The effect of healthcare-related industry growth affects almost every major occupational group. Medical and health services managers is projected to be the fastest growing management occupation, with a projected growth rate of 16.9 percent resulting in 56,300 new jobs. However, the occupation adding the most new jobs is general and operations managers, which is projected to add 151,100 new jobs from 2014 to 2024. Employment growth of general and operations managers will be driven by the formation of new organizations and expansion of existing ones. The developments will require more workers to manage these operations.
In contrast to the robust healthcare-related industry and occupational growth, the projected decline for the manufacturing industries results in an employment loss among industrial production managers of 3.7 percent, a decline of 6,300 jobs.
Of all the major occupational groups, the management occupations group was the highest paid, with a median annual wage of $97,230 in May 2014. This amount far exceeded the national median of $35,540. A bachelor’s degree combined with multiple years of work-related experience is typically needed for entry into almost all jobs in management occupations.
Business and financial operations occupations. The in-text tabulation below describes the detailed occupations (within the major group) that are projected to add the most new jobs and grow the fastest. The tabulation also describes the occupations that had the highest median annual wage in May 2014.
| Category | Occupation | Projection |
| Most new jobs | Accountants and auditors | 142,400 |
| Fastest growing (in percent) | Personal financial advisors | 29.6 |
| Highest paying | Personal financial advisors | $81,060 |
Employment in business and financial operations occupations is projected to grow 8.4 percent from 2014 to 2024, as fast as the average for all occupations, adding 632,400 new jobs. Accountants and auditors are projected to add the most new jobs (142,400) of all the business and financial operations occupations. As the economy grows, more accountants and auditors will be needed to prepare and examine financial records.
Personal financial advisors have the highest projected growth rate within this major group at 29.6 percent. An aging population is expected to boost demand for personal financial advisors, as more people reach retirement age and look for help in securing their financial well-being. Personal financial advisors are also the highest paid occupation within the business and financial operations group, with a median wage of $81,060 in May 2014. This wage was much higher than the national average of $35,540 and higher than the major group median of $64,790.
The majority of business and financial operations occupations typically require a bachelor’s degree for entry-level positions. However, further credentials in the form of a master’s degree or certification, such as a Certified Financial Planner or Certified Public Accountant, can boost jobs prospects and advancement potential.
Computer and mathematical occupations. The in-text tabulation below describes the detailed occupations (within the major group) that are projected to add the most new jobs and grow the fastest. The tabulation also describes the occupations that had the highest median annual wage in May 2014.
| Category | Occupation | Projection |
| Most new jobs | Software developers, applications | 135,300 |
| Fastest growing (in percent) | Statisticians | 33.8 |
| Highest paying | Computer and information research scientists | $108,360 |
Computer and mathematical occupations is the fourth fastest growing major occupational group. Employment is projected to increase 13.1 percent, adding 531,400 new jobs between 2014 and 2024. Several factors are contributing to the projected growth for the computer and mathematical occupations, including a greater emphasis on cloud computing, the collection and storage of big data, more everyday items becoming connected to the Internet, and the continued demand for mobile computing.
The growth rates for the majority of computer and mathematical occupations are faster than the national average of 6.5 percent. However, because the nature of their work, which can easily be outsourced to programmers in low-wage countries, employment of computer programmers is projected to decline 8.0 percent.
As businesses and government agencies continue to emphasize the use of big data, the demand for mathematical occupations continues to rise. Statisticians and operations research analysts are two of the fastest growing occupations, with projected growth rates of 33.8 percent and 30.2 percent, respectively.
The computer and mathematical occupations not only have fast projected growth rates but also are among the highest paid, with a median annual wage of $79,420 in 2014. Most computer occupations typically require a bachelor’s degree for entry-level jobs, while some mathematical occupations, such as statisticians and mathematicians, typically require a master’s degree.
Architecture and engineering occupations. The in-text tabulation below describes the detailed occupations (within the major group) that are projected to add the most new jobs and grow the fastest. The tabulation also describes the occupations that had the highest median annual wage in May 2014.
| Category | Occupation | Projection |
| Most new jobs | Civil engineers | 23,600 |
| Fastest growing (in percent) | Cartographers and photogrammetrists | 29.3 |
| Highest paying | Petroleum engineers | $130,050 |
Employment in architecture and engineering occupations is projected to increase 2.7 percent, adding 67,200 new jobs between 2014 and 2024. The growth rate is slower than average for all occupations, in part because several drafting and technician occupations in the group are projected to decline between 2014 and 2024 as improvements in technology, such as design software and surveying equipment, increase worker productivity.
Civil engineers are projected to add the most jobs among architecture and engineering occupations because they will be needed to design projects that improve and maintain America’s infrastructure. Cartographers and photogrammetrists is projected to be the fastest growing architecture and engineering occupation because of higher demand for maps and other geospatial information.
The median wage for architecture and engineering occupations was $75,780 in May 2014, and all occupations in this group made more than the median wage for all occupations in the economy, which was $35,540.
A bachelor’s degree is typically needed for entry-level jobs in most detailed architecture and engineering occupations. Drafters and engineering technicians need an associate’s degree for entry. Surveying and mapping technicians have the lowest typical entry-level education, a high school diploma, or equivalent, of any occupation in the group.
Life, physical, and social science occupations. The in-text tabulation below describes the detailed occupations (within the major group) that are projected to add the most new jobs and grow the fastest. The tabulation also describes the occupations that had the highest median annual wage in May 2014.
| Category | Occupation | Projection |
| Most new jobs | Clinical, counseling, and school psychologists | 30,500 |
| Fastest growing (in percent) | Forensic science technicians | 26.6 |
| Highest paying | Physicists | $109,600 |
Employment in life, physical, and social science occupations is projected to increase 7.4 percent, as fast as average, from 1.3 million jobs in 2014 to 1.4 million jobs in 2024. Growth rates vary by scientific discipline within the group. Employment of scientists in physical sciences and in life sciences is projected to grow about as fast as average, 6.7 percent and 6.1 percent respectively, but employment of social scientists is projected to increase by 12.2 percent, which is faster than the national average. Most of the growth in social scientists employment will be for clinical, counseling, and school psychologists. This growth is due to greater demand for psychological services in schools, hospitals, mental health centers, and social services agencies. Employment of technicians in life, physical, and social sciences is projected to grow 5.3 percent, about as fast as average.
The median annual wage for life, physical, and social science occupations was $61,450 in May 2014, which is higher than the median wage for all occupations. All occupations in this group have typical entry-level education that includes some form of postsecondary education. An associate’s degree is needed for most science technician occupations. The typical entry-level education for scientist occupations varies, but none is below a bachelor’s degree. Most scientist occupations had a higher median wage than technician occupations, commensurate with the higher educational requirements needed to work as a scientist.
Community and social service occupations. The in-text tabulation below describes the detailed occupations (within the major group) that are projected to add the most new jobs and grow the fastest. The tabulation also describes the occupations that had the highest median annual wage in May 2014.
| Category | Occupation | Projection |
| Most new jobs | Social and human service assistants | 44,200 |
| Fastest growing (in percent) | Substance abuse and behavioral disorder counselors | 22.3 |
| Highest paying | Social workers, all other | $59,100 |
Community and social service occupations include social workers, counselors, and religious workers. Employment is projected to grow 10.5 percent, faster than the average for all occupations, adding 257,700 jobs. Most new jobs in this occupational group will be in the healthcare and social assistance industry.
The median annual wage for community and social service occupations was $41,290, more than the national median of $35,540. Sixteen of eighteen occupations in this group typically need either a bachelor’s degree or a master’s degree for entry. The exceptions are social and human service assistants (the occupation projected to add the most new jobs in the group) and community health workers, both of which have typical entry-level education of a high school diploma or equivalent. The median annual wage for both of these occupations was below the average median for all occupations in the economy.
Legal occupations. The in-text tabulation below describes the detailed occupations (within the major group) that are projected to add the most new jobs and grow the fastest. The tabulation also describes the occupations that had the highest median annual wage in May 2014.
| Category | Occupation | Projection |
| Most new jobs | Lawyers | 43,800 |
| Fastest growing (in percent) | Arbitrators, mediators, and conciliators | 9.2 |
| Highest paying | Judges, magistrate judges, and magistrates | $115,140 |
Employment in legal occupations is projected to increase 5.1 percent, about as fast as average, and add 64,600 new jobs from 2014 to 2024. Lawyers are projected to add the most new jobs because demand for legal work is expected to continue as individuals, businesses, and all levels of government require legal service in many areas.
Employment of arbitrators, mediators, and conciliators is projected to grow 9.2 percent, which is the fastest growth rate among all the legal occupations. The high costs associated with bringing a civil court case to trial are increasing demand for arbitrators, mediators, and conciliators to help settle disputes out of court.
The median annual wage for legal occupations was $76,860 in May 2014, exceeding the national median. A law degree typically is needed to become a lawyer or judge. Paralegals and legal assistants can usually find entry-level positions with an associate’s degree, whereas arbitrators, mediators, and conciliators typically need a bachelor’s degree.
Education, training, and library occupations. The in-text tabulation below describes the detailed occupations (within the major group) that are projected to add the most new jobs and grow the fastest. The tabulation also describes the occupations that had the highest median annual wage in May 2014.
| Category | Occupation | Projection |
| Most new jobs | Teacher assistants | 78,600 |
| Fastest growing (in percent) | Law teachers, postsecondary | 21.7 |
| Highest paying | Law teachers, postsecondary | $109,980 |
Employment in education, training, and library occupations is projected to increase 7.6 percent, about as fast as the average for all occupations. A total of 697,600 new jobs is projected to be added from 2014 to 2024. Growth in education, training, and library occupations is influenced by school enrollments and budgets.
Enrollment in postsecondary education is expected to increase, which should positively affect the demand for postsecondary teachers. Despite rising tuition costs, enrollment in postsecondary schools is projected to rise because of the potential access to higher salary occupations available to graduates compared with the occupations available to those with only a high school diploma or equivalent.
Because of the rapid growth of the healthcare industry, more postsecondary healthcare teachers will be needed to train healthcare workers. As a result, postsecondary nursing instructors and teachers is one of the fastest growing occupations in this group, with a projected growth rate of 19.3 percent.
The median annual wage for education, training, and library occupations was $46,660 in May 2014. The median wage for postsecondary teachers was higher than the wage for elementary or secondary teachers. In addition, a doctoral degree typically is needed for postsecondary teacher positions and a bachelor’s degree is needed for most elementary and secondary teaching positions.
Arts, design, entertainment, sports, and media occupations. The in-text tabulation below describes the detailed occupations (within the major group) that are projected to add the most new job and grow the fastest. The tabulation also describes the occupations that had the highest median annual wage in May 2014.
| Category | Occupation | Projection |
| Most new jobs | Interpreters and translators | 17,500 |
| Fastest growing (in percent) | Interpreters and translators | 28.7 |
| Highest paying | Art directors | $85,610 |
Employment in arts, design, entertainment, sports, and media occupations is projected to increase 4.1 percent and add 107,500 new jobs from 2014 to 2024. Interpreters and translators is projected to add the most new jobs and is also the fastest growing occupation within this group. The increased demand for interpreters and translators coincides with the projected changes in national demographics. As the population of non-English-speaking residents continues to grow, more interpreters and translators will be needed to help provide translation services, such as explaining medical procedures.
The median wage for arts, design, entertainment, sports, and media occupations was $45,180, which was above the median wage for all occupations of $35,540. Typical entry-level education requirements vary within this major group. Of the 41 detailed occupations, typically, 22 need a bachelor’s degree for entry, 9 need a high school diploma or equivalent, 6 do not need any formal educational credentials, 2 need postsecondary nondegree awards, 1 needs some college, and another 1 needs an associate’s degree.
Healthcare practitioners and technical occupations. The in-text tabulation below describes the detailed occupations (within the major group) that are projected to add the most new jobs and grow the fastest. The tabulation also describes the occupations that had the highest median annual wage in May 2014.
| Category | Occupation | Projection |
| Most new jobs | Registered nurses | 439,300 |
| Fastest growing (in percent) | Nurse practitioners | 35.2 |
| Highest paying: | Oral and maxillofacial surgeons; | Greater than or equal to $187,200 |
| Orthodontists; | ||
| Surgeons; | ||
| Anesthesiologists; | ||
| Internists, general; | ||
| Obstetricians and gynecologists; | ||
| Physicians and surgeons, all other |
The healthcare practitioners and technical occupations group is projected to add 1.3 million jobs between 2014 and 2024, the most new jobs of any group. Employment is projected to grow 16.4 percent, much faster than the average of 6.5 percent growth for all occupations. More workers will be needed to help an aging population stay healthy and active. In addition, the number of individuals who have access to health insurance is expected to continue to increase because of federal health insurance reform, which will increase demand for healthcare occupations. The registered nurses occupation, the largest in the group and fifth largest overall, is projected to add 439,300 jobs, or roughly the same number of new jobs that all office and administrative support occupations (the largest major group) is projected to add.
Although nearly all healthcare occupations are projected to grow, specific growth rates will vary because of changes in the delivery of care. Nurse practitioners (35.2 percent) and physician assistants (30.4 percent) are projected to be two of the fastest growing occupations in the group because they are more cost effective than physicians in providing routine and preventative care.
The median annual wage for healthcare practitioners and technical occupations was $61,710 in May 2014, higher than the median for all occupations in the economy. Some form of postsecondary education is needed for entry-level positions in most occupations in this group, and occupations with higher levels of typical entry-level education usually pay more. Several types of physicians and surgeons and dentists had median annual wages greater than or equal to $187,200 in May 2014, making them the highest paying occupations in the economy. Nearly all physicians and surgeons and dentists need doctoral degrees and extensive training through internship or residency programs.
Healthcare support occupations. The in-text tabulation below describes the detailed occupations (within the major group) that are projected to add the most new jobs and grow the fastest. The tabulation also describes the occupations that had the highest median annual wage in May 2014.
| Category | Occupation | Projection |
| Most new jobs | Home health aides | 348,400 |
| Fastest growing (in percent) | Occupational therapy assistants | 42.7 |
| Highest paying | Occupational therapy assistants | $56,950 |
Healthcare support occupations is the fastest growing major occupational group in the economy. Employment is projected to increase 23.0 percent, adding 974,200 jobs between 2014 and 2024. Healthcare support workers will be needed to assist a growing number of older Americans and those with chronic conditions such as diabetes. Many of the fastest growing occupations in healthcare support, such as occupational therapy assistants and aides and physical therapist assistants and aides, work closely with patients to help them maintain or improve their quality of life. Large growth is projected for home health aides because they will be needed to provide in-home healthcare and assistance to an aging population.
Healthcare support occupations had a median annual wage of $26,440 in May 2014, lower than the median for all occupations in the economy. The most common level of education typically needed for entry into healthcare support occupations is either a postsecondary nondegree award or a high school diploma or equivalent.
Protective service occupations. The in-text tabulation below describes the detailed occupations (within the major group) that are projected to add the most new jobs and grow the fastest. The tabulation also describes the occupations that had the highest median annual wage in May 2014.
| Category | Occupation | Projection |
| Most new jobs | Security guards | 55,500 |
| Fastest growing (in percent) | Forest fire inspectors and prevention specialists | 13.1 |
| Highest paying | First-line supervisors of police and detectives | $80,930 |
Employment in protective service occupations is projected to grow 4.5 percent, slower than average for all occupations, increasing from 3.4 million to 3.6 million jobs during the projection period. In the occupational group, 4 in 5 new jobs are expected to be in four occupations: security guards, police and sheriff’s patrol officers, firefighters, and correctional officers and jailers. Of these four occupations, only security guards ($24,410) earned less than the median wage for all occupations in the economy of $35,540. Altogether, protective service occupations had a median annual wage of $37,180 in May 2014. Typical entry-level education for most protective service occupations is a high school diploma or equivalent, and workers typically receive on-the-job training in most occupations.
Food preparation and serving related occupations. The in-text tabulation below describes the detailed occupations (within the major group) that are projected to add the most new jobs and grow the fastest. The tabulation also describes the occupations that had the highest median annual wage in May 2014.
| Category | Occupation | Projection |
| Most new jobs | Combined food preparation and serving workers, including fast food | 343,500 |
| Fastest growing (in percent) | Cooks, restaurant | 14.3 |
| Highest paying | Chefs and head cooks | $41,610 |
Employment in food preparation and serving related occupations is projected to increase 6.5 percent, as fast as average, from 12.5 million jobs in 2014 to 13.3 million jobs in 2024. Food preparation and serving related workers are projected to add the third most jobs of any occupational group and the most of any group not related to healthcare. Population growth will increase demand for food preparation and serving related occupations because more people are expected to dine out in the future. Over half of new jobs in the group will be for either cooks, restaurant; or combined food preparation and serving workers, including fast food.
Food preparation and serving related occupations is the lowest paid major group, with a median annual wage of $19,130 in May 2014. Chefs and head cooks is the only occupation to have a median annual wage above the national median of $35,540. Combined food preparation and serving workers, including fast food, which is projected to add the most jobs of any food preparation and serving related occupation, has the lowest wage of any occupation in the group, with a median annual wage of $18,410. No formal educational credential is needed for entry-level jobs in most food preparation and serving related occupations.
Building and grounds cleaning and maintenance occupations. The in-text tabulation below describes the detailed occupations (within the major group) that are projected to add the most new jobs and grow the fastest. The tabulation also describes the occupations that had the highest median annual wage in May 2014.
| Category | Occupation | Projection |
| Most new jobs | Janitors and cleaners, except maids and housekeeping cleaners | 136,300 |
| Fastest growing (in percent) | Maids and housekeeping cleaners | 7.7 |
| Highest paying | First-line supervisors of landscaping, lawn service, and groundskeeping workers | $43,160 |
Employment in building and grounds cleaning and maintenance occupations is projected to increase 6.2 percent between 2014 and 2024, adding 349,800 new jobs. More workers will be needed to keep up with increasing demand for lawn care, landscaping, and cleaning services from large institutions, including universities and corporate campuses. Many aging or busy homeowners are likely to require these services, to help maintain their properties. Three occupations are projected to account for the majority of job growth in this major group: janitors and cleaners (136,300 jobs), maids and housekeeping cleaners (111,700 jobs), and landscaping and groundskeeping workers (71,700 jobs).
The median annual wage for building and grounds cleaning and maintenance occupations was $23,270 in May 2014, which is below the national median of $35,540. Many of the occupations within this group do not require a formal education credential, but a high school diploma or equivalent is needed for entry in higher paying building and grounds cleaning and maintenance. For example, a high school diploma is typically needed to become a first-line supervisor of landscaping, lawn service, and groundskeeping workers, which has the highest median annual salary of this occupational group at $43,160.
Personal care and service occupations. The in-text tabulation below describes the detailed occupations (within the major group) that are projected to add the most new jobs and grow the fastest. The tabulation also describes the occupations that had the highest median annual wage in May 2014.
| Category | Occupation | Projection |
| Most new jobs | Personal care aides | 458,100 |
| Fastest growing (in percent) | Personal care aides | 25.9 |
| Highest paying | Gaming supervisors | $49,420 |
Employment in personal care and service occupations is projected to increase 13.2 percent, faster than the average for all occupations, adding 792,100 jobs during the projection period. Most new jobs will be in the healthcare and social assistance industry. Personal care aides are the fastest growing occupation within this major group and are projected to add the most new jobs of any occupation to the economy as a whole. Personal care aides assist clients with daily-living activities, and demand for the services of these workers will grow as the elderly population increases. In personal care and service occupations, 6 in 10 new jobs are expected to be for personal care aides.
In May 2014, workers in personal care and service occupations had a median wage of $21,260, which is less than the median for all occupations. Most personal care and service occupations do not have typical entry-level education beyond a high school diploma or equivalent. However, a postsecondary nondegree award is typically needed for entry into the following occupations: barbers; hairdressers, hairstylists and cosmetologists; skincare specialists; manicurists and pedicurists; makeup artists, theatrical and performance; and embalmers. Morticians, undertakers, and funeral directors typically need an associate’s degree.
Sales and related occupations. The in-text tabulation below describes the detailed occupations (within the major group) that are projected to add the most new jobs and grow the fastest. The tabulation also describes the occupations that had the highest median annual wage in May 2014.
| Category | Occupation | Projection |
| Most new jobs | Retail salespersons | 314,200 |
| Fastest growing (in percent) | Sales and related workers, all other | 10.7 |
| Highest paying | Sales engineers | $96,340 |
From 2014 to 2024, employment in sales and related occupations is projected to increase 5.0 percent, about as fast as average, adding 778,000 new jobs. The detailed occupations that compose this major group have diverse growth rates. Of the 22 detailed occupations that make up the group, 4 are projected to decline, 2 to show little or no change, 5 to grow slower than average, 7 to grow as fast as average, and 4 to grow faster than average.
Retail salespersons is projected to be one of the occupations with the most job growth, adding 314,200 new jobs. To compete with e-commerce, retail stores are expected to focus on customer service, which is expected increase employment for salespersons. The median annual wage for retail salespersons of $21,390 is well below the national median of $35,540 in May 2014. The overall median wage for sales and related occupations was $25,360.
Similar to the diverse growth rates for this group, the educational requirements are also varied. Of the 22 detailed occupations that make up this group, typically, 12 require a high school diploma or equivalent, 7 require no formal educational credential, and 3 require a bachelor’s degree for entry.
Office and administrative support occupations. The in-text tabulation below describes the detailed occupations (within the major group) that are projected to add the most new jobs and grow the fastest. The tabulation also describes the occupations that had the highest median annual wage in May 2014.
| Category | Occupation | Projection |
| Most new jobs | Customer service representatives | 252,900 |
| Fastest growing (in percent) | Medical secretaries | 20.5 |
| Highest paying | Postal Service mail carriers | $57,200 |
Employment of office and administrative support occupations is projected to increase 2.0 percent, slower than average for all occupations. Technology is expected to supplant some functions that workers in office and administrative support occupations do. For example, file clerks no longer need to file paper documents manually because more documents are saved electronically. In addition, the office and administrative support occupations group includes U.S. Postal Service workers, which are projected lose employment.
However, the healthcare industry will fuel some employment growth in this major group because more workers will be needed to handle administrative tasks related to billing and insurance processing. Medical secretaries are projected to be the fastest growing occupation in this group, increasing 20.5 percent and adding 108,200 new jobs.
The median annual wage for office and administrative support occupations was $32,520 in May 2014. The majority of occupations included in this group typically need a high school diploma or equivalent for entry-level positions. Only two occupations, statistical assistants and proofreaders and copy markers, typically need a bachelor’s degree.
Farming, fishing, and forestry occupations. The in-text tabulation below describes the detailed occupations (within the major group) that are projected to lose the most jobs and decline the fastest. The tabulation also describes the occupations that had the highest median annual wage in May 2014.
| Category | Occupation | Projection |
| Most job losses | Farmworkers and laborers, crop, nursery, and greenhouse | –42,900 |
| Fastest declining (in percent) | Fallers | –17.2 |
| Highest paying | First-line supervisors of farming, fishing, and forestry workers | $44,880 |
The fastest declining occupations group is farming, fishing, and forestry, with employment projected to decrease 5.9 percent between 2014 and 2024. Employment is projected to decline from 972,100 to 914,900, a loss of 57,200 jobs. Rising costs have led to consolidation in the agriculture industry, and this trend is expected to continue. In addition, productivity-enhancing technologies, such as improved herbicides and better equipment, enable firms to increase output while decreasing employment. For example, employment of fallers is projected to decline 17.2 percent because of the increased use of heavy equipment in harvesting timber.
Some farming, fishing, and forestry occupations are projected to grow while the group as a whole is projected to decline. The most growth will be for agricultural equipment operators, which is projected to add 3,100 new jobs. These workers operate productivity-enhancing equipment that is replacing other types of agricultural workers.
Farming, fishing, and forestry occupations was one of the lowest paying groups, with a median annual wage of $20,250 in May 2014. Only one farming, fishing, and forestry occupation has typical entry-level education beyond a high school diploma: agricultural inspectors typically need a bachelor’s degree. Most entry-level workers in farming, fishing, and forestry occupations receive either short-term or moderate-term on-the-job training.
Construction and extraction occupations. The in-text tabulation below describes the detailed occupations (within the major group) that are projected to add the most new jobs and grow the fastest. The tabulation also describes the occupations that had the highest median annual wage in May 2014.
| Category | Occupation | Projection |
| Most new jobs | Construction laborers | 147,400 |
| Fastest growing (in percent) | Solar photovoltaic installers | 24.3 |
| Highest paying | Elevator installers and repairers | $78,620 |
Employment in construction and extraction occupations is projected to grow 10.1 percent, faster than the average for all occupations, increasing from 6.5 million jobs in 2014 to 7.2 million jobs in 2024. Overall growth in the economy and population will increase demand for new buildings, roads, and other structures, which will create new job openings for construction and extraction occupations. Solar photovoltaic installers, the fastest growing occupation in the group, will see demand for their services increase as the cost of solar panels declines and solar power becomes a cost-effective alternative to other energy sources.
Postsecondary education typically is not needed for entry in any construction and extraction occupation. Workers in construction and extraction occupations typically receive some form of on-the-job training, and generally, occupations that have more extensive training pay higher wages. For example, construction laborers who receive short-term on-the-job training had a median annual wage of $31,090 in May 2014, but electricians who undergo an apprenticeship earned $51,110. The median annual wage of all construction and extraction occupations was $41,380 in May 2014, higher than the national median of $35,540.
Installation, maintenance, and repair occupations. The in-text tabulation below describes the detailed occupations (within the major group) that are projected to add the most new jobs and grow the fastest. The tabulation also describes the occupations that had the highest median annual wage in May 2014.
| Category | Occupation | Projection |
| Most new jobs | Maintenance and repair workers, general | 83,500 |
| Fastest growing (in percent) | Wind turbine service technicians | 108.0 |
| Highest paying | Electrical and electronics repairers, powerhouse, substation, and relay | $71,400 |
Employment in installation, maintenance, and repair occupations is projected to increase 6.4 percent, about as fast as the national growth rate, and add 365,500 new jobs from 2014 to 2024. The overall fastest growing occupation, wind turbine service technicians, is included in this major group and employment is projected to increase 108.0 percent. However, few people are employed as wind turbine service technicians, and even with the fast projected growth rate, the occupation is projected to add only 4,800 new jobs, increasing from 4,400 in 2014 to 9,200 in 2024. In contrast, maintenance and repair workers, general, is projected to increase 6.1 percent but add 83,500 new jobs.
The median annual wage for installation, maintenance, and repair occupations was $42,110 in May 2014. A high school diploma or equivalent is typically required to enter most installation, maintenance, and repair occupations. However, a number of occupations in this group typically need higher education than in the past. For example, a postsecondary nondegree award is typically needed to become an automotive service technician or mechanic because today’s automotive engines and components have greater electronic and mechanical complexity.
Production occupations. The in-text tabulation below describes the detailed occupations (within the major group) that are projected to lose the most jobs and decline the fastest. The tabulation also describes the occupations that had the highest median annual wage in May 2014.
| Category | Occupation | Projection |
| Most job losses | Sewing machine operators | –41,700 |
| Fastest declining (in percent) | Photographic process workers and processing machine operators | –32.9 |
| Highest paying | Nuclear power reactor operators | $82,500 |
The production occupations group is one of two major occupational groups that is projected to decline (farming, fishing, and forestry occupations group is the other). Employment is projected to decline 3.1 percent, with a loss of 282,100 jobs from 2014 to 2024. Technological advancements are replacing many of the manufacturing workers who make up a large share of the production occupations. Fewer workers are needed in the manufacturing sector because many processes have become computer controlled. For this reason, employment of computer-controlled machine tool operators, metal and plastic, is projected to increase 17.5 percent and grow by 26,000 jobs.
The median annual wage for production occupations in May 2014 was $31,720. Many occupations related to power generation had a higher median annual salary than the national average and production occupations as a whole. Nuclear power reactor operators, power distributors and dispatchers, and power plant operators had median wages of $82,500, $78,240, and $70,070, respectively. A high school diploma or equivalent is typically required for entry into all three occupations.
Transportation and material moving occupations.
The in-text tabulation below describes the detailed occupations (within the major group) that are projected to add the most new jobs and grow the fastest. The tabulation also describes the occupations that had the highest median annual wage in May 2014.
| Category | Occupation | Projection |
| Most new jobs | Laborers and freight, stock and material movers, hand | 125,100 |
| Fastest growing (in percent) | Ambulance drivers and attendants, except emergency medical technicians | 33.0 |
| Highest paying | Air traffic controllers | $122,340 |
The transportation and material moving occupations group is projected to increase 4.8 percent from 2014 to 2024, adding 466,800 new jobs. An increased demand for shipping raw materials and finished products over highways, rail lines, and waterways should contribute to employment growth. However, technology and automation in warehousing enable better tracking and movement of items, which may supplant some functions of workers who move freight or stock.
The median annual wage for transportation and material moving occupations was $29,530 in May 2014, below the median for all occupations of $35,540. However, several occupations had median wages that were much higher than the national median. For example, air traffic controllers and airline pilots, copilots, and flight engineers had a median annual wage of $122,340 and $118,140, respectively, in May 2014.
Table 2 lists the 15 fastest growing occupations in the 2014–24 employment projections. Of the 15 fastest growing occupations, 11 need some level of postsecondary education for entry. Each of these 11 occupations had a median wage above the annual median wage for all occupations (May 2014). The four occupations in table 2 that have typical entry-level education at or below a high school diploma or equivalent each had a median wage below the median for all occupations.
| 2014 National Employment Matrix title | Employment | Projected change, 2014–24 | Median annual wage, 2014(1) | Typical education needed for entry | |||
|---|---|---|---|---|---|---|---|
| 2014 | 2024 | Number | Percent | ||||
| Total, all occupations | 00-0000 | 150,539.90 | 160,328.80 | 9,788.9 | 6.5 | $35,540 | — |
| Wind turbine service technicians | 49-9081 | 4.4 | 9.2 | 4.8 | 108.0 | 48,800 | Some college, no degree |
| Occupational therapy assistants | 31-2011 | 33.0 | 47.1 | 14.1 | 42.7 | 56,950 | Associate’s degree |
| Physical therapist assistants | 31-2021 | 78.7 | 110.7 | 31.9 | 40.6 | 54,410 | Associate’s degree |
| Physical therapist aides | 31-2022 | 50.0 | 69.5 | 19.5 | 39.0 | 24,650 | High school diploma or equivalent |
| Home health aides | 31-1011 | 913.5 | 1,261.9 | 348.4 | 38.1 | 21,380 | No formal educational credential |
| Commercial divers | 49-9092 | 4.4 | 6.0 | 1.6 | 36.9 | 45,890 | Postsecondary nondegree award |
| Nurse practitioners | 29-1171 | 126.9 | 171.7 | 44.7 | 35.2 | 95,350 | Master’s degree |
| Physical therapists | 29-1123 | 210.9 | 282.7 | 71.8 | 34.0 | 82,390 | Doctoral or professional degree |
| Statisticians | 15-2041 | 30.0 | 40.1 | 10.1 | 33.8 | 79,990 | Master’s degree |
| Ambulance drivers and attendants, except emergency medical technicians | 53-3011 | 19.6 | 26.1 | 6.5 | 33.0 | 24,080 | High school diploma or equivalent |
| Occupational therapy aides | 31-2012 | 8.8 | 11.6 | 2.7 | 30.6 | 26,550 | High school diploma or equivalent |
| Physician assistants | 29-1071 | 94.4 | 123.2 | 28.7 | 30.4 | 95,820 | Master’s degree |
| Operations research analysts | 15-2031 | 91.3 | 118.9 | 27.6 | 30.2 | 76,660 | Bachelor’s degree |
| Personal financial advisors | 13-2052 | 249.4 | 323.2 | 73.9 | 29.6 | 81,060 | Bachelor’s degree |
| Cartographers and photogrammetrists | 17-1021 | 12.3 | 15.9 | 3.6 | 29.3 | 60,930 | Bachelor’s degree |
Notes: (1) Data are from the Occupational Employment Statistics program, U.S. Bureau of Labor Statistics. Note: SOC = Standard Occupational Classification. Source: Employment Projections program, U.S. Bureau of Labor Statistics. | |||||||
The fastest growing occupation is wind turbine service technicians, which is projected to grow 108.0 percent, almost 17 times the national average. Growing demand for wind power as a clean and cost-effective alternative to traditional types of power generation, such as fossil fuels, will increase demand for this occupation, as will the maintenance needs of the numerous wind turbines constructed in recent years. Wind power growth also has a large impact on the projected growth for commercial divers who will be needed to help construct and maintain offshore wind farms. However, few people are employed as wind turbine service technicians, and even with the fast projected growth rate, the occupation is only projected to add 4,800 new jobs.
Over half of the occupations in table 2 are healthcare practitioners and technical occupations or healthcare support occupations, reflecting the much faster than average growth that is projected for these occupational groups. A growing elderly population, increasing rates of chronic conditions, and greater access to healthcare all contribute to fast growth for these occupations.
An aging population is also important in the projected growth of personal financial advisors. Employment of personal financial advisors is projected to increase largely because many older Americans will seek their assistance in retirement planning and other financial matters.
Table 3 shows the 15 occupations projected to add the most new jobs between 2014 and 2024. Combined, these occupations are projected to add almost 3.6 million new jobs. About 1 in 3 new jobs are projected to be in one of these occupations.
Personal care aides are projected to add the most new jobs of any occupation in the economy, with demand driven by increases in the population over the age of 55. Personal care aides are very similar to the occupation that is projected to add the third most jobs—home health aides. In both occupations, aides assist people, primarily the elderly, living in their own homes or in large care communities. However, home health aides may provide routine medical care in addition to daily living assistance, but personal care aides cannot provide medical care. In addition to home health aides, three other healthcare-related occupations appear in table 3: registered nurses, nursing assistants, and medical assistants.
| 2014 National Employment Matrix title and code | Employment | Projected change, 2014–24 | Median annual wage, 2014(1) | Typical education needed for entry | |||
|---|---|---|---|---|---|---|---|
| 2014 | Number | Percent | |||||
| Total, all occupations | 00-0000 | 150,539.9 | 160,328.8 | 9,788.9 | 6.5 | $35,540 | — |
| Personal care aides | 39-9021 | 1,768.4 | 2,226.5 | 458.1 | 25.9 | 20,440 | No formal educational credential |
| Registered nurses | 29-1141 | 2,751.0 | 3,190.3 | 439.3 | 16.0 | 66,640 | Bachelor’s degree |
| Home health aides | 31-1011 | 913.5 | 1,261.9 | 348.4 | 38.1 | 21,380 | No formal educational credential |
| Combined food preparation and serving workers, including fast food | 35-3021 | 3,159.7 | 3,503.2 | 343.5 | 10.9 | 18,410 | No formal educational credential |
| Retail salespersons | 41-2031 | 4,624.9 | 4,939.1 | 314.2 | 6.8 | 21,390 | No formal educational credential |
| Nursing assistants | 31-1014 | 1,492.1 | 1,754.1 | 262.0 | 17.6 | 25,100 | Postsecondary nondegree award |
| Customer service representatives | 43-4051 | 2,581.8 | 2,834.8 | 252.9 | 9.8 | 31,200 | High school diploma or equivalent |
| Cooks, restaurant | 35-2014 | 1,109.7 | 1,268.7 | 158.9 | 14.3 | 22,490 | No formal educational credential |
| General and operations managers | 11-1021 | 2,124.1 | 2,275.2 | 151.1 | 7.1 | 97,270 | Bachelor’s degree |
| Construction laborers | 47-2061 | 1,159.1 | 1,306.5 | 147.4 | 12.7 | 31,090 | No formal educational credential |
| Accountants and auditors | 13-2011 | 1,332.7 | 1,475.1 | 142.4 | 10.7 | 65,940 | Bachelor’s degree |
| Medical assistants | 31-9092 | 591.3 | 730.2 | 138.9 | 23.5 | 29,960 | Postsecondary nondegree award |
| Janitors and cleaners, except maids and housekeeping cleaners | 37-2011 | 2,360.6 | 2,496.9 | 136.3 | 5.8 | 22,840 | No formal educational credential |
| Software developers, applications | 15-1132 | 718.4 | 853.7 | 135.3 | 18.8 | 95,510 | Bachelor’s degree |
| Laborers and freight, stock, and material movers, hand | 53-7062 | 2,441.3 | 2,566.4 | 125.1 | 5.1 | 24,430 | No formal educational credential |
Notes: (1) Data are from the Occupational Employment Statistics program, U.S. Bureau of Labor Statistics. Note: SOC = Standard Occupational Classification. Source: Employment Projections program, U.S. Bureau of Labor Statistics. | |||||||
The median annual wage for 11 of the 15 occupations in table 3 was below the median wage for all occupations in May 2014. The four occupations with above-average median wages each had a bachelor’s degree as the typical entry-level education category, whereas all other occupations had typical entry-level education at the postsecondary nondegree award level or below. Of the 15 occupations in table 3, typically, 8 have no formal educational credential needed for entry-level positions, including 4 of the 5 occupations projected to add the most new jobs through 2024.
Table 4 shows the occupations projected to decline the fastest, and table 5 shows the occupations projected to lose the most jobs through 2024. Entry-level education for most of these occupations is low. Of the 15 fastest declining occupations and the 15 with the largest projected declines, 14 and 13, respectively, have typical entry-level education of a high school diploma or equivalent or less.
| 2014 National Employment Matrix title and code | Employment | Projected change, 2014–24 | Median annual wage, 2014(1) | Typical education needed for entry | |||
|---|---|---|---|---|---|---|---|
| 2014 | 2024 | Number | Percent | ||||
| Total, all occupations | 00-0000 | 150,539.9 | 160,328.8 | 9,788.9 | 6.5 | $35,540 | — |
| Locomotive firers | 53-4012 | 1.7 | 0.5 | –1.2 | –69.9 | 46,740 | High school diploma or equivalent |
| Electronic equipment installers and repairers, motor vehicles | 49-2096 | 11.5 | 5.8 | –5.8 | –50.0 | 31,020 | Postsecondary nondegree award |
| Telephone operators | 43-2021 | 13.1 | 7.5 | –5.5 | –42.4 | 35,140 | High school diploma or equivalent |
| Postal Service mail sorters, processors, and processing machine operators | 43-5053 | 117.6 | 78 | –39.7 | –33.7 | 54,520 | High school diploma or equivalent |
| Switchboard operators, including answering service | 43-2011 | 112.4 | 75.4 | –37.0 | –32.9 | 26,550 | High school diploma or equivalent |
| Photographic process workers and processing machine operators | 51-9151 | 28.8 | 19.4 | –9.5 | –32.9 | 24,600 | High school diploma or equivalent |
| Shoe machine operators and tenders | 51-6042 | 3.5 | 2.5 | –1.1 | –30.5 | 24,750 | High school diploma or equivalent |
| Manufactured building and mobile home installers | 49-9095 | 4.0 | 2.8 | –1.2 | –30.0 | 29,600 | High school diploma or equivalent |
| Foundry mold and coremakers | 51-4071 | 12.0 | 8.7 | –3.3 | –27.7 | 31,340 | High school diploma or equivalent |
| Sewing machine operators | 51-6031 | 153.9 | 112.2 | –41.7 | –27.1 | 21,920 | No formal educational credential |
| Pourers and casters, metal | 51-4052 | 9.8 | 7.2 | –2.6 | –26.6 | 32,410 | High school diploma or equivalent |
| Postal Service mail carriers | 43-5052 | 297.4 | 219.4 | –78.1 | –26.2 | 57,200 | High school diploma or equivalent |
| Postal Service clerks | 43-5051 | 69.6 | 51.3 | –18.3 | –26.2 | 55,590 | High school diploma or equivalent |
| Postmasters and mail superintendents | Nov-31 | 17.3 | 12.8 | –4.6 | –26.2 | 65,800 | High school diploma or equivalent |
| Textile knitting and weaving machine setters, operators, and tenders | 51-6063 | 27.9 | 20.6 | –7.3 | –26.2 | 27,270 | High school diploma or equivalent |
Notes: (1) Data are from the Occupational Employment Statistics program, U.S. Bureau of Labor Statistics. Note: SOC = Standard Occupational Classification. Source: Employment Projections program, U.S. Bureau of Labor Statistics. | |||||||
Production occupations account for 6 of the 15 most rapidly declining occupations and 4 of the 15 occupations projected to lose the most jobs. Declines in these occupations are a direct result of projected declines in manufacturing. Almost 7 in 10 production jobs were in the manufacturing industry in 2014. Manufacturing employment is projected to decline by 6.7 percent because of foreign competition and continued automation of manufacturing processes, which directly affects production occupations.
Five of the fifteen most rapidly declining occupations and eight of the fifteen occupations projected to lose the most jobs are in office and administrative support. Technology is reducing the need for many office and administrative occupations because it makes workers’ jobs easier to perform or even replaces them, in some cases. For example, increased use of automated telephone systems and the ease with which people can communicate and access information electronically will decrease employment for telephone operators and switchboard operators.
| 2014 National Employment Matrix title and code | Employment | Projected change, 2014–24 | Median annual wage, 2014(1) | Typical education needed for entry | |||
|---|---|---|---|---|---|---|---|
| 2014 | 2024 | Number | Percent | ||||
| Total, all occupations | 00-0000 | 150,539.9 | 160,328.8 | 9,788.9 | 6.5 | $35,540 | — |
| Bookkeeping, accounting, and auditing clerks | 43-3031 | 1,760.3 | 1,611.5 | –148.7 | –8.4 | 36,430 | Some college, no degree |
| Cooks, fast food | 35-2011 | 524.4 | 444.0 | –80.4 | –15.3 | 18,540 | No formal educational credential |
| Postal Service mail carriers | 43-5052 | 297.4 | 219.4 | –78.1 | –26.2 | 57,200 | High school diploma or equivalent |
| Executive secretaries and executive administrative assistants | 43-6011 | 776.6 | 732.0 | –44.6 | –5.7 | 51,270 | High school diploma or equivalent |
| Farmworkers and laborers, crop, nursery, and greenhouse | 45-2092 | 470.2 | 427.3 | –42.9 | –9.1 | 19,060 | No formal educational credential |
| Sewing machine operators | 51-6031 | 153.9 | 112.2 | –41.7 | –27.1 | 21,920 | No formal educational credential |
| Tellers | 43-3071 | 520.5 | 480.5 | –40.0 | –7.7 | 25,760 | High school diploma or equivalent |
| Postal Service mail sorters, processors, and processing machine operators | 43-5053 | 117.6 | 78.0 | –39.7 | –33.7 | 54,520 | High school diploma or equivalent |
| Cutting, punching, and press machine setters, operators, and tenders, metal and plastic | 51-4031 | 192.2 | 152.7 | –39.5 | –20.6 | 30,680 | High school diploma or equivalent |
| Switchboard operators, including answering service | 43-2011 | 112.4 | 75.4 | –37.0 | –32.9 | 26,550 | High school diploma or equivalent |
| Molding, coremaking, and casting machine setters, operators, and tenders, metal and plastic | 51-4072 | 129.5 | 97.2 | –32.3 | –25.0 | 28,810 | High school diploma or equivalent |
| Computer programmers | 15-1131 | 328.6 | 302.2 | –26.5 | –8.0 | 77,550 | Bachelor’s degree |
| Printing press operators | 51-5112 | 173.0 | 151.4 | –21.6 | –12.5 | 35,100 | High school diploma or equivalent |
| Mail clerks and mail machine operators, except postal service | 43-9051 | 104.9 | 85.1 | –19.8 | –18.8 | 27,890 | High school diploma or equivalent |
| Bill and account collectors | 43-3011 | 350.4 | 330.9 | –19.6 | –5.6 | 33,700 | High school diploma or equivalent |
Notes: (1) Data are from the Occupational Employment Statistics program, U.S. Bureau of Labor Statistics. Note: SOC = Standard Occupational Classification. Source: Employment Projections program, U.S. Bureau of Labor Statistics. | |||||||
Employment of U.S. Postal Service workers is projected to decline rapidly. Postmasters and mail superintendents; Postal Service clerks; Postal Service mail carriers; and Postal Service mail sorters, processors, and processing machine operators are all projected to lose jobs. Employment in the Postal Service industry is projected to decrease as first-class mail volume continues to decline because of the popularity of email and online bill payments. In addition, improvements in technology allow mail to be sorted faster and more efficiently. Postal Service mail carriers and Postal Service mail sorters, processors, and processing machine operators are also among the 15 occupations projected to experience the largest declines in employment.
About 9.8 million new jobs are projected to be added to the economy between 2014 and 2024. The fastest job growth is projected to occur in healthcare support occupations and healthcare practitioners. Nearly 1 in 4 new jobs in the economy is projected to be in these two occupational groups. Production occupations and farming, fishing, and forestry occupations are the only two occupational groups projected to decline. Of the 15 fastest growing occupations, 11 have higher median wages than the national median.
The BLS Employment Projections program develops occupational projections using the best information and research available at the time. Factors that affect the outlook for occupations, such as new legislation and technological advancements, are constantly shifting, and new projections are developed every 2 years to account for changes.
Andrew Hogan and Brian Roberts, "Occupational employment projections to 2024," Monthly Labor Review, U.S. Bureau of Labor Statistics, December 2015, https://doi.org/10.21916/mlr.2015.49
1 The Occupational Outlook Handbook is available at https://www.bls.gov/ooh/.
2 For more information on employment projections methods, see chapter 13, “Employment projections,” BLS handbook of methods (U.S. Bureau of Labor Statistics, 2012), https://www.bls.gov/opub/hom/pdf/homch13.pdf, and the Employment Projections program’s methodology at https://www.bls.gov/emp/documentation/projections-methods.htm.
3 For more information on labor force projections, see Mitra Toossi, “Labor force projections to 2024: the labor force is growing, but slowly,” Monthly Labor Review, December 2015.
4 See Kathryn Byun and Bradley Nicholson, “The U.S. economy to 2024,” Monthly Labor Review, December 2015, https://www.bls.gov/opub/mlr/2015/article/the-us-economy-to-2024.htm.
5 See Richard L. Henderson, “Industry employment and output projections to 2024,” Monthly Labor Review, December 2015, for more information on projected industry output and employment, https://www.bls.gov/opub/mlr/2015/article/industry-employment-and-output-projections-to-2024.htm.
6 Historical staffing patterns are derived from the Occupational Employment Statistics survey, https://www.bls.gov/oes/, and from the Current Population Survey, https://www.bls.gov/cps/.
7 More information on the BLS education and training system is available at https://www.bls.gov/emp/documentation/education/tech.htm.
8 More information on estimating occupational replacement needs is available at https://www.bls.gov/emp/documentation/replacements.htm.
9 Data on replacement needs and job openings are available at https://www.bls.gov/emp/tables/occupational-separations-and-openings.htm.
10 For more information on the Standard Occupational Classification system, see https://www.bls.gov/soc/.