An official website of the United States government
An official website of the United States government
The .gov means it's official.
Federal government websites often end in .gov or .mil. Before sharing sensitive information,
make sure you're on a federal government site.
The site is secure.
The
https:// ensures that you are connecting to the official website and that any
information you provide is encrypted and transmitted securely.

Make a list. Check it twice. No, we’re not talking about Santa Claus. We are talking about you, the responsible household consumer making your weekly grocery list. Grocery shopping today is an exercise in logistics. It is a chore determining the best route for running your errands. Although you may start online and include a variety of store types, the grocery store remains the most popular destination for household essentials.
Retailers dwell at the end of a supply chain: selling goods and services directly to consumers. Among retailers, grocery stores maintain a constant trust as the principal curators of products you consume on a daily basis. Fundamental to grocery store operations is a guarantee of freshness, quality, and safety even through changes in formats, services, and technologies.
Innovations and improvements to technology are generally expected to lead to growth in productivity as labor becomes more efficient. Labor productivity is defined as real output per hour and is a measure of how efficiently labor is used in producing goods and services. Real output in retail industries is the annual revenue adjusted for inflation. Growth in productivity is calculated as the growth in output divided by the growth in hours worked. If output grows faster than hours, then productivity increases.
Grocery stores have often been the breeding ground for innovations in retail, yet productivity results have been mixed. Over the 1987–2000 period, labor productivity fell in 10 of the 13 years. Since 2000 through 2018, productivity grew in all but 4 years yet remained well below that of retail trade overall.
In this Beyond the Numbers article, we review the timeline for the development and implementation of new retail technologies in grocery stores. Then, check out the shifts in products and services offered by grocery stores over time. Using Bureau of Labor Statistics (BLS) data, the article looks at the trends in employment and hours to show how all of these factors influenced labor productivity in grocery stores. Finally, we step back to see the bigger retail trade picture and view the differences in productivity and compensation.
Supermarkets and grocery stores transformed in the 20th century from small mom-and-pop operations to large-format centers of convenience.1 One of the most important modern technological advances that enabled this transformation was the cash register, invented in 1878.2 Innovations both internal and external to supermarket operations influenced future format changes.
1912: The Great Atlantic and Pacific Tea Company (A&P) standardized the “economy” grocery store format which streamlined operations and reduced costs by developing their own manufacturing and distribution networks, among other modifications.3
1950s: Widespread addition of the shopping cart, reliable in-home refrigeration, more affordable cars, and expanded roadways allowed for fewer trips to the grocery store and drove the creation of the large supermarket format.4
1970s: The first barcode scanner was installed in 1974. In the late 1970s, grocery retailers documented their hopes for this new technology, anticipating faster and more accurate checkouts for consumers as well as better control of inventories and employee schedules.5
By the early 1990s, scanning registers were nearly ubiquitous among grocery stores. This widespread deployment coincided with a kickoff to a period of increased mergers and acquisitions.6 The top 20 firms’ share of U.S. grocery store sales increased from 39.2 percent in 1992 to 66.6 percent in 2016. (See chart 1.) These larger firms could take advantage of economies of scale and more easily implement technological innovations. Newer methods of tracking consumer shopping habits gave companies the power of information which allowed them to better determine the products to offer their customers. Expanding the use of technology is often presumed to lead to improvements in productivity through lower costs and decreased need for labor.
Smaller, independent operations struggled to survive amid increased consolidation of larger grocery firms and the inclusion of separate grocery departments in supercenter stores—an oft-cited reason for bankruptcy.7 The displacement of the smaller stores is reflected in the diminishing share of hours worked from self-employed and unpaid family workers in grocery stores, from 7.0 percent in 1987 to 2.8 percent in 2000. By 2018, these workers contributed less than 1 percent of the hours worked in grocery stores.
As scanners were installed to increase efficiency and lower costs, grocery stores began to offer more services for greater customer convenience. These additional services, though, required specialized labor which was more costly and meant more hours worked. Grocery stores competed with other retail industries by being one-stop shops. Deli, meat, seafood counters and in-store bakeries increased the appeal of supermarket shopping and allowed customers to get all of their food essentials from one location. The business model appeared to shift again as grocery purchases alone composed a decreasing share of total sales in grocery stores, from 76.6 percent in 1987 to 70.7 percent as of 2012.8
Grocery stores extended their appeal to customers beyond the expansion of traditional food-at-home services. They added in-store pharmacies, gasoline pump stations, ready-to-go meals and snacks, and general merchandise centers, including florist kiosks. As the share of grocery purchases fell through 2012, combined sales for general merchandise, automotive fuels, and prepared meals and snacks tripled from less than 3 percent to over 9 percent, with a total share increase of 6.8 percent.9 (See chart 2.)
The Food Marketing Institute (FMI) annual survey of grocers shows the median size of stores increasing from 35,100 square feet in 1994 to a peak of 48,750 square feet in 2006 but declining since to an average 41,651 square feet in 2018.10 The number of items (referred to as stock keeping units or SKUs) per location has also fluctuated. Starting from an average of just over 14,000 in 1980, SKU counts climbed to a plateau of about 51,000 in 2008. Subsequently, SKUs tumbled over the years before landing at 33,055 in 2018.11 Carrying fewer items gave bargaining power to the companies with their suppliers.
The fluctuation in store size and items offered reflects the dynamic and adaptive nature of supermarkets. The recent drops in both are attributed to the growth of small-format stores, which perhaps reflects transformation and specialization of supermarkets from the suburbs and into the cities.
Grocery stores increased floor space, diversified product lines, added more items to the shelves, and expanded in-store services through the 1990s, even as new technologies were implemented to reduce labor hours necessary for checkout and inventory control functions. To support these transformations, from 1987 to 2000 employment grew from 2.2 to 2.5 million at an average annual rate of 1.1 percent, which was slower than the 1.3-percent growth for retail trade overall. Over the same time, hours worked grew 1.0 percent annually to peak at 4.1 billion hours. (See charts 3 and 4.)
The recession in 2001 forced retailers to make tough decisions about minimizing costs. They also faced competition for sales and workforce from the ever-encroaching warehouse clubs and supercenters.12 When self-checkout lines expanded into grocery stores in the early 2000s, customers faced a learning curve, and workers feared loss of hours as retailers struggled with rising labor costs.13 From 2000 to 2010, employment fell by 0.5 percent annually even as it grew by 0.6 percent in general merchandise stores. (See chart 3.)
From 1987 through 2003, average weekly hours (AWH) worked in grocery stores wavered between 31.0 and 32.0 hours. Starting in 2004, however, average weekly hours began to decline from 30.5 to 28.3 in 2009. The combination of relatively flat employment and declining weekly hours led to a significant drop in total hours from the peak in 2000 to the trough of the following business cycle in 2010 landing at 3.5 billion hours. (See chart 4.) The 1.6-percent average annual decline in hours worked coincided with expanded application of demand-based schedules using retailers’ own transaction statistics to control work hours and reduce benefit costs.14
Coming out of a recession, employment recovered to just above prerecession levels, growing on average at 1.0 percent annually from 2010 to 2018. Average weekly hours worked fluctuated during this time, yet stabilized around 28.0 hours in the 4 years through 2018 except in 2016. Total hours worked recovered to just 3.7 billion as of 2018, growing at 0.8 percent annually lagging behind employment.
Grocery stores attempted to reduce labor costs through technological advances and internal supply chain improvements. Although such enhancements are typically associated with increasing productivity, the result instead was an average annual decrease of 0.7 percent in productivity over the 1987–2000 period. (See chart 5.) These attempts were impeded by the addition and expansion of specialty departments from the late 1980s through the 1990s.
The growth of labor-intensive services necessitated the increase in hours worked through 2000. Output growth was almost stagnant over the 1987–2000 period, at 0.3 percent annually, which was far below the 4.3-percent growth in output for the retail trade sector. (See chart 6.)
Grocery stores achieved productivity gains in 9 of 10 years from 2000 through 2010 with an average annual growth rate of 1.8 percent. The Great Recession caused productivity to fall in 2008. Hours worked dropped over the 10 years while output nudged only slightly at 0.2 percent, slowing from the previous period. After years of consolidations, larger firms were better positioned to reap the rewards of growing scanner technology, and the resulting data allowed them to fine-tune their scheduling and inventory processes.
Output and hours both picked up in 2011 through 2014. At 1.2 percent average annual growth, output lagged at about one third the rate of retail trade overall during this time. As hours grew faster than output, changes in productivity for grocery stores were mixed, with decreases in 3 of the 4 years, resulting in an average annual drop in productivity of 0.4 percent.
Starting in 2015, however, output growth picked up to 2.9 percent on average annually, at about 75 percent the rate of retail trade. Hours for grocery stores were essentially flat even as they grew slightly in the retail sector from 2014 through 2018. Although the previous period of productivity growth from 2000 to 2010 was led primarily by a decrease in hours, the uptick in productivity of 2.9 percent for the 4 years through 2018 comes almost exclusively from the increase in output.
Grocery stores diversified and offered more products and services in direct competition with other retail groups; however, grocery stores were unable to keep pace with the overall sector. Average annual productivity growth was mostly flat in grocery stores at 0.6 percent, from 1987 to 2018. This occurred even as productivity growth for their product-line competitors ranged from 1.4 percent for gasoline stations to 3.3 percent for miscellaneous store retailers.15 (See table 1.)
| Store category | Productivity growth per year | 2010 | 2018 | |||||
|---|---|---|---|---|---|---|---|---|
| 1987–2018 | 1987–2000 | 2000–10 | 2010–18 | Sales in percent | Percentage of employment | Sales in percent | Percentage of employment | |
|
Total retail trade sector |
2.9 | 3.0 | 2.7 | 2.8 | $3.8 trillion | 15.4 million | $5.3 trillion | 16.7 million |
|
Food and beverage stores |
0.7 | -0.6 | 1.8 | 1.3 | 15.2 | 19.0 | 14.3 | 19.0 |
|
Grocery stores |
0.6 | -0.7 | 1.6 | 1.2 | 13.6 | 16.4 | 12.8 | 16.3 |
|
Supermarket and other grocery stores |
0.6 | -0.7 | 1.8 | 1.2 | 13.0 | 15.3 | 12.2 | 15.3 |
|
Motor vehicle and parts dealers |
2.2 | 3.1 | 0.5 | 3.0 | 19.5 | 11.0 | 22.8 | 12.4 |
|
Furniture and home furnishings stores |
3.8 | 3.4 | 4.0 | 4.1 | 2.2 | 3.2 | 2.2 | 3.2 |
|
Electronics and appliance stores |
10.7 | 11.5 | 13.0 | 6.7 | 2.6 | 3.6 | 1.9 | 3.1 |
|
Building material and garden supply stores |
2.6 | 3.2 | 1.5 | 3.1 | 6.8 | 7.6 | 7.1 | 8.0 |
|
Health and personal care stores |
1.6 | 2.2 | 2.5 | -0.5 | 6.8 | 6.6 | 6.5 | 6.7 |
|
Gasoline stations |
1.4 | 2.0 | 2.1 | -0.5 | 11.7 | 5.4 | 9.7 | 5.6 |
|
Clothing and clothing accessories stores |
3.9 | 4.7 | 4.4 | 2.2 | 5.6 | 9.5 | 5.1 | 8.8 |
|
Sporting goods, hobby, book, and music stores |
3.5 | 3.8 | 4.4 | 1.7 | 2.0 | 4.2 | 1.5 | 3.8 |
|
General merchandise stores |
2.9 | 3.9 | 2.3 | 1.9 | 15.8 | 19.6 | 13.3 | 18.7 |
|
Miscellaneous store retailers |
3.3 | 4.5 | 2.3 | 2.6 | 2.7 | 6.1 | 2.5 | 5.9 |
|
Nonstore retailers |
8.1 | 8.9 | 8.2 | 6.8 | 8.9 | 4.2 | 13.0 | 4.8 |
|
Source: U.S. Bureau of Labor Statistics |
||||||||
Overall retail productivity growth in the 1990s was mainly attributed to national-level establishments with relatively higher productivity replacing smaller, less productive businesses closing down.16 Led by the growth of general merchandise stores with supercenters, establishments were forced to implement the latest in available technology and operational best practices to remain competitive. Among the changes were ever-improving scanners and tighter inventory controls made possible by advances in computing infrastructure. The smaller stores just couldn’t keep up. Food and beverage stores stand apart from other retailers as the only industry group in the sector with decreasing productivity from 1987 through 2000 as growth in the national-chain model lagged in grocery stores over the same period.
Productivity improved by about 2.0 percent annually in grocery stores in the 2000 to 2010 period, compared with the previous period, 1987 to 2000. The improvement occurred even as productivity growth slowed for other retailers. Notably, annual productivity in general merchandise stores fell from 3.9 percent through 2000 to 2.3 percent through 2010. Miscellaneous store retailers experienced an even sharper decline, from 4.5 percent to 2.3 percent between the two periods.
Retail firms across the board began adapting to the new reality of online shopping. Many firms, including grocery stores, developed their own online presence. In 2018, Progressive Grocer market research reported a variety of “omnichannel services” from click-and-collect and drive-up collection sites to home delivery by the store or a third-party vendor, each in use by around 30 percent of stores.17 Despite these attempts to compete with online shopping, supermarkets experienced a loss of retail share from 13.0 to 12.2 percent over the 2010–18 period. Hit hardest were general merchandise stores falling from a retail share of 15.8 to 13.3 percent as the share for nonstore retailers grew from 8.9 to 13.0 percent.
As of 2018, the sales for nonstore retailers were almost on par with those for food and beverage stores and general merchandise stores. The remarkable growth in nonstore retailers did not shield it, however, from slowing productivity growth. In fact, 8 of the 12 retail industry groups experienced slower or even negative productivity growth from 2010 to 2018, compared with the previous period.
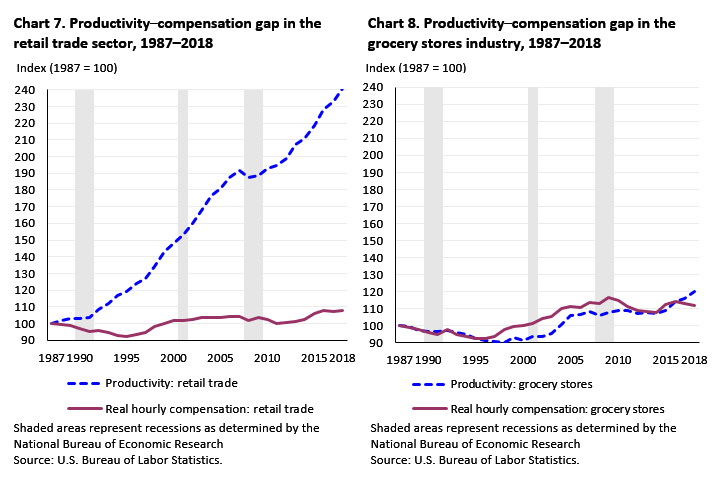
Labor compensation refers to an employee’s base wage and salary plus benefits. Since the 1970s, productivity and compensation have steadily diverged in the broader U.S. economy.18 Trends in the retail trade sector reflect an ever-widening gap between growing productivity and stagnant compensation. (See chart 7.)
In grocery stores, productivity either tracked closely with or lagged slightly behind compensation.19 (See chart 8.) Real hourly compensation growth in grocery stores is similar to the retail sector despite the big difference in productivity growth.20Given the lower productivity growth, perhaps it’s not surprising that compensation in grocery stores actually increased a bit more than the retail sector since 1987.
The labor share of income is the portion of the value of production going to workers as opposed to other production inputs such as capital or purchased services. For the overall retail trade sector, compensation to workers represents a decreasing share of income for retail trade overall for much of the period from 1987 to 2018. (See chart 9.) But the labor income share in grocery stores grew through 2002 in correspondence to the growth in labor-intensive services offered. After 2003, labor share fell in parallel to the retail sector following years of consolidation and as retail chains built bigger locations to accommodate a more diverse inventory. In-store services were replaced by more prepackaged products, and consumers experienced a more self-service environment.
Potentially missing from the hours and productivity measures is the time spent by those people not employed by grocery stores, mainly vendors and customers. Grocery stores lease shelf space, effectively handing over the responsibility of maintaining and marketing the inventory to vendors. And just as self-service pumps reduced the staff levels necessary to operate gas stations, scanners and self-service checkouts have transferred the work of supply chain management and cashiers to computer systems and customers.21
Further shifts are anticipated as employment of cashiers and stock clerks and order fillers—the two largest occupations employed in food and beverage stores—is projected to decline or grow slower than the average for all occupations from 2018 to 2028.22 Expanded application of technologies anticipated to have the largest impact are self-service checkout, online sales, radio frequency identification (RFID) tags, and hand-held devices that read barcodes automatically. As when scanning registers were first introduced in the 1970s, retailers would hope to gain efficiencies and require fewer employees to do the same amount of work.
It will be interesting to watch what happens to the grocery shopping experience as outside influences force grocery stores to adapt. Once upon a time, customers walked in with a shopping list and someone else gathered items for them. Then customers had the convenience of walking the aisles with a list in hand, picking up items at their own pace. Later came self-checkout with some stores introducing scan and bag as you shop. Customers are being asked to do more for themselves while they are in the store and before they leave. Perhaps it is no surprise that some people have transferred the work of gathering standard grocery items to online shopping platforms—a form of personal shopping for a fee, of course. It is up to the customer to decide if the tradeoffs are worth it.
Grocery stores have reinvented themselves by changing formats, adopting new technologies, expanding products and services, and more. Despite innovations, productivity growth remains lower for grocery stores than the overall retail sector. However, smaller format grocery stores reinforced the industry in recent years by focusing on product lines tailored to a changing customer base. The grocery store remains a steady component of retail trade and an integral part of the retail consumer’s life.
This Beyond the Numbers article was prepared by Jenny Rudd, economist in Office of Productivity and Technology, U.S. Bureau of Labor Statistics. E-mail: Rudd.Jenny@bls.gov; telephone: (202) 691-5816 or E-mail: productivity@bls.gov; telephone: (202) 691-5606.
Information in this article will be made available upon request to individuals with sensory impairments. Voice phone: (202) 691-5200. Federal Relay Service: 1-800-877-8339. This article is in the public domain and may be reproduced without permission.
Jenny Rudd, “Checking out productivity in grocery stores,” Beyond the Numbers: Productivity, vol. 8, no. 15 (U.S. Bureau of Labor Statistics, December 2019), https://www.bls.gov/opub/btn/volume-8/checking-out-productivity-in-grocery-stores.htm
1 The supermarket and other grocery stores industry refers to the 6-digit North American Industry Classification System (NAICS) code 445110 Supermarkets and other grocery (except convenience) stores.
2 Emek Basker, ed., Handbook on the economics of retailing and distribution (Cheltenham, UK: Edward Elgar, 2016), pp. 368–391.
3 R.S. Tedlow, New and improved: the story of mass marketing in America (New York: Basic Books, 1990).
4 The check-out operation in self-service retail food stores, 1951, Bulletin 31 (U.S. Department of Agriculture January 1951), https://naldc-legacy.nal.usda.gov/naldc/download.xhtml?id=CAT87209902&content=PDF.
5 Emek Basker, ed., Handbook on the economics of retailing and distribution (Cheltenham, UK: Edward Elgar, 2016.) pp. 38–50.
6 Sales values represent grocery stores industry NAICS code 4451 comprising establishments primarily engaged in retailing a general line of food products. For more information on retail trends, visit https://www.ers.usda.gov/topics/food-markets-prices/retailing-wholesaling/retail-trends/.
7 Tom Karst, “Independent retailers giving up market share,” The Packer, November 28, 2017, https://www.thepacker.com/article/independent-retailers-giving-market-share.
See also, Patricia Callahan and Ann Zimmerman, "Wal-Mart tops grocery list with supercenter format," The Wall Street Journal, May 27, 2003, https://www.wsj.com/articles/SB105399104040808900.
8 Groceries were aggregated for this article as the collection of groceries and other foods for human consumption off the premises (e.g. meats, produce, frozen foods, dairy products, bakery items, deli items).
For more information on merchandise lines sales from Economic Census, see https://www.census.gov/content/dam/Census/programs-surveys/economic-census/09-16-21_whats-been-released.xlsx. Data for 2017 will be available in 2020.
9 General merchandise was aggregated for this article to include four broad categories: home goods; apparel; stationery, school supplies, greeting cards, and print media; and lawn and garden, cut flowers, hardware, and sporting goods.
10 For more information from Food Marketing Institute on median total square size, see https://www.fmi.org/our-research/supermarket-facts and https://www.fmi.org/our-research/supermarket-facts/median-total-store-size-square-feet.
11 “Food Retailing Industry Speaks,” FMI (annual reports, 1981–2019), https://www.fmi.org/blog/view/fmi-blog/2019/12/02/grocery-productivity-numbers-to-watch.
12 Michael Strople, “From supermarkets to supercenters: employment shifts to the one-stop shop,” Monthly Labor Review (February 2006), pp. 39–46, https://www.bls.gov/opub/mlr/2006/02/art3full.pdf.
13 William Grimes, “Just browsing; When the cashier is you,” New York Times, Apr 07, 2004, https://www.nytimes.com/2004/04/07/dining/just-browsing-when-the-cashier-is-you.html.
See also, Leslie Berestein, “Grocery clerks' real nightmare,” The San Diego Union-Tribune, December 28, 2003.
And, Lorrie Grant, “Supermarkets seek survival strategies; More automation, prepared foods eyed,” USA Today, October 28, 2003.
14 Eric Krell, “The Best of Times,” HR Magazine, vol. 52, no. 5 (May 2007), pp. 48–52. Available at: http://search.ebscohost.com/login.aspx?direct=true&db=buh&AN=24966426&site=ehost-live.
15 The miscellaneous store retailers industry (NAICS 453) includes businesses like florists, office supply and gift stores, pet and pet supply stores, and tobacco stores.
16 Lucia Foster, John Haltiwanger, and C. J. Krizan, “Market selection, reallocation, and restructuring in the U.S. retail trade sector in the 1990s,” The Review of Economics and Statistics 88, no. 4 (2006), pp. 748–58.
17 Randy Hofbauer, “Tech’s now a top concern for grocers – here’s where they’re investing in it: annual report,” Progressive Grocer, April 19, 2018, https://progressivegrocer.com/techs-now-top-concern-grocers-heres-where-theyre-investing-it-annual-report.
18 Michael Brill, Corey Holman, Chris Morris, Ronjoy Raichoudhary, and Noah Yosif, “Understanding the labor productivity and compensation gap,” Beyond the Numbers: Productivity, vol. 6, no. 6 (U.S. Bureau of Labor Statistics, June 2017), https://www.bls.gov/opub/btn/volume-6/understanding-the-labor-productivity-and-compensation-gap.htm.
19 Food and beverage stores (NAICS 451) is the only three-digit retail industry group to defy the productivity–compensation gap.
20 Real hourly compensation is an employee’s base wage and salary plus benefits adjusted for inflation using the Consumer Price Index (CPI). The CPI is a measure of the average change over time in the prices paid by urban consumers for a market basket of consumer goods and services. More information on the CPI can be found at https://www.bls.gov/cpi/. It is used by the BLS productivity program to deflate nominal sales or values of production to calculate real output.
21 Emek Basker, Lucia Foster, and Shawn Klimek, “Customer-employee substitution: evidence from gasoline stations,” Journal of Economics and Management Strategy, vol. 26, Issue 4 (Winter 2017), pp. 876–896.
22 Bureau of Labor Statistics, U.S. Department of Labor, Occupational Outlook Handbook, "Cashiers", https://www.bls.gov/ooh/sales/cashiers.htm (visited September 06, 2019).
See also, Bureau of Labor Statistics, U.S. Department of Labor, Occupational Outlook Handbook, "Material Recording Clerks", at https://www.bls.gov/ooh/office-and-administrative-support/material-recording-clerks.htm (visited September 06, 2019).
And, as of May 2018, cashiers and stock clerks and order fillers combined made up 49.6 percent of the total employment in Food and Beverage Stores (NAICS 4451 and 4452 only). These data are compiled and published by the BLS Occupational Employment Statistics program and available at https://www.bls.gov/oes/current/naics4_4450A1.htm.
Publish Date: Wednesday, December 18, 2019