
An official website of the United States government
An official website of the United States government
The .gov means it's official.
Federal government websites often end in .gov or .mil. Before sharing sensitive information,
make sure you're on a federal government site.
The site is secure.
The
https:// ensures that you are connecting to the official website and that any
information you provide is encrypted and transmitted securely.

The natural gas boom in the United States, driven primarily by shale gas, has greatly contributed to the decline in overall natural gas prices over the last decade.1 However, consumers of natural gas often do not experience price changes equally. Regional variations in pipeline access, storage facilities, production, weather, and consumption all influence the price of natural gas at a local level—meaning the cost of heating a home in Louisiana may be drastically different from the cost of heating a home in Massachusetts.
In October 2016, the Bureau of Labor Statistics (BLS) introduced regional detail for the Producer Price Index (PPI) for natural gas distribution (with historical data back to 2012). These indexes allow for a regional analysis of how the changing natural gas market is affecting prices for end users.2 This Beyond the Numbers article examines the PPI regional natural gas distribution indexes at the residential level to explore movements that would not be readily apparent in a national-level index. Studying the regional indexes unveils unique trends among the indexes caused by differences in pipeline infrastructure, weather patterns, and seasonal influences.
Largely due to the shale revolution, the natural gas industry in the United States has grown rapidly over the last several years.3 Between 2005 and 2016, U.S. production of dry natural gas increased about 50 percent, making the United States the largest producer of natural gas in the world. (See chart 1.)4 This boom in production directly led to significant declines in natural gas prices. For example, the Henry Hub natural gas spot price, often used as a national benchmark for natural gas commodity prices, decreased from $8.69 per million British Thermal Units (BTU) in 2005, to only $2.52 per million BTU in 2016.5 Although only one factor in a customer’s monthly bill, natural gas commodity prices play a key role in determining the price for natural gas used in homes, businesses, industry, and electric power plants.
As natural gas production has increased, so has natural gas consumption, although at a slower rate. Natural gas consumption increased more than 17 percent between 2000 and 2016.6 Much of the increase is due to more natural gas usage in electric power generation since 2009, as low prices help make natural gas more competitive with coal for use in power plants.7 Meanwhile, increases in appliance efficiency and population shifts toward warmer climates have resulted in less natural gas consumed by U.S. households since 2000.8
With the growing importance of the natural gas market, additional detail in the form of regional indexes is helpful in analyzing this industry. The regional producer price indexes for natural gas distribution break out national PPIs into nine distinct sections that correspond to the U.S. Census regional divisions.9 There are four primary U.S. Census regions, which are further separated into the nine divisions: New England, Middle Atlantic, South Atlantic, East North Central, East South Central, West North Central, West South Central, Mountain, and Pacific. Figure 1 shows which states are contained in each section.
As natural gas production and demand grow, the need for pipelines to transport natural gas from its extraction point or storage locations to consumers increases. A lack of pipelines creates difficulty in moving natural gas across different regions, and this constraint is a primary contributor to regional differences in natural gas prices.10
Certain areas have been the epicenters of the recent shale revolution that has helped to lower local natural gas prices. The state of Pennsylvania in particular witnessed a dramatic rise in natural gas production—increasing from only 200,000 million cubic feet (MCF) in 2008 to 5,200,000 MCF in 2016, or a 2,500-percent increase.11 The abundance of natural gas in the Middle Atlantic region, which includes Pennsylvania, directly contributes to lower natural gas prices for the region’s residential consumers. From June 2012 to March 2017, residential prices in the Middle Atlantic have declined about 9 percent, compared with a 13-percent increase nationwide. (See chart 2.) In fact, the Middle Atlantic is the only region in the country that has seen a decrease in residential natural gas distribution prices since June 2012, partly due to the abundance of natural gas in the area. (See table 1.)12
| Region | Percent growth |
|---|---|
| New England | 18.4% |
| Middle Atlantic | -9.4% |
| East North Central | 10.7% |
| West North Central | 10.6% |
| South Atlantic | 7.3% |
| East South Central | 8.9% |
| West South Central | 41.0% |
| Mountain | 11.3% |
| Pacific | 13.6% |
| Source: U.S. Bureau of Labor Statistics. | |
Rising production in the Middle Atlantic is only part of the reason residential natural gas prices trended lower in that region since June 2012. The region’s relative lack of pipeline infrastructure also contributes to the area’s low price environment. According to analysis by the Energy Information Administration (EIA), pipeline infrastructure that delivers natural gas to consumers and export locations has not kept pace with the growth in natural gas production in the Middle Atlantic region. Due to limited pipeline capacity, producers are unable to move oversupplied gas out of the region or to the coast for export, causing relatively lower localized natural gas prices. However, many pipeline projects are currently under development in the region in an attempt to allow producers in the area to transport their natural gas outside of the Middle Atlantic region.13
Regional variations in weather can also play a major role in residential natural gas distribution prices. In early 2014, a large cold wave, commonly known as the “2014 Polar Vortex,” affected large parts of the northern and eastern United States.14 The cold wave resulted in the 2013–2014 winter being one of the coldest on record in the upper Midwest.15 As temperatures decline, demand for natural gas increases as residential customers need more natural gas to heat their homes, resulting in higher natural gas costs, which are typically passed on to the consumer through a purchased gas adjustment in the customer’s bill.
In Michigan, the natural gas spot price for the Michcon Hub, which serves the greater Detroit area, central Michigan, and Michigan’s Upper Peninsula, rose over 85 percent between January 2014 and March 2014 as cold temperatures sent natural gas demand and spot prices soaring.16 Although the price of the natural gas commodity only makes up about one-third to one-half of a customer’s bill, the increase in local spot prices for natural gas in the region supplied by the Michcon Hub resulted in a significant rise in the East North Central regional index during that period.17 Chart 3 shows both the residential East North Central index and the Michcon Hub spot price spiking during the 2014 cold wave. By comparison, the cold wave had much less of an effect on the East South Central region, with the residential index rising only 3.2 percent between January 2014 and March 2014, compared with the East North Central residential index increase of 18.9 percent over the same period.
In addition to isolated weather events playing a role in regional price indexes, regular seasonal price movements also vary across regions. While essentially all regional indexes face upward pricing pressure during the winter heating season, the New England region exhibits the most extreme seasonal movements. This is due to a combination of high natural gas demand in the winter and relatively little capacity to transport natural gas into the region, despite a growing reliance on natural gas usage within the region.18 As chart 4 shows, the New England residential natural gas index regularly increases sharply each November and later retreats back to prices closer to prewinter levels in May.
While a lack of pipelines in the Middle Atlantic causes lower prices in the region because producers are unable to move the natural gas out of the region, causing oversupply, New England faces the opposite problem.19 New England produces almost no natural gas, which means the area relies on its limited interstate pipeline network for its natural gas supply.20 When winter arrives and natural gas demand increases, prices spike in order to balance the high demand and tight supply conditions caused by New England’s limited pipeline capacity.
Table 2 shows how regional residential natural gas prices can vary significantly in response to seasonal changes. Residential natural gas prices for New England routinely increase from October, the month before the winter season starts, to February, a month in the middle of the heating season. Residential natural gas prices for New England increased 18.8 percent on average during the 2012–16 heating seasons.
| Season | New England | West North Central | Pacific | Middle Atlantic | National |
|---|---|---|---|---|---|
| Oct 2012–Feb 2013 | 17.8% | 7.1% | -0.6% | -6.6% | 3.7% |
| Oct 2013–Feb 2014 | 21.3% | 29.7% | 7.5% | 2.3% | 10.1% |
| Oct 2014–Feb 2015 | 17.9% | -15.5% | -0.8% | -1.1% | -4.5% |
| Oct 2015–Feb 2016 | 18.3% | -4.4% | -2.8% | -3.9% | -1.2% |
| Average | 18.8% | 4.2% | 0.8% | -2.3% | 2.0% |
| Source: U.S. Bureau of Labor Statistics. | |||||
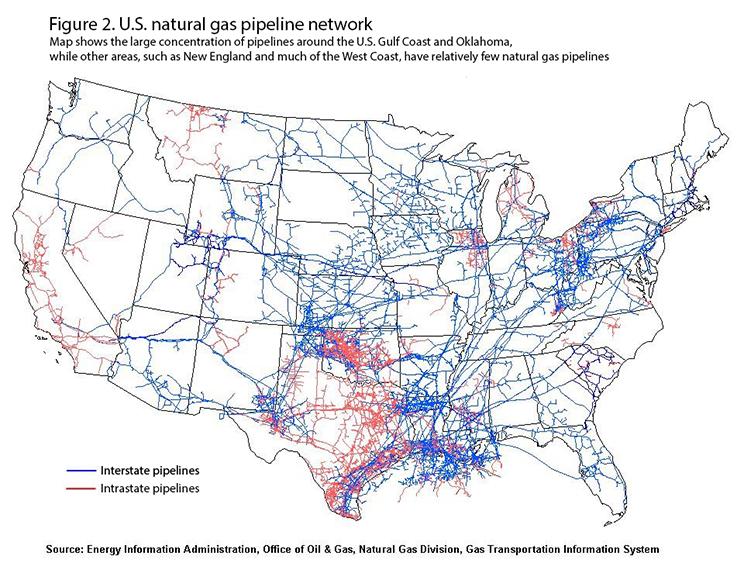
The seasonal residential price changes in New England contrast with the price movements in other regions and nationally. The Pacific region saw tepid price growth during the 2012–16 winter periods, averaging a residential natural gas increase of only 0.8 percent with only small changes outside the 2013–14 winter, which saw residential natural gas prices increase 7.5 percent. Residential prices in the West North Central region, though facing cold winters like New England, only saw an average increase of 4.2 percent during the 2012–16 heating seasons. This is in large part due to a more robust natural gas pipeline network and regional production of natural gas in North Dakota and Kansas. (See figure 2.) This map of the United States interstate and intrastate pipeline network illustrates the large concentration of pipelines around the U.S. Gulf Coast and Oklahoma, while other areas, such as New England and much of the West Coast, are shown to have relatively few natural gas pipelines.21
Nationally, residential natural gas prices grew 2.0 percent on average between October and February of each season. While there is upward pressure on prices during the winter due to natural gas utilities usually increasing their distribution rates (the part of the bill not affected by the natural gas commodity price), the price of the natural gas itself can still decline enough to cause decreases in overall bills during the winter. This happened in the 2014–15 and 2015–16 heating seasons, where overall residential natural gas bills steadily declined throughout those 2 years.
The publication of the regional PPIs for natural gas distribution allows data users to gain a better understanding of regional trends in natural gas distribution. While the national index for gas distribution contains valuable information about the price at an aggregate level, the regional indexes demonstrate that factors such as localized levels of natural gas production, pipeline infrastructure, response to rare weather phenomena, and seasonality influence prices regionally. Analysis of these factors reveals unique stories about the price of natural gas delivered to homes in different regions of the United States.
This Beyond the Numbers article was prepared by Stephen York, economist in the Office of Prices and Living Conditions, U.S. Bureau of Labor Statistics. Email: york.stephen@bls.gov, telephone: (202) 691-7939
Upon request, the information in this article will be made available to individuals who are sensory impaired. Voice phone: (202) 691-5200. Federal Relay Service: 1-800-877-8339. This article is in the public domain and may be reproduced without permission.
Stephen York, “Drilling deep into PPI indexes to understand regional variations in natural gas price movements,” Beyond the Numbers: Prices & Spending, vol. 7, no. 1 (U.S. Bureau of Labor Statistics, February 2018), https://www.bls.gov/opub/btn/volume-7/drilling-deep-into-ppi-indexes-to-understand-regional-variations-in-natural-gas-price-movements.htm
1 PPI Energy and Chemicals Team, “The effects of shale gas production on natural gas prices,” Beyond the Numbers: Prices and Spending, vol. 2, no.13 (U.S. Bureau of Labor Statistics, May 2013), https://www.bls.gov/opub/btn/volume-2/the-effects-of-shale-gas-production-on-natural-gas-prices.htm.
2 Addition of Regional Detail for Natural Gas Distribution Producer Price Indexes, 2016 (U.S. Bureau of Labor Statistics, November 2016), https://www.bls.gov/ppi/regionalnaturalgas.htm.
3 “Annual Energy Outlook with Projections to 2050,” U.S. Energy Information Administration (U.S. Department of Energy, September 2017), p. 58, https://www.eia.gov/outlooks/aeo/pdf/0383(2017).pdf.
4 U.S. Natural Gas Marketed Production, U.S. Energy Information Administration (U.S. Department of Energy, August 2017), https://www.eia.gov/dnav/ng/hist/n9050us2a.htm. Also, see Linda Doman, United States remains largest producer of petroleum and natural gas hydrocarbons (U.S. Department of Energy, Energy Information Administration, May 2016), https://www.eia.gov/todayinenergy/detail.php?id=26352. EIA defines dry natural gas as the natural gas that remains after: 1) the liquefiable hydrocarbon portion has been removed from the gas stream (i.e., gas after lease, field, and/or plant separation); and 2) any volumes of nonhydrocarbon gases have been removed where they occur in sufficient quantity to render the gas unmarketable. Dry natural gas also is known as consumer-grade natural gas. Refer to the EIA glossary at https://www.eia.gov/tools/glossary/.
5 Adila Mchich, “Henry Hub Natural Gas Futures: Global Benchmark,” CME Group, April 2017, http://www.cmegroup.com/education/henry-hub-natural-gas-futures-global-benchmark.html. Also, see Henry Hub Natural Gas Spot Price, U.S. Energy Information Administration (U.S. Department of Energy, September 2017), https://www.eia.gov/dnav/ng/hist/rngwhhdA.htm.
6 Natural Gas Consumption by End Use, U.S. Energy Information Administration (U.S. Department of Energy, September 2017), https://www.eia.gov/dnav/ng/ng_cons_sum_dcu_nus_a.htm.
7 Tyler Hodge, “Wholesale power prices in 2016 fell, reflecting lower natural gas prices,” U.S. Energy Information Administration (U.S. Department of Energy, September 2017), https://www.eia.gov/todayinenergy/detail.php?id=29512.
8 “Annual Energy Outlook with Projections to 2050,” U.S. Energy Information Administration (U.S. Department of Energy, September 2017), https://www.eia.gov/outlooks/aeo/pdf/0383(2017).pdf.
9 Geographic Terms and Concepts – Census Divisions and Census Regions (U.S. Census, August 2017), https://www2.census.gov/geo/pdfs/maps-data/maps/reference/us_regdiv.pdf
10 Stephen Brown and Mine Yücel, Deliverability and Regional Pricing in U.S. Natural Gas Market, Research Department Working Paper 0802, (Federal Reserve Bank of Dallas, 2008), https://www.dallasfed.org/assets/documents/research/papers/2008/wp0802.pdf.
11 Pennsylvania Natural Gas Marketed Production, U.S. Energy Information Administration (U.S. Department of Energy, September 2017), https://www.eia.gov/dnav/ng/hist/n9050pa2a.htm.
12 “Producer Price Index: Natural gas distribution, Middle Atlantic residential natural gas” (U.S. Bureau of Labor Statistics, September 2017), https://data.bls.gov/timeseries/pcu2212102212101122.
13 Naser Ameen and Terry Yen, “Natural gas pipeline projects lead to smaller price discounts in Appalachian Region.” (U.S. Department of Energy, August 2017), https://www.eia.gov/todayinenergy/detail.php?id=32512.
14 Rob Gutro, “Polar Vortex Enters Northern U.S.,” (National Aeronautics and Space Administration, January 2014) https://climate.nasa.gov/news/1025/polar-vortex-enters-northern-us/.
15 Nick Wiltgen, “Deep Freeze Recap: Coldest Temperatures of the Century for Some,” The Weather Channel, January 10, 2014, https://weather.com/storms/winter/news/coldest-arctic-outbreak-1990s-midwest-south-east-20140103.
16 Data used with permission of Bloomberg Finance L.P.
17 Rob Nikolewski, “With natural gas prices spiking, will you feel the pain?” San Diego Union Tribune, October 17, 2016, http://www.sandiegouniontribune.com/business/energy-green/sd-fi-natgas-prices-20161014-story.html.
18 John Clemente, “New England’s Known Need For More Natural Gas Pipelines”, June 26, 2016, https://www.forbes.com/sites/judeclemente/2016/06/26/new-englands-known-need-for-more-natural-gas-pipelines/#2ac4469130a0.
19 Ibid.
20 Natural Gas Withdrawals and Production, U.S. Energy Information Administration (U.S. Department of Energy, September 2017) https://www.eia.gov/dnav/ng/ng_prod_sum_a_EPG0_FPD_mmcf_a.htm.
21 U.S. Natural Gas Pipeline Network, 2009 (U.S. Department of Energy, 2009), https://www.eia.gov/naturalgas/archive/analysis_publications/ngpipeline/ngpipelines_map.html.
Publish Date: Wednesday, February 21, 2018