An official website of the United States government
An official website of the United States government
The .gov means it's official.
Federal government websites often end in .gov or .mil. Before sharing sensitive information,
make sure you're on a federal government site.
The site is secure.
The
https:// ensures that you are connecting to the official website and that any
information you provide is encrypted and transmitted securely.
In recent years, nuts have become a crucial export commodity, and nuts now play an influential role as a staple among U.S. agricultural exports. Throughout the 2000s, the harvests and sales of almonds, walnuts, pecans, and hazelnuts rose. During this period, almond output in particular flourished and quickly outpaced the growth of other nuts as demand rose among Asian economies and domestic consumers. That demand subsequently led to higher prices, with the price per pound of almonds rising from $1.79 in 2010 to $4.00 in 2014.1 On the supply side, effects from the drought in California slowed the pace of almond production despite continual growth in almond acreage. Yet, between June 2015 and April 2016, prices dropped for 10 consecutive months, a response to stalled foreign demand and a strong U.S. supply. This Beyond the Numbers article examines how almonds have become such an influential U.S. export and details the factors that have contributed to dramatic fluctuations in prices.
The composition of agricultural commodity exports has evolved over time as consumer preferences, population growth, weather conditions, and access to new markets have changed. Before the 1990s, bulk commodities like grains, cotton, oilseeds, and tobacco dominated the makeup of agricultural exports. Since then, exports of high-value products (HVPs) which are often associated with agricultural commodities that are consumer-oriented and require processing such as dairy products, meats, fruits, vegetables, and nuts grew steadily while exports in bulk commodities fluctuated more widely, dependent on global supply and prices.2 According to the United States Department of Agriculture (USDA), both HVP and bulk commodities exports were valued around $20 billion each in 1990. In 2015, HVP exports were valued at more than $90 billion, more than double the value of bulk commodities.3
Although the HVP category includes a diverse variety of agricultural products, nuts have proven to be a highly desired export and play a critical role in the category’s growth.4 The nut share of HVP export value rose between 1990 and 2015, increasing from 4.1 percent to 9.3 percent.5 In 2015, nut exports were valued over $8.4 billion, up from $8.0 billion in 2014 and $7.5 billion in 2013.6 In 2016, the drop in foreign demand for almonds and the corresponding drop in price resulted in a lower value of nut exports, decreasing 6.5 percent to hit just under $7.9 billion.
Nut prices in 2015 and 2016 became a more important component of overall export agricultural prices thanks to the growing dollar value. The nuts and preparations export price index increased 9.4 percent between December 2014 and June 2015. The index then fell between June 2015 and April 2016, declining 37.8 percent over the 10-month period. Export nut prices remained steady for the rest of 2016 relative to previous movements, increasing 2.9 percent between April and December 2016, as shown in chart 1.
Globally, California is the leader in producing and exporting almonds, producing approximately 80 percent of the world’s almond supply.7 In 2007, California farmers maintained 640,000 almond-bearing acres.8 Since then, acreage put towards almonds has increased by at least 20,000 acres every year. In 2016, the California farmers reached 940,000 almond-bearing acres.
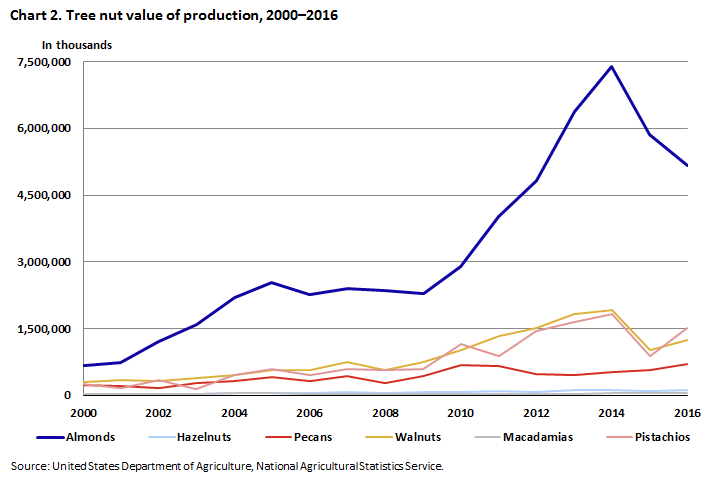
Nuts exports are primarily made up of almonds, hazelnuts, pecans, pistachios, and walnuts. Although all of these products experienced growth, the gains made by almonds, in terms of U.S. production value, eclipsed those made by other nuts as seen in chart 2. According to the USDA, U.S. almond production was valued at $666.5 million in 2000. The second- and third-highest valued tree nut productions at that time were walnuts, valued at $296.4 million, and pistachios, valued at $245.4 million.9 By 2014, almonds peaked at $7.4 billion in production value, while walnuts and pistachios, still maintaining their rank, were valued at $1.9 billion and $1.8 billion, respectively. The production value of almonds would then drop in 2015 to just under $5.9 billion, falling 20.6 percent from the previous year.10 They fell again by 12.1 percent to reach $5.2 billion, in 2106.
U.S. almond exports alone grew from just under $1.8 billion in 2005 to over $4.7 billion in 2015.11 California exported more than $4.6 billion worth of almonds in 2015, accounting for 99 percent of total almond exports from the United States. In comparison, Texas, which is ranked second for states that export almonds, exported $17.7 million worth of almonds in 2015. In 2016, U.S. almond exports recorded their first decline since the U.S. Census Bureau began publishing data for almond exports, falling over $450 million to reach just under $4.3 billion, the lowest level since 2013.
Beginning in 2010, the expanding market for almonds contributed to higher prices through early 2015. In 2010, the price per pound of almonds was $1.79. Prices consistently increased year-over-year by double-digit percentages, reaching $1.99 in 2011, $2.58 in 2012, and $3.31 in 2013. By 2014, prices peaked at $4.00 per pound.
The increasing global popularity of nuts put further upward pressure on prices during the first half of 2015. During the first and second quarter of 2015, export nut prices advanced 2.1 percent and 2.8 percent, respectively. The two main contributors to the global popularity of nuts were expanding Asian economies and shifting consumer preferences (for example, from peanuts and dairy milk to almonds and almond milk).
Despite strong demand during this time, supply was expensive because of harsh growing conditions and logistical disruptions in the 2013–14 season. The export almond market in particular was responsible for a majority of the price movements within the nuts index, as the majority share of exported nuts was almonds and almond-based products.
The long-term growth in demand for almonds can be largely attributed to the expanding economies of Asian countries. As seen in table 1, China, India, Thailand, and Indonesia recorded gross domestic product (GDP) increases over 100 percent between 2005 and 2015.12 During the same period, Asia’s almond imports from the United States experienced a 379.9-percent jump, beginning at $470.2 million and ending just under $2.3 billion.13 Asia became the largest buyer of U.S. almonds, importing 47.6 percent of U.S. almonds in 2015, compared with 26.6 percent imported in 2005. Europe had been the largest importer of U.S. nuts before 2009. Demand there grew by 80 percent between 2005 and 2015, ending with a little over $2 billion in almond imports. The percentage of U.S. almond exports to Europe fell from 63.5 percent to 42.7 percent of the total during that period.
| Country | GDP | U.S. Almond exports |
|---|---|---|
|
China |
379.3% | 206.3% |
|
Hong Kong |
70.7% | 1817.5% |
|
South Korea |
53.3% | 445.0% |
|
Saudi Arabia |
99.0% | 675.9% |
|
India |
150.6% | 311.6% |
|
United Arab Emirates |
91.3% | 553.6% |
|
Taiwan |
39.3% | 280.2% |
|
Malaysia |
99.8% | 272.2% |
|
Thailand |
108.8% | 386.0% |
|
Indonesia |
176.4% | 518.4% |
|
Source: The International Monetary Fund for GDP Growth, U.S. Census Bureau for almond exports by destination. |
||
Changes in domestic consumer preferences was another force behind the growing popularity of almonds and nuts. Dietary preferences shifted through the 2000s in the United States, particularly in the realm of snacking. Changing demographics, such as the rise of two-career families, meant less time for households to plan and cook full meals.14 In 2010, Americans who snack three or more times a day hit 56 percent compared to the 20 percent throughout the 1990s. Between 2000 and 2014, chips sales rose 68 percent, snack bars sales increased 140 percent, and nuts sales advanced 162 percent. Other than snacking, a rise in Americans who followed a vegetarian or vegetarian-like diet, which emphasize the healthful protein content of nuts, helped increase nut purchases.15 Research published during the 2000s not only dismissed claims that nuts were not healthy because of the fat or calorie content, but also tied nut consumption to heart disease prevention, weight management, type 2 diabetes management, and other health benefits.16
By 2012, Americans were consuming 2 pounds of almonds a year on average compared with a quarter of a pound per year in the 1970s.17 Almond products began to grab market share from other well-established food items. Almond milk became the number one substitute of cow’s milk, displacing soy milk as the top substitute.18 In 2015, almond milk sales reached over $894.6 million, while soy milk lagged behind at under $297.7 million. Almond, hazelnut, and cashew butter also began to grow in sales, supplanting some of the peanut butter market.19 Even though Americans were consuming more almonds from 2000 to 2015, countries other than the United States still commanded the majority share of global consumption, accounting for over 70 percent of consumption throughout the same period.20
Weather conditions provided the third main factor for price increases throughout the early 2010s.21 Between 2007 and 2009, California suffered a drought so severe that the governor proclaimed a statewide drought emergency for the first time.22 In 2012 a growing portion of California fell under a comparatively moderate drought. In 2013, 6.6 percent of California was experiencing an extreme drought; in 2014, that number rose to 75.4 percent. Considering California’s role as the world’s almond supplier, the state’s droughts had a much larger impact on the almond market than on the markets of other crops. Even though California farmers were continually increasing almond-bearing acreage throughout the droughts, production staggered.23 After increasing almond production from 1.4 billion pounds in 2009 to 2.0 billion pounds in 2011, it fluctuated between 1.8 billion and 2.0 billion, not reaching above its 2011 mark until 2016.
In addition to the other reasons that almond prices increased, the beginning of 2015 saw a number of temporary port closures on the west coast that briefly restricted supply, further contributing towards the price increase.24
The factors that contributed to the rise in export nut prices, such as strengthening Asian economics and poor weather conditions, now reversed and led to the fall in prices that began after June 2015. Export nut prices recorded sharp declines in the second half of 2015, breaking the historic rise over the previous decade. Export nut prices fell 9.5 percent over the 4 months following the peak in June 2015, after which the pace of the decreases accelerated, falling 31.3 percent between October 2015 and April 2016. Prices turned slightly upward again in May 2016. Although almonds experienced the majority of the price cuts, they were able to maintain their trade value position within the nut export mix.
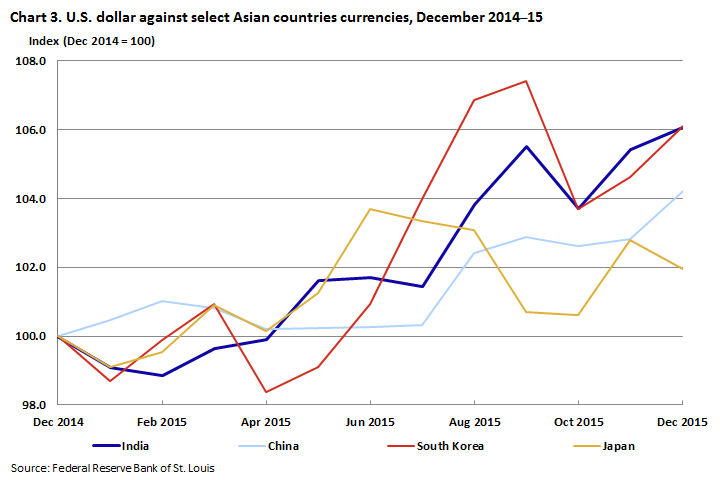
Slowing demand from Asia, China in particular, reduced the foreign demand that originally propped up the demand and value of almonds. On June 12, 2015, the Shanghai Stock Exchange Composite Index, which is the primary stock market index in China, reached a peak.25 After peaking, the index then trended downward and lost 43.3 percent of its value by August 26. In response to the drop, China devalued their currency in mid-August, making almond imports more expensive.26 Overall, the Chinese yuan fell 4.1 percent against the dollar in 2015.27 As chart 3 shows, other notable 2015 currency depreciations occurred in India, Japan, and South Korea, all of which made almond imports more expensive. In 2015, the Indian rupee, Japanese yen, and South Korean won depreciated against the dollar by 6.1 percent, 1.9 percent, and 6.1 percent, respectively.
Although California’s drought continued throughout 2015, winter rains helped alleviate the water shortage. In December 2015, 44.8 percent of California was still experiencing what’s classified as an “exceptional drought,” while 24.22 percent was experiencing “extreme drought.” By the end of March 2016, those portions of California fell to 34.7 percent and 20.5 percent, respectively.28 During this time, the almond trees woke from dormancy, and the almond fruits themselves began the process of maturing.29 This combination of better water conditions and maturing almonds added to the downward pressure on almond export prices during the first calendar-quarter of 2016. Almond production ultimately broke its 2011 record, increasing from 1.9 billion pounds in 2015 to 2.1 billion pounds in 2016.
The changes in Asian economies, domestic consumer preference, and growing conditions that once strongly influenced nut prices finally found a relative equilibrium. After the continuous declines ended in April 2016, nut prices slightly rose and held fairly steady for the remainder of the year, advancing 2.9 percent between April and December 2016. The first calendar-quarter of 2017 continued to showcase this stability with prices remaining generally at the same levels they were during the second half of 2016. Even though nut prices have leveled, they remain susceptible to supply and demand factors, and continue to play an important role within the agricultural exports mix.
This Beyond the Numbers article was prepared by Hayden Swegal, Economist in the Office of Price and Living Conditions, Email:Swegal.Hayden@bls.gov, Telephone: (202) 691-5794.
Upon request, the information in this article will be made available to individuals who are sensory impaired. Voice phone: (202) 691-5200. Federal Relay Service: 1-800-877-8339. This article is in the public domain and may be reproduced without permission.
Hayden Swegal, “The rise and fall of almond prices: Asia, drought, and consumer preference,” Beyond the Numbers: Global Economy, vol. 6, no. 12 (U.S. Bureau of Labor Statistics, October 2017), https://www.bls.gov/opub/btn/volume-6/the-rise-and-fall-of-almond-prices-asia-drought-and-consumer-preference.htm
1 "Almonds, price received, measured in $/lb." (U.S. Department of Agriculture, National Agricultural Statistics Service, July 21 2017), retrieved from https://quickstats.nass.usda.gov/.
2 "U.S. Agricultural Trade, Exports" (United States Department of Agriculture, Economic Research Service, November 3, 2016).
3 "Value of U.S. agricultural exports by level of processing for bulk and high-value products, by calendar year" (United States Department of Agriculture, Economic Research Service, April 17, 2017), https://www.ers.usda.gov/data-products/foreign-agricultural-trade-of-the-united-states-fatus/calendar-year/.
4 "Interactive Chart: The Evolution of U.S. Agricultural Exports Over the Last Two Decades" (United States Department of Agriculture, Economic Research Service, November 3, 2016), https://www.ers.usda.gov/topics/international-markets-trade/us-agricultural-trade/interactive-chart-the-evolution-of-us-agricultural-exports-over-the-last-two-decades/.
5 "Exports, World Trade, Tree Nuts" U.S. Department of Agriculture, Foreign Agricultural Service, Global Agricultural Trade System, January 20, 2017), retrieved from https://apps.fas.usda.gov/gats/ExpressQuery1.aspx.
6 "Fruit and Tree Nut Data" (United States Department of Agriculture, Economic Research Service, January 20, 2017), https://www.ers.usda.gov/data-products/fruit-and-tree-nut-data.aspx.
7 2015 Almond Almanac (Almond Board of California, 2015), http://www.almonds.com/sites/default/files/content/attachments/2015_almanac.pdf.
8 Almonds, acres bearing" (U.S. Department of Agriculture, National Agricultural Statistics Service, July 21 2017), retrieved from https://quickstats.nass.usda.gov/.
9 Fruit and Tree Nut Yearbook 2016. (United States Department of Agriculture, Economic Research Service, October 28, 2016), http://usda.mannlib.cornell.edu/usda/ers/89022/2016/FruitandTreeNutYearbook2016.pdf.
10 "Almonds, utilized production, measured in $" (U.S. Department of Agriculture, National Agricultural Statistics Service, July 21 2017), retrieved from https://quickstats.nass.usda.gov/.
11 "State Exports by HS Commodities, Almonds 080211 & 080212" (U.S. Census Bureau, USA Trade Online, January 20, 2017), retrieved from https://usatrade.census.gov/.
12 "Report for Selected Countries and Subjects, GDPs" (International Monetary Fund, January 20, 2017), http://www.imf.org/external/pubs/ft/weo/2016/01/weodata/weorept.aspx?sy=2000&ey=2015&ssd=1&sort=country&ds=.&br=0&pr1.x=42&pr1.y=9&c=512.
13 "State Exports by HS Commodities, Almonds 080211 & 080212" (U.S. Census Bureau, USA Trade Online, January 20, 2017), retrieved from https://usatrade.census.gov/.
14 Mike Esterl, "Forget Dinner. It's Always Snack Time in America," The Wall Street Journal, July, 2 2014, https://www.wsj.com/articles/forget-dinner-its-always-snack-time-1404240759.
15 Tatge, Mark. “Vegetarian Foods Plant Stronger Sales.” NBCNews.com, NBCUniversal News Group, September 17, 2004, www.nbcnews.com/id/6008949/#.Wcq2CrJ95hE.
16 "Official Response to World Health Organization (WHO)..." (World Health Organization, International Tree Nut Council, June 15, 2002), http://www.who.int/dietphysicalactivity/media/en/gsfao_cmo_060.pdf.
17 Roberto A. Ferdman, "The Rise of the American Almond Craze in One Nutty Chart," The Washington Post, August 6, 2014, https://www.washingtonpost.com/news/wonk/wp/2014/08/06/the-rise-of-the-american-almond-craze-in-one-nutty-chart/?utm_term=.b4bf2b8c69d0.
18 "Americans Are Nuts for Almond Milk," Insights. (The Nielsen Company, March 31, 2016), https://nielseniq.com/global/en/insights/analysis/2016/Americans-are-nuts-for-almond-milk/.
19 Anne Marie Chaker, "Alternatives to Peanut Butter Are Taking Over Lunch," The Wall Street Journal, October 6, 2015, https://www.wsj.com/articles/alternatives-to-peanut-butter-are-taking-over-lunch-1444148988.
20 "Almonds, shelled basis, domestic consumption" U.S. Department of Agriculture, Foreign Agricultural Service, July 25, 2017), retrieved from https://apps.fas.usda.gov/psdonline/app/index.html#/app/advQuery.
21 "California’s Drought of 2007–2009" (California Department of Water Resources, September 2010).
22 "Tabular Data Archive" (United States Drought Monitor, University of Nebraska–Lincoln, January 20, 2017), http://droughtmonitor.unl.edu/MapsAndData/DataTables.aspx?state%2CCA.
23 "Almonds, utilized production, measured in lb.” (U.S. Department of Agriculture, National Agricultural Statistics Service, July 24, 2017), retrieved from https://quickstats.nass.usda.gov/.
24 Chris Isidore, "West Coast Ports Shut down as Labor Dispute Heats up," CNNMoney, February 14, 2015, http://money.cnn.com/2015/02/12/news/companies/port-shutdown/.
25 "(000001.SS) Interactive Stock Chart | SSE Composite Index Stock - Yahoo Finance," Yahoo!, https://finance.yahoo.com/chart/000001.SS#eyJtd.
26 "China Rattles Markets With Yuan Devaluation," Bloomberg, August 10, 2015, https://www.bloomberg.com/news/articles/2015-08-11/china-weakens-yuan-reference-rate-by-record-1-9-amid-slowdown.
27 "FRED Graph Observations" (Federal Reserve Bank of St. Louis, Economic Research Division, January 20, 2017), https://fred.stlouisfed.org/series/EXCHUS.
28 "Tabular Data Archive" (United States Drought Monitor, University of Nebraska–Lincoln, January 20, 2017), http://droughtmonitor.unl.edu/MapsAndData/DataTables.aspx?state%2CCA.
29 "Almond Lifecycle" (Almond Board of California, 2017), http://www.almonds.com/consumers/about-almonds/almond-lifecycle#tc-growing-up.
Publish Date: Thursday, October 12, 2017