An official website of the United States government
An official website of the United States government
The .gov means it's official.
Federal government websites often end in .gov or .mil. Before sharing sensitive information,
make sure you're on a federal government site.
The site is secure.
The
https:// ensures that you are connecting to the official website and that any
information you provide is encrypted and transmitted securely.

The Bureau of Labor Statistics (BLS) is celebrating the first anniversary of experimental disease-based price indexes, which adjust expenditures on disease for inflation. Statistical agencies have long collected price information on medical procedures, drugs, equipment, and services, but the cost of treating a patient is typically some combination of these goods and services. Many users of the Federal Statistical System have asked that medical care spending be reported on a disease basis.1 Creating price indexes on a disease basis helps provide greater understanding of the cost of care for a given condition.
The indexes are the result of a long-term research effort by staff in the BLS Office of Prices and Living Conditions. Using existing data products, we met the need for a new product, without incurring more data collection expenses. We construct the experimental indexes using two publicly available datasets: 1) the monthly producer price index (PPI) and consumer price index (CPI) published by BLS and 2) the Medical Expenditure Panel Survey (MEPS) published by the Agency for Healthcare Research and Quality, U.S. Department of Health and Human Services. The monthly BLS data allow our experimental disease-based price indexes to be timely. MEPS supplies data on the use of medical service and products for the treatment of each disease.
After a year of constructing the experimental disease-based index we reveal the wealth of information that the data show. This Beyond the Numbers article examines the reasons for reporting by disease rather than by service and explains the reasons behind the spending growth for each disease.
Although healthcare statistics that are generated on a goods and services basis (i.e., hospitals and doctor visits) are important, we can learn more information if we add statistics on a disease basis. To get the fullest understanding of our healthcare economy, we need both sets of indexes. Users need the additional information to understand how much Americans are getting for each healthcare dollar that we spend.
People use medical goods and services to heal from diseases and to avoid getting them in the first place. When medical spending price indexes are broken out by disease, we can tell how much spending is growing for each disease, how much of the medical spending growth for each disease comes from price growth (inflation), and how much comes from increased medical output.2 Further, we can break down medical output growth to tell how much of this growth comes from greater prevalence for that disease and how much comes from greater output per patient treated.
Because healthcare accounts for 17.8 percent of the economy in 2015, it is important to be well-informed about this sector.3 Our medical goods and services PPI and CPI price indexes still serve a very important purpose in telling us how prices are increasing for each medical good and service. Our disease-based price indexes are constructed using the same prices for medical goods and services. When disease-based price indexes are growing at a slower pace than the medical goods and services prices, we learn that medical decision makers are using these medical goods and services more efficiently.
An additional advantage to reporting price indexes by disease is that we are able to account for the impact of substitution across medical goods and services in the treatment of diseases. Over the past four decades, medical technology has changed, and along with those changes came a shift from inpatient hospitals to outpatient facilities. For example, in the 1970s, most cataract and hernia surgeries were done in an inpatient hospital; today, these surgeries are done in an outpatient facility. In addition, more surgical procedures, such as biopsies, are done in a simple office visit rather than at an outpatient center. And treatment by physicians and hospitals has been substituted by the use of pharmaceuticals for many diseases. For example, when treating depression today, there is less reliance on therapy visits and more on antidepressants than there was 30 years ago. Similarly, new pharmaceuticals on the market for the treatment of Hepatitis C and cancer have greatly reduced the need for inpatient hospital treatment of this disease. All these substitutions generate savings. Disease-based price indexes account for these cross-industry or cross-product substitutions, whereas the traditional goods and services indexes do not.
When we compare prices indexes using the traditional medical goods and services basis to disease-based price indexes, there are important differences. Chart 1 compares the 17-year growth between the two indexes. The traditional index has grown 59 percent from 1999 to 2016, while the disease-based price index has grown 38 percent. A closer look shows that in the past decade, disease-based price indexes did not always grow more slowly than the traditional indexes. In 2000, 2001, and 2004, the disease-based price indexes grew more rapidly than the traditional indexes. There can be times when a more expensive option is substituted for a less expensive one when treating a disease. For example, from 2000 to 2006, the MEPS data show that there was an increase in the number of uninsured people, and the only medical resource available to many of them was the emergency room. This is an expensive way to treat diseases such as respiratory infections, dermatitis, and asthma.4
The major reason that the experimental disease-based price indexes are growing at a slower rate, in general, than the traditional medical index is that there have been large decreases in the number of medical services to treat most diseases and there has been a continued substitution to cheaper medical services. Table 1 depicts these changes. The weighted averages of these drops are listed at the bottom of table 1.5 Interestingly, there is a greater drop for outpatient services rather than inpatient services. This is the result of a trend in which an increasing number of outpatient procedures are done in a physician’s office at a lower price. While there is a small drop in the average utilization for emergency room services, they did rise for infections, respiratory, and dermatological diseases. Greater use of the emergency room to treat diseases that could be treated at a lower cost through a physician visit tells us that not all treatments are the most cost-effective option.
| Disease | Percent change in physician visits | Percent change in outpatient visits | Percent change in inpatient hospital visits | Percent change in emergency room visits |
|---|---|---|---|---|
| Weighted average across diseases | -8.98 | -26.73 | -14.72 | -4.47 |
| Infectious and parasitic diseases | -13.61 | -43.24 | 4.05 | 12.75 |
| Neoplasms | -12.84 | -42.20 | -34.23 | -33.31 |
| Endocrine, nutritional, and metabolic diseases and immunity disorders | -22.96 | -46.31 | -39.20 | -21.60 |
| Diseases of the blood and blood-forming organs | -17.20 | -16.02 | -48.04 | -1.51 |
| Mental disorders | -13.06 | -37.58 | -41.88 | -35.58 |
| Diseases of the nervous system and sense organs | -4.15 | -16.41 | -14.69 | -12.87 |
| Diseases of the circulatory system | -31.91 | -46.04 | -42.35 | -31.53 |
| Diseases of the respiratory system | -8.89 | 7.65 | 22.28 | 18.49 |
| Diseases of the digestive system | -14.65 | -10.54 | -7.37 | 21.68 |
| Diseases of the genitourinary system | 2.89 | -56.56 | -7.73 | 22.58 |
| Complications of pregnancy, childbirth, and the puerperium | -4.61 | -7.18 | -7.23 | 6.30 |
| Diseases of the skin and subcutaneous tissue | -2.85 | 54.38 | 8.27 | 37.64 |
| Diseases of the musculoskeletal system and connective tissue | -4.80 | -37.39 | -1.84 | -15.07 |
| Congenital anomalies | -1.30 | -61.50 | -58.78 | -8.56 |
| Certain conditions originating in the perinatal period | -20.47 | -36.73 | 13.09 | -72.74 |
| Injury and poisoning | 0.60 | -33.93 | -4.11 | -6.70 |
| Other conditions | 17.67 | 16.43 | -4.98 | 8.17 |
| Residual codes and unclassified | -14.67 | -33.34 | -10.94 | -36.03 |
| Source: The Medical Expenditure Panel Survey’s Conditions File, Agency for Healthcare Research and Quality. | ||||
Reporting medical statistics by disease can tell us how much of the national expenditure growth for each disease came from price growth (inflation), population growth, changes in prevalence, and per treated output growth. Table 2 provides us with this breakdown. It shows that these values vary widely across disease. Looking at these variations tells us the importance of index-by-disease—because what is true of one may not be true of another.
| Disease | Nominal expenditure growth | Inflation | Real expenditures | Population growth | Prevalence growth | Per capita output growth |
|---|---|---|---|---|---|---|
| All diseases | 1.54 | 1.16 | 1.32 | 1.09 | 1.18 | 1.03 |
| Infectious and parasitic diseases | 1.82 | 1.44 | 1.27 | 1.09 | 1.05 | 1.12 |
| Neoplasms | 1.54 | 0.994 | 1.55 | 1.09 | 1.21 | 1.18 |
| Endocrine nutritional and metabolic diseases and immunity disorders | 2 | 1.11 | 1.81 | 1.09 | 1.72 | 0.969 |
| Diseases of the blood and blood-forming organs | 2.18 | 1.37 | 1.58 | 1.09 | 1.4 | 1.04 |
| Mental disorders | 2 | 0.965 | 2.07 | 1.09 | 1.39 | 1.37 |
| Diseases of the nervous system and sense organs | 0.969 | 1.22 | 0.797 | 1.09 | 1.06 | 0.69 |
| Diseases of the circulatory system | 1.33 | 0.92 | 1.44 | 1.09 | 1.39 | 0.952 |
| Diseases of the respiratory system | 1.63 | 1.33 | 1.23 | 1.09 | 1.02 | 1.1 |
| Diseases of the digestive system | 2.05 | 1.31 | 1.56 | 1.09 | 0.916 | 1.57 |
| Diseases of the genitourinary system | 1.58 | 1.26 | 1.25 | 1.09 | 1.01 | 1.14 |
| Complications of pregnancy, childbirth, and the puerperium | 1.8 | 1.17 | 1.54 | 1.09 | 0.928 | 1.53 |
| Diseases of the skin and subcutaneous tissue | 1.63 | 1.28 | 1.27 | 1.09 | 1.07 | 1.09 |
| Diseases of the musculoskeletal system and connective tissue | 2.04 | 1.03 | 1.99 | 1.09 | 1.48 | 1.23 |
| Congenital anomalies | 1.22 | 0.778 | 1.56 | 1.09 | 1.18 | 1.21 |
| Certain conditions originating in the perinatal period | 2.26 | 2.28 | 0.991 | 1.09 | 1.42 | 0.642 |
| Injury and poisoning | 1.24 | 1.32 | 0.938 | 1.09 | 1.03 | 0.84 |
| Other conditions | 1.38 | 1.55 | 0.888 | 1.09 | 1.17 | 0.694 |
| Residual codes and unclassified | 1.21 | 1.01 | 1.2 | 1.09 | 0.866 | 1.27 |
| Dental diseases | 1.29 | 1.48 | 0.875 | 1.09 | 0.961 | 0.836 |
| Sources: U.S. Bureau of Labor Statistics; U.S. Census Bureau; Agency for Healthcare Research and Quality. | ||||||
Table 2 lists the ratio of 2013 expenditure, prices, population, prevalence, and output to the 2003 numbers, illustrating changes over the past decade. The nominal expenditure growth ratio varies by disease from .96 to 2.26. The highest growth is for conditions originating in the perinatal period (the period around the time of birth). However, this condition has the smallest national expenditure share and therefore is not the disease contributing the most to healthcare spending. Endocrine, nutritional, metabolic (includes diabetes), musculoskeletal, and digestive diseases are growing the most rapidly.
The cause for the expenditure growth for these diseases varies. Endocrine, metabolic, and musculoskeletal spending growth is mostly driven by prevalence growth.6 In contrast, expenditure growth for digestive diseases is being driven by output-per-patient growth and from a decline in the growth in prevalence rates, which allows 57 percent more output per patient. The diseases that have experienced the most rapid increases in inflation are perinatal period diseases, dental diseases, infections, and injuries. Table 2 has one column for the population growth that is 9 percent for all diseases and another column for the growth in the disease prevalence rate; a relative measure that tells us the percentage of the population that has a disease. It is more appropriate to measure the prevalence rate than the number of people with a disease. If the population is growing, the growth in the number of people with a particular disease could be the result of both the population growth and the change in the prevalence rate.7 It is striking to note that in table 2 all conditions except pregnancy and diseases of the digestive system have growing prevalence.8 These data point to the fact that our nation is getting relatively sicker. One reason that pregnancy prevalence has dropped is that the birth rate has fallen, as depicted in chart 2. Since the Great Recession in 2008, the U.S. birthrate has dropped while the death rate has climbed.
There is an ongoing national debate about what’s causing the rapid rise in healthcare spending. Some conclude that it is cost increases and others argue that it is increased disease prevalence.9 Those who believe that rising prevalence is the key driving factor argue that rising obesity has increased the risk and prevalence of many diseases such as diabetes and heart disease.10 The evidence in the index shows that both of the above are contributing to the rise in national healthcare spending.
Chart 1 shows that average prices continue to grow regardless of the medical price index used. However, table 2 shows that price increases are not the only factor driving healthcare spending. Rising prevalence (except for pregnancy) is also playing a role. Chart 3 plots both the national mean age and obesity rate. Both are rising and are leading to increased risks for diseases that range from dementia to diabetes.
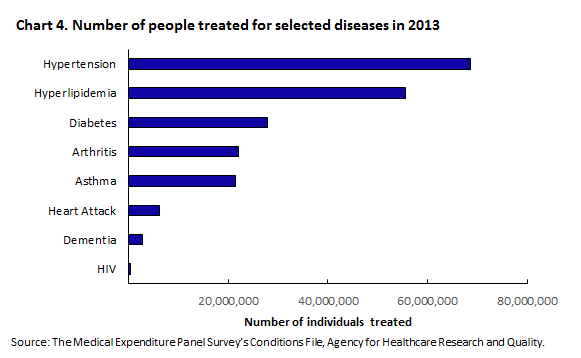
While chart 4 gives us the number of people who are treated for various diseases, chart 5 plots the prevalence growth rate for these diseases. From these two charts, we find that while diabetes has the most rapid growth rate, fewer people are treated for diabetes than for hypertension, which is growing slightly less rapidly than diabetes.
Dementia currently is much less prevalent than asthma, but as the U.S. population continues to age, there will be increased risk for this disease. According to the Alzheimer's Association, “Alzheimer’s is the most expensive disease in America, costing more than cancer and heart disease.”11 Data from the Alzheimer’s Association say that “average per-person Medicare spending for seniors with Alzheimer’s is almost 3 times higher than average per-person spending for all other seniors. Under Medicaid, spending is, on average, 19 times higher.” Today, there are about 5.2 million individuals treated for this disease. By 2050, Alzheimer’s is estimated to triple. Unfortunately, medical research has not found effective ways to treat this disease.12
There are other diseases that are growing rapidly, in part, due to higher risks from aging, such as diabetes, cancer, hyperlipidemia (high LDL cholesterol), and hypertension. These are also some of the most common diseases. Self-care activities can also reduce the risk of these diseases. For example, use of sun screen, oat bran, gym memberships, and olive oil all prevent future diseases. However, these self-care purchases and activities are not part of federal healthcare statistics because none of these is considered a healthcare item. BLS and all national medical care statistics focus on the repair after the disease rather than the prevention of the disease. This is even true of the BLS experimental disease-based price indexes because MEPS does not report these self-care activities.
With the new disease-based reporting for federal statistics, users will be able to monitor how both increased aging and obesity are affecting U.S. medical spending. Healthcare experts can then use these statistics to plan for the aging of the population and to set strategies to reduce the national obesity rate. We are optimistic that the new index can help us better monitor preventive activities and better measure the effectiveness of these activities by tracking cost savings when diseases are prevented.
After 1 year of compiling the data, we can see there are several reasons that the experimental disease-based index is an important accomplishment. First, they show what can happen when multiple agencies combine resources to deliver a new and better product. The new indexes provide additional information on medical care inflation and can give us a better understanding of the reasons behind medical expenditure growth.13 Second, reporting statistics by disease can enhance understanding of the healthcare economy.
While we have made much progress in development of BLS disease-based price indexes, our work is not done. We have yet to adjust our disease-based price indexes for quality changes in healthcare. New innovations occur yearly. There are less invasive ways to do surgery, and new pharmaceutical products arrive that revolutionize the way we treat diseases such as Hepatitis C and cancer.14 It is important for BLS to account for these changes. While the prices for these innovations are high, they do produce large benefits. The challenge lies in both measuring and valuing the better health outcomes from these innovations.
This Beyond the Numbers article was prepared by Ralph Bradley. For additional information, you may contact Brett R. Matsumoto, research economist in the Office of Prices and Living Conditions, U.S. Bureau of Labor Statistics. Email: matsumoto.brett@bls.gov. Telephone: (202) 691-6575.
Information in this article will be made available upon request to individuals with sensory impairments. Voice phone: (202) 691-5200. Federal Relay Service: 1-800-877-8339. This article is in the public domain and may be reproduced without permission
Ralph Bradley, “The cost of care: new insights into healthcare spending growth,” Beyond the Numbers: Prices & Spending, vol. 6, no. 7 (U.S. Bureau of Labor Statistics, June 2017), https://www.bls.gov/opub/btn/volume-6/cost-of-care.htm
1 The Federal Statistical System constitutes the many federal agencies that generate and publish national statistics such as BLS, the Bureau of Economic Analysis, and the Census Bureau. As early as 1967, the U.S. Department of Health, Education, and Welfare called for reporting on a disease basis in its “A Report to the President on Medical Care Prices,” U.S. Government Printing Office (page 13). In that same year, the American Economic Review also published an article advocating the use of disease based price indexes. See A. A. Scitovsky, "Changes in the Costs of Treatment of Selected Illness, 1951–65," American Economic Review LVII (1967), 1182–1195.
2 Here output refers to the amount or quality of treatment.
3 This is a percentage of GDP that is spent on healthcare. It is computed yearly by the Centers of Medicare and Medicaid Services. See https://www.cms.gov/research-statistics-data-and-systems/statistics-trends-and-reports/nationalhealthexpenddata/nationalhealthaccountshistorical.html.
4 The Network for Excellence in Health Innovation (NEHI) estimates that over use of emergency rooms costs our economy $38 billion per year. See http://www.nehi.net/writable/publication_files/file/nehi_ed_overuse_issue_brief_032610finaledits.pdf.
5 The weights are the expenditures on each disease.
6 Prevalence growth is the growth in the ratio of the number of people with a disease to the total population.
7 Suppose that the population of country A is 100 million and it has 20 million with disease B and country C has a population of 50 million and it has 20 million with disease B. The prevalence rate of disease B is then 20 percent for country A and 40 percent for country C. So while countries A and C have the same number of people with disease B, country C is the “sicker” country.
8 While pregnancy is not a disease, it is a condition that it treated with medical services such as an OB-GYN physician.
9 C.S. Roehrig and D.M., Rousseau, "The Growth in Cost Per Case Explains Far More of U.S. Health Spending Increases than Rising Disease Prevalence," Health Affairs 30, no. 9 (September 2011), pp. 1657‒1663; Martha Starr, Laura Dominiak, and Ana Aizcorbe. "Decomposing Growth In Spending Finds Annual Cost of Treatment Contributed Most to Spending Growth, 1980‒2006." Health Affairs 33, no.5 (May 2014), pp. 823‒831.
10 K.E. Thorpe, C.S. Florence, and P. Joski, "Which Medical Conditions Account for the Rise in Health Care Spending?" Health Affairs (August 2004).
11 “Factsheet: Costs of Alzheimer’s to Medicare and Medicaid,” Alzheimer’s Association (March 2017), http://act.alz.org/site/DocServer/2012_Costs_Fact_Sheet_version_2.pdf?docID=7161.
12 Eli Lilly abandoned its attempt to develop a promising treatment, called solanezumab, when it failed in clinical trials. In July 2014, Pfizer and Johnson & Johnson announced they would stop development of their Alzheimer's drug because it failed in two late-stage clinical trials. A Scientific American article at https://www.scientificamerican.com/article/why-alzheimer-s-drugs-keep-failing/ gives a good description of the challenges in treating Alzheimer's.
13 The U.S. Bureau of Economic Analysis also has a Health Satellite Account that reports both expenditures and price indexes by disease. See https://www.bea.gov/national/health_care_satellite_account.htm.
14 The Remarkable Cancer Treatment That Helped Jimmy Carter Combat Brain Tumor. See https://abcnews.go.com/Health/remarkable-cancer-treatment-helped-jimmy-carter-combat-brain/story?id=37467459.
Publish Date: Wednesday, June 14, 2017