An official website of the United States government
An official website of the United States government
The .gov means it's official.
Federal government websites often end in .gov or .mil. Before sharing sensitive information,
make sure you're on a federal government site.
The site is secure.
The
https:// ensures that you are connecting to the official website and that any
information you provide is encrypted and transmitted securely.
The Bureau of Labor Statistics (BLS) import price index measures changes in prices of goods purchased from abroad by residents of the United States. The index declined throughout most of 2015 and ended the year with an 8.3-percent decrease from the December 2014 figure. Declines in prices of commodities such as oil, gold, other precious metals, and copper were an important factor behind the fall in the import price index. Those declines, as well as declines in prices for finished goods, were all caused in part by the strengthening of the U.S. dollar against the foreign currencies of the nation’s major trading partners in 2015. When the U.S. dollar strengthens, or appreciates, imports from other countries cost less. Each dollar buys more foreign currency. This change in the relative value of the dollar effectively lowers the dollar price that U.S. importers pay for items bought from other countries.
The Trade Weighted U.S. Dollar Index, a weighted average of the foreign exchange value of the U.S. dollar against the Major Currencies Index, rose 11.8 percent from December 2014 to December 2015.1 Positive U.S. employment reports, combined with an overall healthy U.S. economy, led to expectations of an increase in the U.S. Federal Reserve Federal Funds interest rate. The Federal Reserve raised the interest rate by a quarter of a percent in December 2015, cementing the dollar’s strength by year’s end.2 International factors also influenced the dollar’s appreciation relative to other currencies. Chief among such factors were slower growth in China’s economy, weak global growth and commodity demand, and instability in the Middle East.
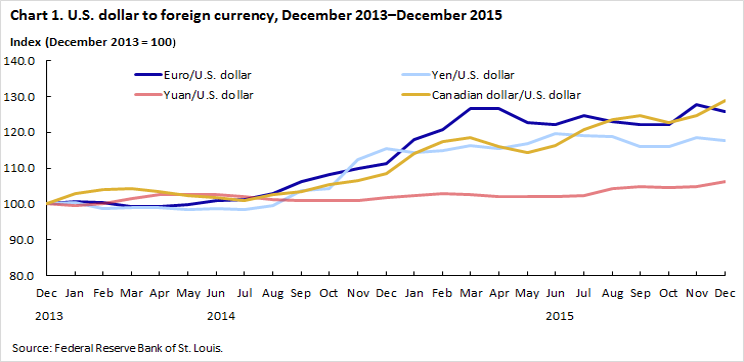
At the same time these domestic and global conditions drove the value of the U.S. dollar higher, the major currencies weakened, or depreciated relative to the dollar, because of poor performing economies, and resulting expansionary monetary policy. Chart 1 shows the movements of four major currencies relative to the U.S. dollar in 2015: the European Union euro, the Japanese yen, the Chinese yuan, and the Canadian dollar. In all instances, the amount of foreign currency needed to purchase a dollar rose. The change in China’s relative values was less pronounced, given the nature of Chinese exchange rate policy.
The Eurozone economy during 2014 saw little output and meager employment growth. The European Central Bank (ECB) expanded quantitative easing (QE). A recent Central Bank strategy, QE had been adopted earlier by the Bank of Japan, the U.S. Federal Reserve, and the Bank of England, to create money by buying government debt (i.e., government bonds). The debt then provides a mechanism for the government to invest in economic and job growth. The ECB set an inflation target of just below 2 percent and a goal of a 1.5-percent increase in the Eurozone’s GDP.3 The bank put an extra 60 billion euros into the system each month, more than 4 times the 13 billion euros previously committed prior to 2015.4 The fundamental weakness of the European economy and the expansionary monetary policy fed the depreciation of the euro, which weakened 13.2 percent against the U.S. dollar in 2015.
The Japanese yen also weakened throughout the year, as the currency had in 2014. After Japanese Prime Minister Shinzō Abe was elected in 2012, the Bank of Japan instituted a monetary stimulus program nicknamed “Abenomics” in an effort to reverse the trend of deflation and stagnation.5 To counter the impact of deflation, which kept wages and prices low, a target of 2-percent inflation was set to help boost prices, increase profits for businesses, and pass a bigger share of earnings on to workers, who could presumably be counted on to spend more on goods and services.6 The expansionary policy was expected to depreciate the yen and, as a result, boost cheaper priced exports. Since 2013, the Japanese yen has in fact dropped 33.9 percent against the U.S. dollar, yet much of the remainder of the plan has not been as successful. For example, wages have remained largely unchanged, and inflation has not met the 2-percent target.
The Chinese economy faced a weak export sector, a volatile stock market, and a slowdown in growth in 2015. Late in the year, the People’s Bank of China (PBOC) changed the country’s exchange rate policy on how to determine the value of the yuan, with the objective of boosting the Chinese export sector. China’s central bank buys and sells yuan to keep its value relative to other currencies stable. On August 11, 2015, the PBOC began a new policy according to which the yuan would be based on the midpoint of the previous day’s closing price. The policy brought the yuan more in line with the market, devaluing the yuan by 1.9 percent. The devaluation pushed the yuan to a 4-year low and was the biggest one-day fall in the yuan since a massive devaluation in 1994.7
The resource-rich Canadian economy was affected by low world prices for oil and other commodities. Exports have a relatively larger footprint in the Canadian economy than in other major economies, and the Canadian dollar is closely tied to the U.S. dollar. Weak global growth constrained demand for Canada’s exports, and declining dollar-values of oil reduced the amount of revenues that were collected from world sales. Exports are 25.1 percent of total Canadian economic output, compared with 13.3 percent for China, 12.9 percent for Japan, and 8.4 percent for the United States. Oil is Canada’s largest export commodity, accounting for 19 percent of total exports.8 Brent Crude Oil Futures, the global benchmark for oil prices, dropped 35 percent, to $37.28 a barrel, in 2015—the third straight year this oil market indicator fell.9 Steep declines in both demand and prices pushed the value of the Canadian dollar down to the currency’s lowest level in 13 years.
In calculating import price indexes, exchange rates have a direct impact on goods priced in a foreign currency. Only 5 percent of goods included in the import price index are priced in a foreign currency, while the other 95 percent are priced in U.S. dollars. Of the 5 percent of import goods that are bought with foreign currency, approximately two-thirds fall into the category of either capital goods or consumer goods; the remaining one-third falls into one of three categories: industrial supplies and materials; automotive vehicles; and foods, feeds, and beverages.
The BLS import price indexes are U.S-dollar–based price indexes. In order to calculate them, all prices must be converted into U.S. dollar terms. Therefore, products that are priced in foreign currency will be directly affected by exchange rate fluctuations when those prices are converted into U.S dollars. Over 2015, as the U.S. dollar appreciated, or strengthened, the same dollar could buy more euros. Alternatively, fewer dollars could be used to purchase items whose price did not change in the foreign currency. Table 1 gives an example in which a company’s reported price for a product, in euros, did not change. After factoring in the euro-to-U.S.-dollar exchange rate, the product’s price in U.S. dollars actually decreased in periods 2 and 3.
| Period | Price in Euro | Exchange rate, euros to dollars | Price in U.S. dollars | Percent change |
|---|---|---|---|---|
| Period 1 | € 10.00 | 0.83 | $12.05 | … |
| Period 2 | € 10.00 | 0.87 | $11.49 | -4.65 |
| Period 3 | € 10.00 | 0.91 | $10.99 | -4.35 |
| Source: U.S. Bureau of Labor Statistics. | ||||
In addition to the direct impact of changes in the value of the dollar on the price of items, an indirect price impact can occur when a foreign exporter of U.S.-dollar–priced U.S. imports gets more of the foreign currency in return for the item priced in dollars and subsequently adjusts the U.S. dollar price to be more competitive for the U.S. purchaser. Over time, foreign exporters to the United States lower the dollar price in order to increase the competitiveness of their products in the United States, which then passes some of the exchange rate changes on to the U.S. importers. In that case, U.S. importers will experience even lower dollar prices while foreign exporters are still able to get more of their own currency because of the increased purchasing power of the dollar.
For example, as shown in table 2, an item imported into the United States from France is priced at $10.00 and the exchange rate between euros and U.S. dollars changes from 0.83 to 0.91. Initially, the amount of euros the foreign exporter gets for the product increases from €8.30 to €9.10. In a subsequent sale, if the foreign exporter lowers the price to $9.50, the product becomes more competitive in the U.S. market while the foreign exporter now receives €8.65 for the item—more than before the change in the exchange rate. How much the price change in the foreign currency affects the dollar price of the item is called the pass-through rate of the currency change.10 Pass-through rates can be affected by a number of factors, including how long the change in the exchange rate lasts and whether there are any barriers to changing prices, such as long-term contracts.11
| Period | Price in U.S. dollars | Exchange rate, euros to dollars | Price in euros | Percent change to U.S. importer |
|---|---|---|---|---|
| Period 1 | $10.00 | 0.83 | € 8.30 | … |
| Period 2 | $10.00 | 0.91 | € 9.10 | 0.00 |
| Period 2, adjusted | $9.50 | 0.91 | € 8.65 | -4.95 |
| Source: U.S. Bureau of Labor Statistics. | ||||
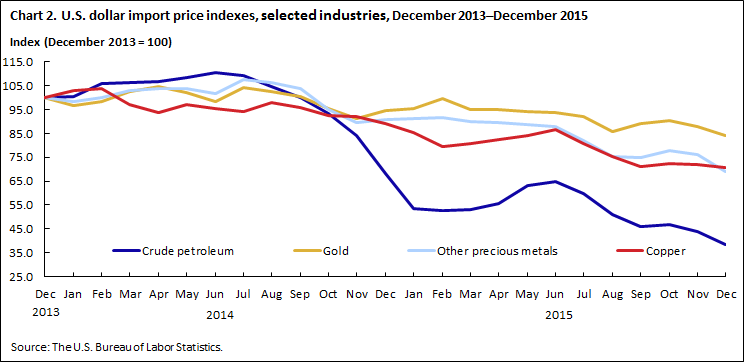
The stronger U.S. dollar allowed importers to pay less for imports in dollar terms, putting downward pressure on import prices throughout 2015. The import price index posted declines throughout most of 2015 and finished the year with an annual decline of 8.3 percent in December—the largest calendar-year decrease in the index since 2008. Excluding petroleum, the import price index decreased at a smaller rate of 3.7 percent. As seen in chart 2, a number of commodity prices fell in 2015 as well.
Oil is priced in U.S. dollars on the world market, so oil prices correlate strongly with the value of the dollar. Oil has perennially been the largest U.S. import, accounting for 10.5 percent of the dollar value of all imports in 2014. In 2015, oil fell from the top spot, decreasing 4.5 percent because of falling global oil prices and a decreasing volume of overall imports.12 In total, import oil prices fell 43.7 percent and the volume of imports decreased by 9.7 percent in 2015.13 The strong U.S. dollar helped push West Texas Intermediate (WTI) oil prices down to $37.13 a barrel on December 31; the price represented a 30-percent drop from 2014.14 Oil prices fell in 2015 from other factors as well, such as increases in global oil production and improvements in hydraulic fracturing in the United States.15
Gold, copper, and other precious metals are commodities that are also priced primarily in dollars and that have an inverse relationship to the dollar. Gold is considered a safe haven for investors, making it an attractive investment during economic downturns, when the dollar is less attractive. Conversely, gold is a less attractive investment during times of economic stability and growth.16 As the dollar strengthened in 2015, gold import prices decreased 11.2 percent. The import price index for copper decreased 21.0 percent in 2015, reaching lows not seen since 2009. The import price index for other precious metals, excluding gold, decreased 24 percent.
The Trade Weighted U.S. Dollar Index continued to trend up at the beginning of 2016, with a 1.2-percent increase in January. However, the index decreased 2.2 percent in February and a further 1.8 percent in March. Those declines coincided with the U.S. Federal Reserve’s decision not to raise interest rates any further. In not raising the rates, the Fed cited the weakness of the global economy.17
Since the beginning of 2016, the overall U.S. import price index declined 1.3 percent in January and 0.4 percent in February before rising 0.2 percent in March. Each of those changes was led primarily by crude petroleum prices. Import prices, excluding prices for crude petroleum, recorded smaller movements, edging down 0.2 percent in March and 0.1 percent in each of the first 2 months of 2016. In contrast, with the weakening of the U.S. dollar, there was upward movement in import prices for gold: a 2.3-percent increase in January, a 4.4-percent rise in February, and a 9.6-percent jump in March. Import prices for other precious metals, excluding gold, rose 0.3 percent in February and 4.1 percent in March, after falling in January.
In addition to having an impact on import prices, the rising value of the dollar affected export prices. The impact on export prices and the subsequent ramifications of the dollar’s ascent on the competitiveness of U.S. exports will be explored in a forthcoming Beyond the Numbers article.
This Beyond the Numbers summary was prepared by Kristen Reed, Economist in the Division of International Prices, Office of Prices and Living Conditions, Email: mead.david@bls.gov, Telephone: (610) 449-2027.
Information in this article will be made available upon request to individuals with sensory impairments. Voice phone: (202) 691-5200. Federal Relay Service: 1-800-877-8339. This article is in the public domain and may be reproduced without permission
Kristen Reed, “Impact of the strengthening dollar on U.S. import prices in 2015,” Beyond the Numbers: Global Economy, vol. 5, no. 12 (U.S. Bureau of Labor Statistics, August 2016), https://www.bls.gov/opub/btn/volume-5/impact-of-the-strengthening-dollar-on-us-import-prices-in-2015.htm
1 “Trade Weighted U.S. Dollar Price Index: major traders,” Federal Reserve Economic Data (Federal Reserve Bank of St. Louis, June 27, 2016), http://research.stlouisfed.org/fred2/series/TWEXMMTH.
2 See Evan Tarver, “How the Fed Fund Rate hikes affect the U.S. dollar,” Investopedia, October 12, 2015, http://www.investopedia.com/articles/investing/101215/how-fed-fund-rate-hikes-affect-us-dollar.asp; and Ira Iosebashvili, “Dollar firms as 2015 draws to a close,” The Wall Street Journal, December 31, 2015, www.wsj.com/articles/dollar-firms-as-2015-draws-to-a-close-1451587091.
3 Mark Thompson, “Europe finally starts pumping markets with cash,” CNN Money, March 9, 2015, www.money.cnn.com/2015/03/09/news/economy/europe-stimulus-qe-three-things/.
4 “What is quantitative easing?” The Economist, March 9, 2015, www.economist.com/blogs/economist-explains/2015/03/economist-explains-5.
5 Abenomics has a “three-arrow strategy” that borrows from the image from a Japanese folktale that three sticks together are harder to break than one. The three arrows are monetary stimuli, increased government spending, and economic reforms such as business deregulation.
6 Charles Riley, “Japan’s Abenomics experiment is on the rocks,” CNN Money, October 5, 2015 www.money.cnn.com/2015/10/05/news/economy/japan-economy-abenomics-experiment/index.html?section=money_latest.
7 Carlos Tejada, “5 things to know about China’s currency devaluation,” The Wall Street Journal, August 10, 2015, https://blogs.wsj.com/briefly/2015/08/10/5-things-about-chinas-currency-devaluation/.
8 “Top 10 Exports by Country,” World’s Top Exports, http://www.worldstopexports.com/category/countries/
9 Nicole Friedman, “U.S. oil prices end 2015 down 30% for the year,” The Wall Street Journal, December 31, 2015, www.wsj.com/articles/oil-prices-rise-but-supply-glut-caps-gains-1451560147.
10 In the example given, if the item were instead priced in euros, the foreign exporter might increase the euro price over time, in which case not all of the change in the value of the dollar is passed on to the U.S. importer.
11 Recent research shows that a 1-percent change in the trade-weighted U.S. dollar index lowers nonpetroleum import prices by.3 percent cumulatively over 6 months. (See “Exchange-rate pass-through and U.S. prices,” Federal Reserve Bank of Cleveland, March 24, 2015.) https://www.clevelandfed.org/newsroom-and-events/publications/economic-trends/2015-economic-trends/et-20150324-exchange-rate-pass-through-and-us-prices.aspx.
12 “U.S. imports from world total by 5-digit end-use code” (U.S. Census Bureau).
13 “U.S. imports of crude oil, not seasonally adjusted, 1973–present” (U.S. Census Bureau).
14 WTI is the primary oil-pricing benchmark used by in the New York Mercantile Exchange’s oil futures contracts. Import oil prices can be different in magnitude and timing from WTI pricing. (See “The numbers: 2015 in the markets,” The Wall Street Journal, December 31, 2015, https://blogs.wsj.com/briefly/2015/12/31/2015-in-the-markets-the-numbers/.)
15 Wendy Koch, “U.S.: oil production in 2015 to be highest since 1972,” USA Today Money, July 8, 2014, http://americasmarkets.usatoday.com/2014/07/08/u-s-oil-production-in-2015-to-be-highest-since-1972/.
16 The Gold Import Price Index decreased 4.5 percent in December, attributable partly to the concomitant increase in interest rates.
17 Binyamin Appelbaum, “Fed slows down on plans to pursue interest rate increases,” The New York Times, March 16, 2016, www.nytimes.com/2016/03/17/business/economy/fed-interest-rates-meeting.html?_r=0.
Publish Date: Friday, August 19, 2016