
An official website of the United States government
An official website of the United States government
The .gov means it's official.
Federal government websites often end in .gov or .mil. Before sharing sensitive information,
make sure you're on a federal government site.
The site is secure.
The
https:// ensures that you are connecting to the official website and that any
information you provide is encrypted and transmitted securely.
Set up, operate, or tend machines to mix or blend materials, such as chemicals, tobacco, liquids, color pigments, or explosive ingredients. Excludes �Food Batchmakers� (51-3092).
Employment estimate and mean wage estimates for Mixing and Blending Machine Setters, Operators, and Tenders:
| Employment (1) | Employment RSE (3) |
Mean hourly wage |
Mean annual wage (2) |
Wage RSE (3) |
|---|---|---|---|---|
| 105,740 | 1.4 % | $ 23.05 | $ 47,950 | 0.3 % |
Percentile wage estimates for Mixing and Blending Machine Setters, Operators, and Tenders:
| Percentile | 10% | 25% | 50% (Median) |
75% | 90% |
|---|---|---|---|---|---|
| Hourly Wage | $ 16.39 | $ 18.56 | $ 22.16 | $ 26.67 | $ 30.62 |
| Annual Wage (2) | $ 34,090 | $ 38,610 | $ 46,100 | $ 55,470 | $ 63,700 |
Industries with the highest published employment and wages for Mixing and Blending Machine Setters, Operators, and Tenders are provided. For a list of all industries with employment in Mixing and Blending Machine Setters, Operators, and Tenders, see the Create Customized Tables function.
Industries with the highest levels of employment in Mixing and Blending Machine Setters, Operators, and Tenders:
| Industry | Employment (1) | Percent of industry employment | Hourly mean wage | Annual mean wage (2) |
|---|---|---|---|---|
| Chemical Manufacturing (3255 and 3256 only) | 16,100 | 8.95 | $ 22.91 | $ 47,660 |
| Nonmetallic Mineral Product Manufacturing | 11,840 | 2.84 | $ 24.52 | $ 51,000 |
| Chemical Manufacturing (3251, 3252, 3253, and 3259 only) | 10,570 | 2.88 | $ 24.37 | $ 50,690 |
| Animal Food Manufacturing | 6,530 | 8.87 | $ 20.40 | $ 42,440 |
| Merchant Wholesalers, Nondurable Goods (4242 and 4246 only) | 5,140 | 1.30 | $ 22.42 | $ 46,640 |
Industries with the highest concentration of employment in Mixing and Blending Machine Setters, Operators, and Tenders:
| Industry | Employment (1) | Percent of industry employment | Hourly mean wage | Annual mean wage (2) |
|---|---|---|---|---|
| Chemical Manufacturing (3255 and 3256 only) | 16,100 | 8.95 | $ 22.91 | $ 47,660 |
| Animal Food Manufacturing | 6,530 | 8.87 | $ 20.40 | $ 42,440 |
| Petroleum and Coal Products Manufacturing | 4,820 | 4.45 | $ 26.36 | $ 54,830 |
| Chemical Manufacturing (3251, 3252, 3253, and 3259 only) | 10,570 | 2.88 | $ 24.37 | $ 50,690 |
| Nonmetallic Mineral Product Manufacturing | 11,840 | 2.84 | $ 24.52 | $ 51,000 |
Top paying industries for Mixing and Blending Machine Setters, Operators, and Tenders:
| Industry | Employment (1) | Percent of industry employment | Hourly mean wage | Annual mean wage (2) |
|---|---|---|---|---|
| Other Specialty Trade Contractors | 90 | 0.01 | $ 53.83 | $ 111,960 |
| Motor Vehicle Manufacturing | 60 | 0.02 | $ 33.41 | $ 69,500 |
| Alumina and Aluminum Production and Processing | 80 | 0.13 | $ 29.60 | $ 61,560 |
| Highway, Street, and Bridge Construction | 490 | 0.13 | $ 29.44 | $ 61,240 |
| Pulp, Paper, and Paperboard Mills | 1,690 | 1.92 | $ 28.59 | $ 59,460 |
States and areas with the highest published employment, location quotients, and wages for Mixing and Blending Machine Setters, Operators, and Tenders are provided. For a list of all areas with employment in Mixing and Blending Machine Setters, Operators, and Tenders, see the Create Customized Tables function.
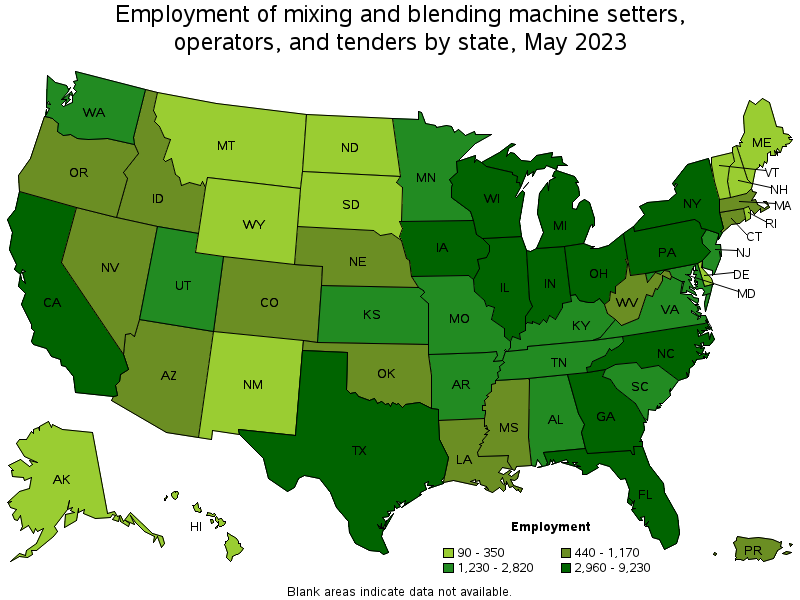
States with the highest employment level in Mixing and Blending Machine Setters, Operators, and Tenders:
| State | Employment (1) | Employment per thousand jobs | Location quotient (9) | Hourly mean wage | Annual mean wage (2) |
|---|---|---|---|---|---|
| Texas | 9,230 | 0.68 | 0.98 | $ 21.68 | $ 45,100 |
| Illinois | 8,310 | 1.38 | 1.99 | $ 22.97 | $ 47,770 |
| California | 8,250 | 0.46 | 0.66 | $ 25.10 | $ 52,200 |
| North Carolina | 4,660 | 0.97 | 1.40 | $ 21.47 | $ 44,650 |
| Pennsylvania | 4,400 | 0.74 | 1.06 | $ 24.39 | $ 50,730 |
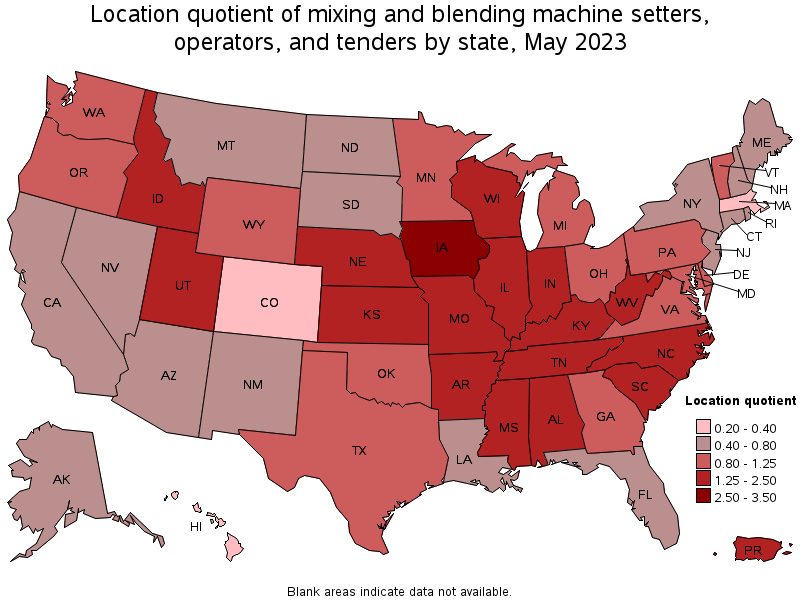
States with the highest concentration of jobs and location quotients in Mixing and Blending Machine Setters, Operators, and Tenders:
| State | Employment (1) | Employment per thousand jobs | Location quotient (9) | Hourly mean wage | Annual mean wage (2) |
|---|---|---|---|---|---|
| Iowa | 3,150 | 2.04 | 2.93 | $ 22.98 | $ 47,800 |
| Kansas | 2,210 | 1.56 | 2.24 | $ 21.99 | $ 45,740 |
| Wisconsin | 4,110 | 1.43 | 2.05 | $ 23.47 | $ 48,820 |
| Illinois | 8,310 | 1.38 | 1.99 | $ 22.97 | $ 47,770 |
| West Virginia | 930 | 1.35 | 1.94 | $ 23.73 | $ 49,360 |
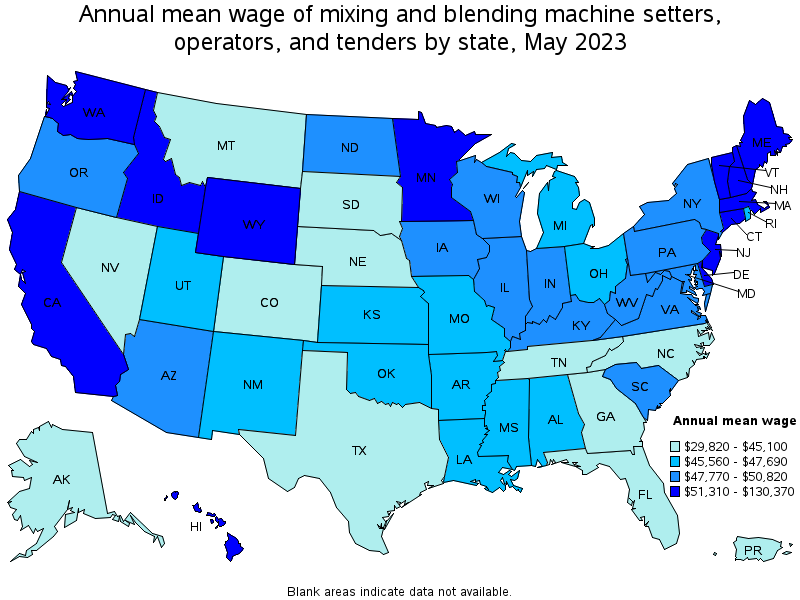
Top paying states for Mixing and Blending Machine Setters, Operators, and Tenders:
| State | Employment (1) | Employment per thousand jobs | Location quotient (9) | Hourly mean wage | Annual mean wage (2) |
|---|---|---|---|---|---|
| Hawaii | 90 | 0.14 | 0.20 | $ 62.68 | $ 130,370 |
| Maine | 260 | 0.42 | 0.60 | $ 26.32 | $ 54,750 |
| Idaho | 730 | 0.89 | 1.28 | $ 26.10 | $ 54,290 |
| Massachusetts | 750 | 0.21 | 0.30 | $ 25.31 | $ 52,650 |
| Connecticut | 640 | 0.39 | 0.55 | $ 25.30 | $ 52,620 |
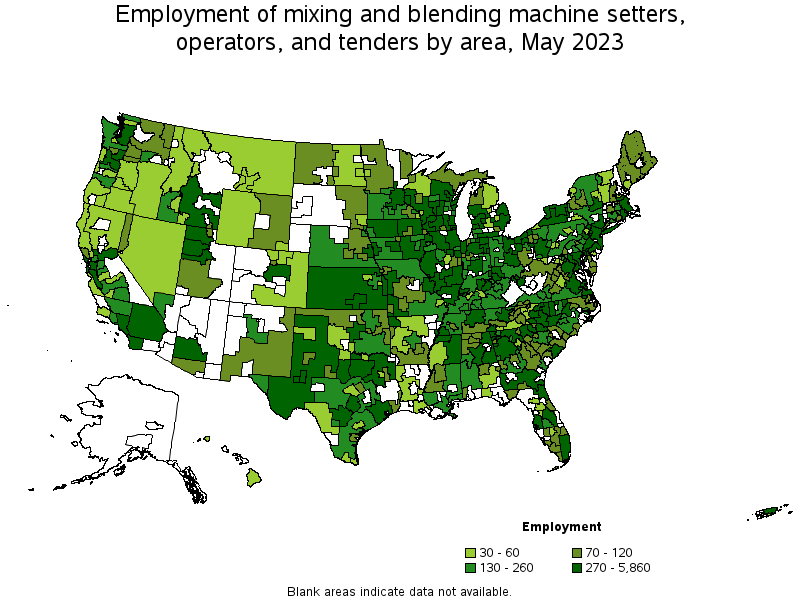
Metropolitan areas with the highest employment level in Mixing and Blending Machine Setters, Operators, and Tenders:
| Metropolitan area | Employment (1) | Employment per thousand jobs | Location quotient (9) | Hourly mean wage | Annual mean wage (2) |
|---|---|---|---|---|---|
| Chicago-Naperville-Elgin, IL-IN-WI | 5,860 | 1.30 | 1.87 | $ 23.77 | $ 49,430 |
| Dallas-Fort Worth-Arlington, TX | 3,060 | 0.77 | 1.11 | $ 21.30 | $ 44,310 |
| New York-Newark-Jersey City, NY-NJ-PA | 2,910 | 0.31 | 0.44 | $ 25.10 | $ 52,210 |
| Los Angeles-Long Beach-Anaheim, CA | 2,820 | 0.46 | 0.65 | $ 23.81 | $ 49,530 |
| Houston-The Woodlands-Sugar Land, TX | 1,900 | 0.60 | 0.86 | $ 22.53 | $ 46,870 |
| Atlanta-Sandy Springs-Roswell, GA | 1,710 | 0.61 | 0.87 | $ 22.68 | $ 47,180 |
| Philadelphia-Camden-Wilmington, PA-NJ-DE-MD | 1,530 | 0.54 | 0.77 | $ 24.30 | $ 50,550 |
| Kansas City, MO-KS | 1,370 | 1.27 | 1.82 | $ 24.16 | $ 50,260 |
| Charlotte-Concord-Gastonia, NC-SC | 1,350 | 1.03 | 1.48 | $ 21.79 | $ 45,320 |
| Baltimore-Columbia-Towson, MD | 1,130 | 0.87 | 1.25 | $ 23.82 | $ 49,550 |
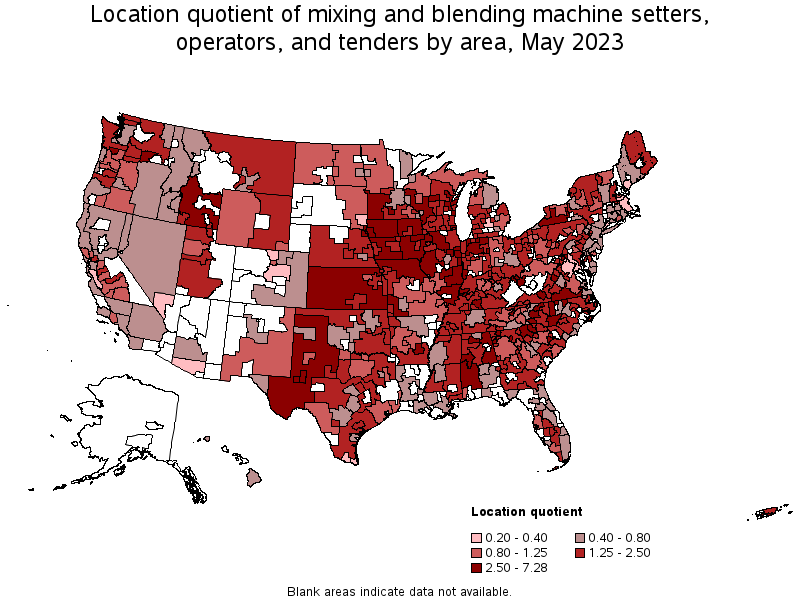
Metropolitan areas with the highest concentration of jobs and location quotients in Mixing and Blending Machine Setters, Operators, and Tenders:
| Metropolitan area | Employment (1) | Employment per thousand jobs | Location quotient (9) | Hourly mean wage | Annual mean wage (2) |
|---|---|---|---|---|---|
| Sumter, SC | 180 | 5.07 | 7.28 | $ 20.10 | $ 41,810 |
| Kankakee, IL | 200 | 4.77 | 6.85 | $ 22.29 | $ 46,370 |
| Danville, IL | 120 | 4.56 | 6.55 | $ 21.22 | $ 44,140 |
| Racine, WI | 280 | 3.70 | 5.31 | $ 19.76 | $ 41,100 |
| Odessa, TX | 270 | 3.50 | 5.03 | $ 22.81 | $ 47,450 |
| Elkhart-Goshen, IN | 450 | 3.27 | 4.70 | $ 23.26 | $ 48,370 |
| Evansville, IN-KY | 500 | 3.27 | 4.69 | $ 22.95 | $ 47,740 |
| Dalton, GA | 190 | 2.97 | 4.26 | $ 19.98 | $ 41,560 |
| Wausau, WI | 200 | 2.82 | 4.06 | $ 28.75 | $ 59,800 |
| Huntington-Ashland, WV-KY-OH | 360 | 2.77 | 3.97 | $ 21.46 | $ 44,640 |

Top paying metropolitan areas for Mixing and Blending Machine Setters, Operators, and Tenders:
| Metropolitan area | Employment (1) | Employment per thousand jobs | Location quotient (9) | Hourly mean wage | Annual mean wage (2) |
|---|---|---|---|---|---|
| Sacramento--Roseville--Arden-Arcade, CA | 430 | 0.41 | 0.59 | $ 31.24 | $ 64,980 |
| San Francisco-Oakland-Hayward, CA | 720 | 0.30 | 0.43 | $ 29.62 | $ 61,610 |
| Decatur, AL | 100 | 1.81 | 2.59 | $ 28.88 | $ 60,060 |
| Wausau, WI | 200 | 2.82 | 4.06 | $ 28.75 | $ 59,800 |
| Gulfport-Biloxi-Pascagoula, MS | 230 | 1.50 | 2.15 | $ 28.55 | $ 59,390 |
| Midland, TX | 280 | 2.44 | 3.50 | $ 28.52 | $ 59,320 |
| Tucson, AZ | 100 | 0.25 | 0.36 | $ 28.31 | $ 58,890 |
| Duluth, MN-WI | 70 | 0.54 | 0.77 | $ 28.00 | $ 58,240 |
| Mankato-North Mankato, MN | 150 | 2.76 | 3.96 | $ 27.90 | $ 58,020 |
| Seattle-Tacoma-Bellevue, WA | 990 | 0.48 | 0.69 | $ 27.88 | $ 58,000 |
Nonmetropolitan areas with the highest employment in Mixing and Blending Machine Setters, Operators, and Tenders:
| Nonmetropolitan area | Employment (1) | Employment per thousand jobs | Location quotient (9) | Hourly mean wage | Annual mean wage (2) |
|---|---|---|---|---|---|
| Kansas nonmetropolitan area | 720 | 1.86 | 2.67 | $ 20.06 | $ 41,720 |
| Southeast Iowa nonmetropolitan area | 680 | 3.23 | 4.64 | $ 22.99 | $ 47,810 |
| Northwest Iowa nonmetropolitan area | 570 | 4.27 | 6.14 | $ 21.28 | $ 44,260 |
| Piedmont North Carolina nonmetropolitan area | 520 | 2.06 | 2.95 | $ 20.73 | $ 43,120 |
| Northern Indiana nonmetropolitan area | 510 | 2.39 | 3.44 | $ 22.97 | $ 47,770 |
Nonmetropolitan areas with the highest concentration of jobs and location quotients in Mixing and Blending Machine Setters, Operators, and Tenders:
| Nonmetropolitan area | Employment (1) | Employment per thousand jobs | Location quotient (9) | Hourly mean wage | Annual mean wage (2) |
|---|---|---|---|---|---|
| South Illinois nonmetropolitan area | 420 | 4.85 | 6.97 | (8) | (8) |
| Northwest Iowa nonmetropolitan area | 570 | 4.27 | 6.14 | $ 21.28 | $ 44,260 |
| Southwest Missouri nonmetropolitan area | 310 | 4.21 | 6.04 | $ 22.74 | $ 47,300 |
| Southeast-Central Idaho nonmetropolitan area | 380 | 4.02 | 5.77 | $ 30.10 | $ 62,600 |
| Northeast Iowa nonmetropolitan area | 320 | 3.31 | 4.75 | $ 23.86 | $ 49,620 |
Top paying nonmetropolitan areas for Mixing and Blending Machine Setters, Operators, and Tenders:
| Nonmetropolitan area | Employment (1) | Employment per thousand jobs | Location quotient (9) | Hourly mean wage | Annual mean wage (2) |
|---|---|---|---|---|---|
| Hawaii / Kauai nonmetropolitan area | 40 | 0.41 | 0.59 | $ 70.34 | $ 146,300 |
| Southeast-Central Idaho nonmetropolitan area | 380 | 4.02 | 5.77 | $ 30.10 | $ 62,600 |
| Southwest Maine nonmetropolitan area | 100 | 0.50 | 0.72 | $ 29.97 | $ 62,340 |
| Central Louisiana nonmetropolitan area | 30 | 0.39 | 0.56 | $ 27.60 | $ 57,410 |
| Northeast Maine nonmetropolitan area | 80 | 1.11 | 1.59 | $ 27.56 | $ 57,320 |
These estimates are calculated with data collected from employers in all industry sectors, all metropolitan and nonmetropolitan areas, and all states and the District of Columbia. The top employment and wage figures are provided above. The complete list is available in the downloadable XLS files.
The percentile wage estimate is the value of a wage below which a certain percent of workers fall. The median wage is the 50th percentile wage estimate—50 percent of workers earn less than the median and 50 percent of workers earn more than the median. More about percentile wages.
(1) Estimates for detailed occupations do not sum to the totals because the totals include occupations not shown separately. Estimates do not include self-employed workers.
(2) Annual wages have been calculated by multiplying the hourly mean wage by a "year-round, full-time" hours figure of 2,080 hours; for those occupations where there is not an hourly wage published, the annual wage has been directly calculated from the reported survey data.
(3) The relative standard error (RSE) is a measure of the reliability of a survey statistic. The smaller the relative standard error, the more precise the estimate.
(8) Estimate not released.
(9) The location quotient is the ratio of the area concentration of occupational employment to the national average concentration. A location quotient greater than one indicates the occupation has a higher share of employment than average, and a location quotient less than one indicates the occupation is less prevalent in the area than average.
Other OEWS estimates and related information:
May 2023 National Occupational Employment and Wage Estimates
May 2023 State Occupational Employment and Wage Estimates
May 2023 Metropolitan and Nonmetropolitan Area Occupational Employment and Wage Estimates
May 2023 National Industry-Specific Occupational Employment and Wage Estimates
Last Modified Date: April 3, 2024