
An official website of the United States government
An official website of the United States government
The .gov means it's official.
Federal government websites often end in .gov or .mil. Before sharing sensitive information,
make sure you're on a federal government site.
The site is secure.
The
https:// ensures that you are connecting to the official website and that any
information you provide is encrypted and transmitted securely.
Design, make, alter, repair, or fit garments.
Employment estimate and mean wage estimates for Tailors, Dressmakers, and Custom Sewers:
| Employment (1) | Employment RSE (3) |
Mean hourly wage |
Mean annual wage (2) |
Wage RSE (3) |
|---|---|---|---|---|
| 14,950 | 10.2 % | $ 19.32 | $ 40,190 | 1.1 % |
Percentile wage estimates for Tailors, Dressmakers, and Custom Sewers:
| Percentile | 10% | 25% | 50% (Median) |
75% | 90% |
|---|---|---|---|---|---|
| Hourly Wage | $ 13.25 | $ 15.30 | $ 17.62 | $ 21.40 | $ 26.83 |
| Annual Wage (2) | $ 27,560 | $ 31,820 | $ 36,650 | $ 44,510 | $ 55,810 |
Industries with the highest published employment and wages for Tailors, Dressmakers, and Custom Sewers are provided. For a list of all industries with employment in Tailors, Dressmakers, and Custom Sewers, see the Create Customized Tables function.
Industries with the highest levels of employment in Tailors, Dressmakers, and Custom Sewers:
| Industry | Employment (1) | Percent of industry employment | Hourly mean wage | Annual mean wage (2) |
|---|---|---|---|---|
| Clothing and Clothing Accessories Retailers | 4,490 | 0.52 | $ 18.79 | $ 39,080 |
| Personal and Household Goods Repair and Maintenance | 2,660 | 3.12 | $ 17.29 | $ 35,970 |
| Drycleaning and Laundry Services | 2,430 | 0.96 | $ 17.71 | $ 36,830 |
| Cut and Sew Apparel Manufacturing | 1,000 | 1.42 | $ 20.29 | $ 42,200 |
| Apparel, Piece Goods, and Notions Merchant Wholesalers | 880 | 0.61 | $ 20.71 | $ 43,070 |
Industries with the highest concentration of employment in Tailors, Dressmakers, and Custom Sewers:
| Industry | Employment (1) | Percent of industry employment | Hourly mean wage | Annual mean wage (2) |
|---|---|---|---|---|
| Personal and Household Goods Repair and Maintenance | 2,660 | 3.12 | $ 17.29 | $ 35,970 |
| Cut and Sew Apparel Manufacturing | 1,000 | 1.42 | $ 20.29 | $ 42,200 |
| Drycleaning and Laundry Services | 2,430 | 0.96 | $ 17.71 | $ 36,830 |
| Textile Furnishings Mills | 250 | 0.62 | $ 19.56 | $ 40,690 |
| Apparel, Piece Goods, and Notions Merchant Wholesalers | 880 | 0.61 | $ 20.71 | $ 43,070 |
Top paying industries for Tailors, Dressmakers, and Custom Sewers:
| Industry | Employment (1) | Percent of industry employment | Hourly mean wage | Annual mean wage (2) |
|---|---|---|---|---|
| Motion Picture and Video Industries | 230 | 0.06 | $ 45.66 | $ 94,970 |
| Employment Services | 50 | (7) | $ 29.77 | $ 61,920 |
| General Merchandise Retailers | 590 | 0.02 | $ 27.04 | $ 56,240 |
| Performing Arts Companies | 130 | 0.09 | $ 22.88 | $ 47,580 |
| Traveler Accommodation | 320 | 0.02 | $ 21.40 | $ 44,510 |
States and areas with the highest published employment, location quotients, and wages for Tailors, Dressmakers, and Custom Sewers are provided. For a list of all areas with employment in Tailors, Dressmakers, and Custom Sewers, see the Create Customized Tables function.
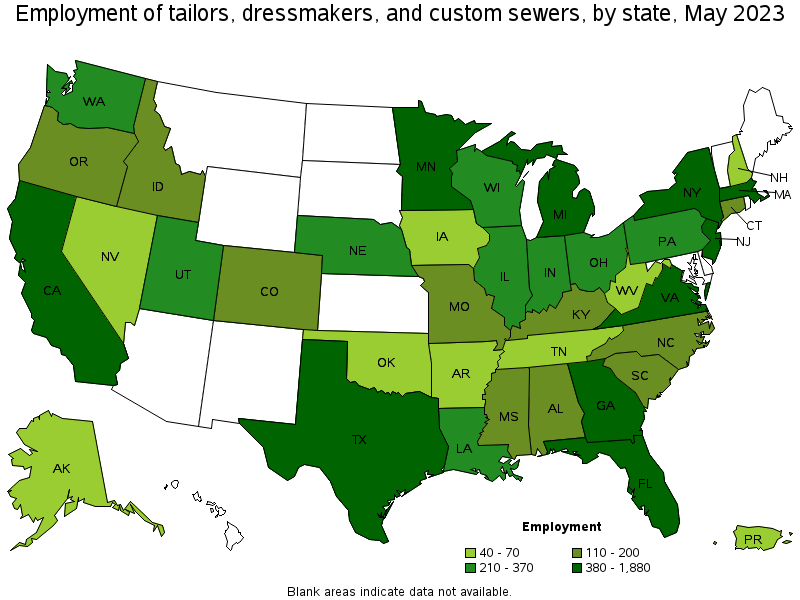
States with the highest employment level in Tailors, Dressmakers, and Custom Sewers:
| State | Employment (1) | Employment per thousand jobs | Location quotient (9) | Hourly mean wage | Annual mean wage (2) |
|---|---|---|---|---|---|
| New York | 1,880 | 0.20 | 2.04 | $ 21.48 | $ 44,690 |
| California | 1,820 | 0.10 | 1.03 | $ 24.66 | $ 51,290 |
| Texas | 1,300 | 0.10 | 0.97 | $ 18.06 | $ 37,560 |
| Florida | 1,200 | 0.13 | 1.27 | $ 16.81 | $ 34,960 |
| Massachusetts | 760 | 0.21 | 2.11 | $ 21.07 | $ 43,830 |
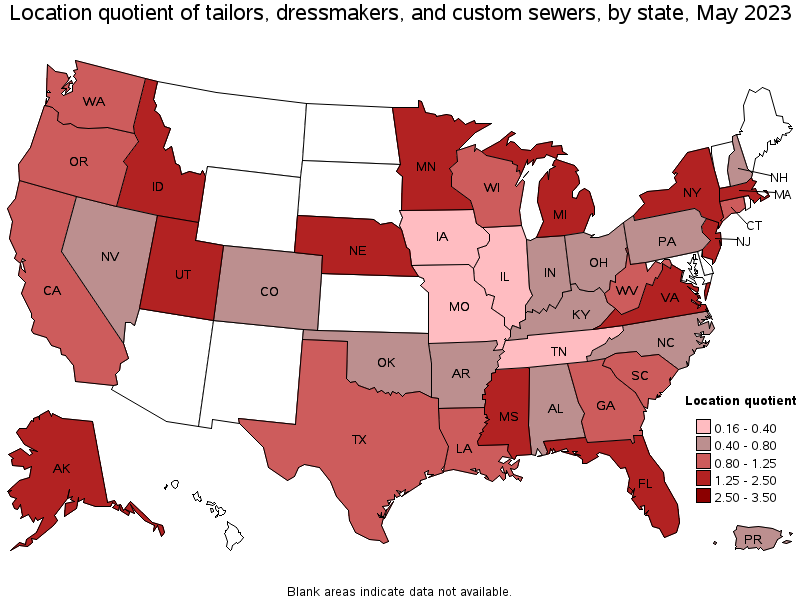
States with the highest concentration of jobs and location quotients in Tailors, Dressmakers, and Custom Sewers:
| State | Employment (1) | Employment per thousand jobs | Location quotient (9) | Hourly mean wage | Annual mean wage (2) |
|---|---|---|---|---|---|
| Nebraska | 230 | 0.23 | 2.30 | $ 14.80 | $ 30,790 |
| Massachusetts | 760 | 0.21 | 2.11 | $ 21.07 | $ 43,830 |
| New York | 1,880 | 0.20 | 2.04 | $ 21.48 | $ 44,690 |
| Utah | 330 | 0.20 | 2.00 | $ 17.63 | $ 36,670 |
| Virginia | 650 | 0.16 | 1.66 | $ 16.83 | $ 35,010 |
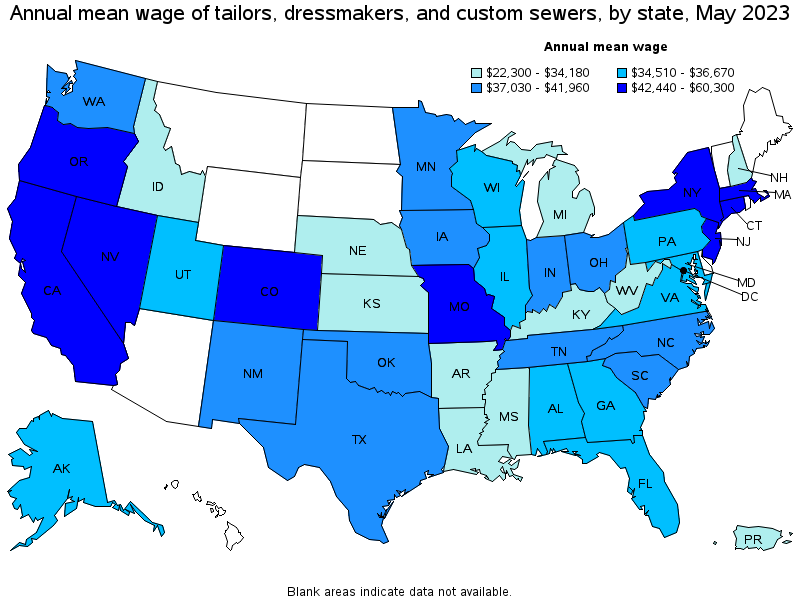
Top paying states for Tailors, Dressmakers, and Custom Sewers:
| State | Employment (1) | Employment per thousand jobs | Location quotient (9) | Hourly mean wage | Annual mean wage (2) |
|---|---|---|---|---|---|
| District of Columbia | (8) | (8) | (8) | $ 28.99 | $ 60,300 |
| California | 1,820 | 0.10 | 1.03 | $ 24.66 | $ 51,290 |
| Connecticut | 190 | 0.12 | 1.18 | $ 22.27 | $ 46,320 |
| New York | 1,880 | 0.20 | 2.04 | $ 21.48 | $ 44,690 |
| Missouri | 110 | 0.04 | 0.38 | $ 21.33 | $ 44,360 |
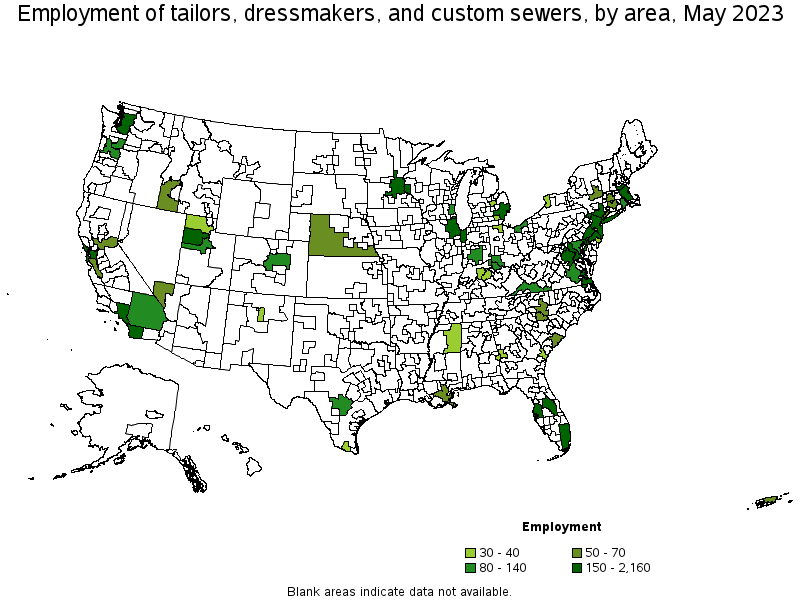
Metropolitan areas with the highest employment level in Tailors, Dressmakers, and Custom Sewers:
| Metropolitan area | Employment (1) | Employment per thousand jobs | Location quotient (9) | Hourly mean wage | Annual mean wage (2) |
|---|---|---|---|---|---|
| New York-Newark-Jersey City, NY-NJ-PA | 2,160 | 0.23 | 2.31 | $ 21.60 | $ 44,930 |
| Los Angeles-Long Beach-Anaheim, CA | 1,050 | 0.17 | 1.73 | $ 26.59 | $ 55,300 |
| Boston-Cambridge-Nashua, MA-NH | 590 | 0.21 | 2.17 | $ 21.06 | $ 43,790 |
| Detroit-Warren-Dearborn, MI | 380 | 0.20 | 2.02 | $ 15.15 | $ 31,500 |
| Miami-Fort Lauderdale-West Palm Beach, FL | 320 | 0.12 | 1.20 | $ 17.99 | $ 37,410 |
| Seattle-Tacoma-Bellevue, WA | 280 | 0.13 | 1.35 | $ 20.57 | $ 42,780 |
| Washington-Arlington-Alexandria, DC-VA-MD-WV | 250 | 0.08 | 0.81 | $ 22.50 | $ 46,800 |
| Minneapolis-St. Paul-Bloomington, MN-WI | 240 | 0.13 | 1.30 | $ 20.85 | $ 43,380 |
| Orlando-Kissimmee-Sanford, FL | 220 | 0.16 | 1.64 | $ 16.61 | $ 34,540 |
| Tampa-St. Petersburg-Clearwater, FL | 210 | 0.15 | 1.52 | $ 16.08 | $ 33,450 |
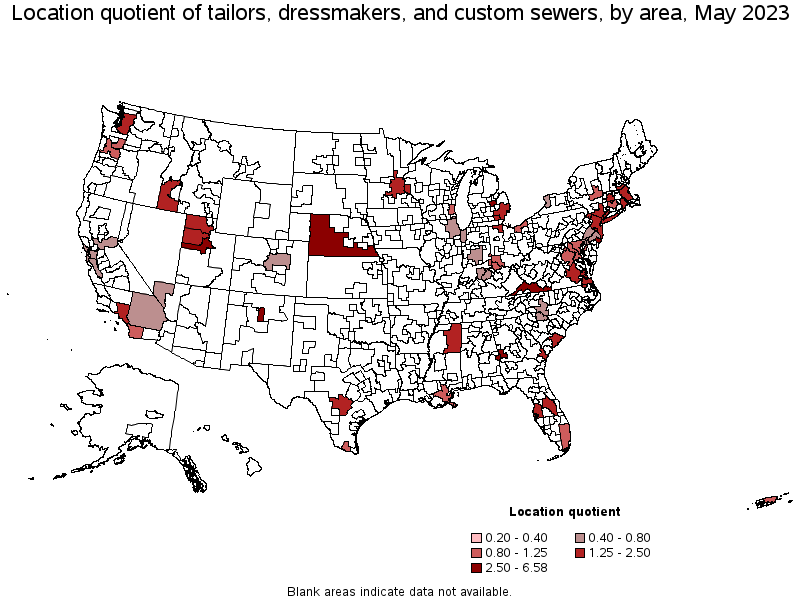
Metropolitan areas with the highest concentration of jobs and location quotients in Tailors, Dressmakers, and Custom Sewers:
| Metropolitan area | Employment (1) | Employment per thousand jobs | Location quotient (9) | Hourly mean wage | Annual mean wage (2) |
|---|---|---|---|---|---|
| Santa Fe, NM | 30 | 0.52 | 5.31 | $ 19.85 | $ 41,280 |
| Saginaw, MI | 30 | 0.41 | 4.13 | $ 14.15 | $ 29,440 |
| Provo-Orem, UT | 90 | 0.32 | 3.27 | $ 18.45 | $ 38,370 |
| Atlantic City-Hammonton, NJ | 30 | 0.27 | 2.76 | $ 18.95 | $ 39,420 |
| Columbus, GA-AL | 30 | 0.26 | 2.67 | $ 16.10 | $ 33,490 |
| New York-Newark-Jersey City, NY-NJ-PA | 2,160 | 0.23 | 2.31 | $ 21.60 | $ 44,930 |
| Boston-Cambridge-Nashua, MA-NH | 590 | 0.21 | 2.17 | $ 21.06 | $ 43,790 |
| Virginia Beach-Norfolk-Newport News, VA-NC | 150 | 0.20 | 2.05 | $ 15.88 | $ 33,030 |
| Detroit-Warren-Dearborn, MI | 380 | 0.20 | 2.02 | $ 15.15 | $ 31,500 |
| Salt Lake City, UT | 150 | 0.18 | 1.86 | $ 17.98 | $ 37,390 |
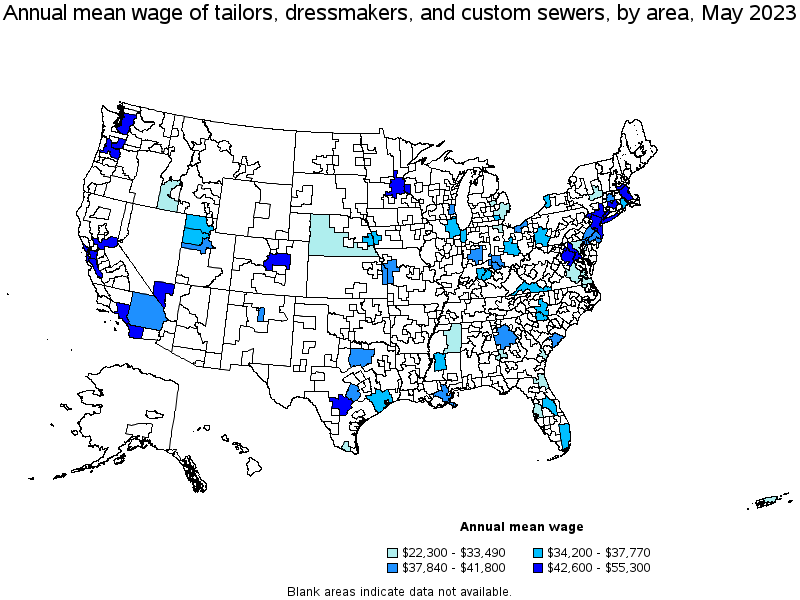
Top paying metropolitan areas for Tailors, Dressmakers, and Custom Sewers:
| Metropolitan area | Employment (1) | Employment per thousand jobs | Location quotient (9) | Hourly mean wage | Annual mean wage (2) |
|---|---|---|---|---|---|
| Los Angeles-Long Beach-Anaheim, CA | 1,050 | 0.17 | 1.73 | $ 26.59 | $ 55,300 |
| San Jose-Sunnyvale-Santa Clara, CA | 60 | 0.06 | 0.57 | $ 25.92 | $ 53,910 |
| San Francisco-Oakland-Hayward, CA | 150 | 0.06 | 0.65 | $ 24.97 | $ 51,930 |
| Trenton, NJ | 40 | 0.15 | 1.52 | $ 22.56 | $ 46,920 |
| Washington-Arlington-Alexandria, DC-VA-MD-WV | 250 | 0.08 | 0.81 | $ 22.50 | $ 46,800 |
| Hartford-West Hartford-East Hartford, CT | 50 | 0.08 | 0.81 | $ 22.36 | $ 46,510 |
| Bridgeport-Stamford-Norwalk, CT | 60 | 0.14 | 1.47 | $ 21.81 | $ 45,370 |
| San Diego-Carlsbad, CA | 170 | 0.11 | 1.16 | $ 21.64 | $ 45,000 |
| New York-Newark-Jersey City, NY-NJ-PA | 2,160 | 0.23 | 2.31 | $ 21.60 | $ 44,930 |
| San Antonio-New Braunfels, TX | 140 | 0.12 | 1.26 | $ 21.42 | $ 44,550 |
Nonmetropolitan areas with the highest employment in Tailors, Dressmakers, and Custom Sewers:
| Nonmetropolitan area | Employment (1) | Employment per thousand jobs | Location quotient (9) | Hourly mean wage | Annual mean wage (2) |
|---|---|---|---|---|---|
| Southwest Virginia nonmetropolitan area | 80 | 0.65 | 6.58 | $ 16.44 | $ 34,200 |
| South Nebraska nonmetropolitan area | 70 | 0.46 | 4.72 | $ 13.27 | $ 27,600 |
| Northeast Mississippi nonmetropolitan area | 30 | 0.13 | 1.36 | $ 15.37 | $ 31,970 |
Nonmetropolitan areas with the highest concentration of jobs and location quotients in Tailors, Dressmakers, and Custom Sewers:
| Nonmetropolitan area | Employment (1) | Employment per thousand jobs | Location quotient (9) | Hourly mean wage | Annual mean wage (2) |
|---|---|---|---|---|---|
| Southwest Virginia nonmetropolitan area | 80 | 0.65 | 6.58 | $ 16.44 | $ 34,200 |
| South Nebraska nonmetropolitan area | 70 | 0.46 | 4.72 | $ 13.27 | $ 27,600 |
| Northeast Mississippi nonmetropolitan area | 30 | 0.13 | 1.36 | $ 15.37 | $ 31,970 |
Top paying nonmetropolitan areas for Tailors, Dressmakers, and Custom Sewers:
| Nonmetropolitan area | Employment (1) | Employment per thousand jobs | Location quotient (9) | Hourly mean wage | Annual mean wage (2) |
|---|---|---|---|---|---|
| Southwest Virginia nonmetropolitan area | 80 | 0.65 | 6.58 | $ 16.44 | $ 34,200 |
| Northeast Mississippi nonmetropolitan area | 30 | 0.13 | 1.36 | $ 15.37 | $ 31,970 |
| South Nebraska nonmetropolitan area | 70 | 0.46 | 4.72 | $ 13.27 | $ 27,600 |
These estimates are calculated with data collected from employers in all industry sectors, all metropolitan and nonmetropolitan areas, and all states and the District of Columbia. The top employment and wage figures are provided above. The complete list is available in the downloadable XLS files.
The percentile wage estimate is the value of a wage below which a certain percent of workers fall. The median wage is the 50th percentile wage estimate—50 percent of workers earn less than the median and 50 percent of workers earn more than the median. More about percentile wages.
(1) Estimates for detailed occupations do not sum to the totals because the totals include occupations not shown separately. Estimates do not include self-employed workers.
(2) Annual wages have been calculated by multiplying the hourly mean wage by a "year-round, full-time" hours figure of 2,080 hours; for those occupations where there is not an hourly wage published, the annual wage has been directly calculated from the reported survey data.
(3) The relative standard error (RSE) is a measure of the reliability of a survey statistic. The smaller the relative standard error, the more precise the estimate.
(7) The value is less than .005 percent of industry employment.
(8) Estimate not released.
(9) The location quotient is the ratio of the area concentration of occupational employment to the national average concentration. A location quotient greater than one indicates the occupation has a higher share of employment than average, and a location quotient less than one indicates the occupation is less prevalent in the area than average.
Other OEWS estimates and related information:
May 2023 National Occupational Employment and Wage Estimates
May 2023 State Occupational Employment and Wage Estimates
May 2023 Metropolitan and Nonmetropolitan Area Occupational Employment and Wage Estimates
May 2023 National Industry-Specific Occupational Employment and Wage Estimates
Last Modified Date: April 3, 2024