
An official website of the United States government
An official website of the United States government
The .gov means it's official.
Federal government websites often end in .gov or .mil. Before sharing sensitive information,
make sure you're on a federal government site.
The site is secure.
The
https:// ensures that you are connecting to the official website and that any
information you provide is encrypted and transmitted securely.
This occupation includes the 2018 SOC occupations 47-4091 Segmental Pavers and 47-4099 Construction and Related Workers, All Other.
Employment estimate and mean wage estimates for Miscellaneous Construction and Related Workers:
| Employment (1) | Employment RSE (3) |
Mean hourly wage |
Mean annual wage (2) |
Wage RSE (3) |
|---|---|---|---|---|
| 28,930 | 3.5 % | $ 24.84 | $ 51,670 | 1.7 % |
Percentile wage estimates for Miscellaneous Construction and Related Workers:
| Percentile | 10% | 25% | 50% (Median) |
75% | 90% |
|---|---|---|---|---|---|
| Hourly Wage | $ 16.75 | $ 18.65 | $ 22.64 | $ 28.22 | $ 37.26 |
| Annual Wage (2) | $ 34,840 | $ 38,800 | $ 47,090 | $ 58,690 | $ 77,500 |
Industries with the highest published employment and wages for Miscellaneous Construction and Related Workers are provided. For a list of all industries with employment in Miscellaneous Construction and Related Workers, see the Create Customized Tables function.
Industries with the highest levels of employment in Miscellaneous Construction and Related Workers:
| Industry | Employment (1) | Percent of industry employment | Hourly mean wage | Annual mean wage (2) |
|---|---|---|---|---|
| Building Finishing Contractors | 5,240 | 0.62 | $ 26.37 | $ 54,850 |
| Other Specialty Trade Contractors | 2,950 | 0.38 | $ 24.83 | $ 51,640 |
| Foundation, Structure, and Building Exterior Contractors | 2,240 | 0.23 | $ 22.76 | $ 47,340 |
| Residential Building Construction | 2,030 | 0.22 | $ 25.29 | $ 52,590 |
| Local Government, excluding Schools and Hospitals (OEWS Designation) | 1,530 | 0.03 | $ 25.98 | $ 54,030 |
Industries with the highest concentration of employment in Miscellaneous Construction and Related Workers:
| Industry | Employment (1) | Percent of industry employment | Hourly mean wage | Annual mean wage (2) |
|---|---|---|---|---|
| Building Finishing Contractors | 5,240 | 0.62 | $ 26.37 | $ 54,850 |
| Other Specialty Trade Contractors | 2,950 | 0.38 | $ 24.83 | $ 51,640 |
| Other Heavy and Civil Engineering Construction | 400 | 0.32 | $ 24.03 | $ 49,980 |
| Foundation, Structure, and Building Exterior Contractors | 2,240 | 0.23 | $ 22.76 | $ 47,340 |
| Residential Building Construction | 2,030 | 0.22 | $ 25.29 | $ 52,590 |
Top paying industries for Miscellaneous Construction and Related Workers:
| Industry | Employment (1) | Percent of industry employment | Hourly mean wage | Annual mean wage (2) |
|---|---|---|---|---|
| Aerospace Product and Parts Manufacturing | 40 | 0.01 | $ 42.80 | $ 89,020 |
| Electric Power Generation, Transmission and Distribution | 90 | 0.02 | $ 38.37 | $ 79,800 |
| Commercial and Industrial Machinery and Equipment (except Automotive and Electronic) Repair and Maintenance | 30 | 0.01 | $ 34.61 | $ 72,000 |
| Natural Gas Distribution | 80 | 0.07 | $ 32.77 | $ 68,160 |
| Architectural, Engineering, and Related Services | 210 | 0.01 | $ 32.56 | $ 67,720 |
States and areas with the highest published employment, location quotients, and wages for Miscellaneous Construction and Related Workers are provided. For a list of all areas with employment in Miscellaneous Construction and Related Workers, see the Create Customized Tables function.
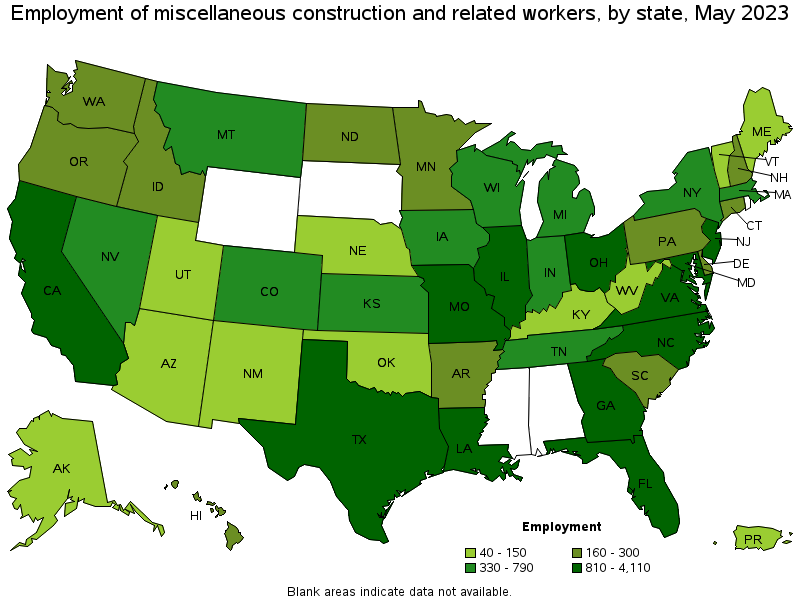
States with the highest employment level in Miscellaneous Construction and Related Workers:
| State | Employment (1) | Employment per thousand jobs | Location quotient (9) | Hourly mean wage | Annual mean wage (2) |
|---|---|---|---|---|---|
| Georgia | 4,110 | 0.86 | 4.54 | $ 23.74 | $ 49,380 |
| Florida | 2,870 | 0.30 | 1.57 | $ 22.36 | $ 46,520 |
| California | 2,360 | 0.13 | 0.69 | $ 36.54 | $ 76,000 |
| New Jersey | 1,570 | 0.37 | 1.96 | $ 24.52 | $ 50,990 |
| Louisiana | 1,450 | 0.78 | 4.11 | $ 25.93 | $ 53,940 |
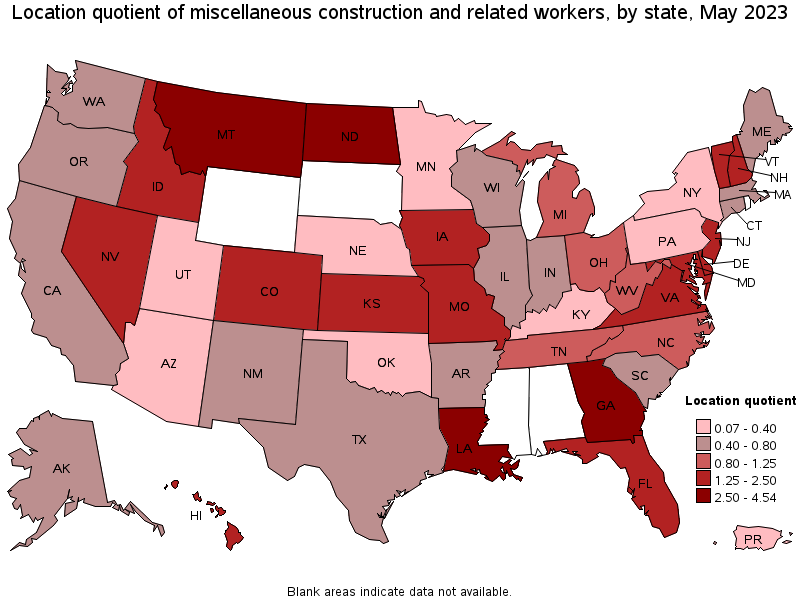
States with the highest concentration of jobs and location quotients in Miscellaneous Construction and Related Workers:
| State | Employment (1) | Employment per thousand jobs | Location quotient (9) | Hourly mean wage | Annual mean wage (2) |
|---|---|---|---|---|---|
| Georgia | 4,110 | 0.86 | 4.54 | $ 23.74 | $ 49,380 |
| Montana | 420 | 0.83 | 4.37 | $ 22.34 | $ 46,470 |
| Louisiana | 1,450 | 0.78 | 4.11 | $ 25.93 | $ 53,940 |
| North Dakota | 230 | 0.56 | 2.92 | $ 26.00 | $ 54,080 |
| Delaware | 200 | 0.43 | 2.28 | $ 23.18 | $ 48,210 |
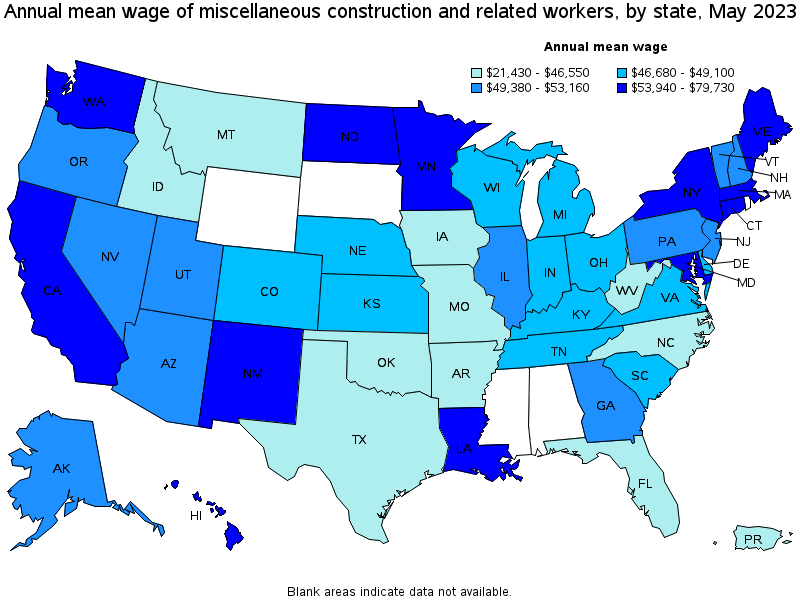
Top paying states for Miscellaneous Construction and Related Workers:
| State | Employment (1) | Employment per thousand jobs | Location quotient (9) | Hourly mean wage | Annual mean wage (2) |
|---|---|---|---|---|---|
| Maine | 60 | 0.09 | 0.48 | $ 38.33 | $ 79,730 |
| Massachusetts | 360 | 0.10 | 0.52 | $ 36.57 | $ 76,070 |
| California | 2,360 | 0.13 | 0.69 | $ 36.54 | $ 76,000 |
| Connecticut | 190 | 0.11 | 0.60 | $ 35.35 | $ 73,530 |
| New Mexico | 100 | 0.12 | 0.65 | $ 33.24 | $ 69,140 |
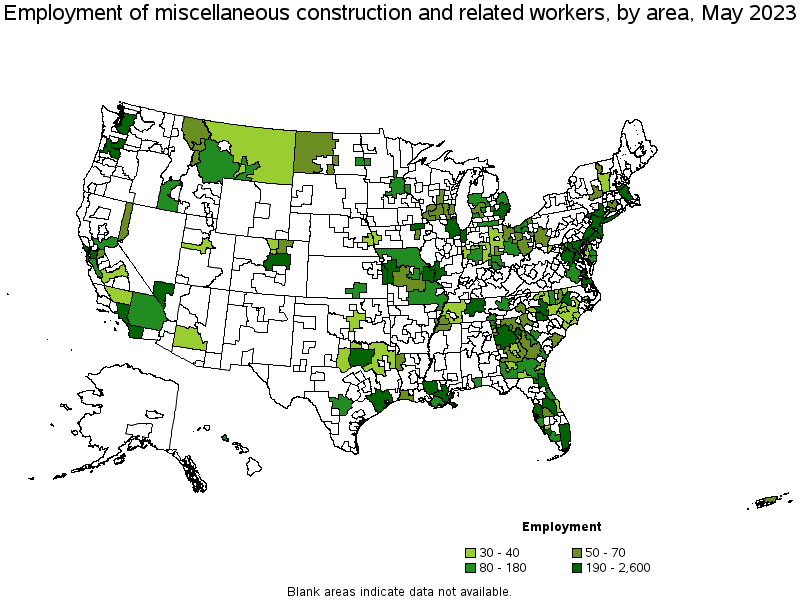
Metropolitan areas with the highest employment level in Miscellaneous Construction and Related Workers:
| Metropolitan area | Employment (1) | Employment per thousand jobs | Location quotient (9) | Hourly mean wage | Annual mean wage (2) |
|---|---|---|---|---|---|
| Atlanta-Sandy Springs-Roswell, GA | 2,600 | 0.92 | 4.84 | $ 25.48 | $ 53,000 |
| New York-Newark-Jersey City, NY-NJ-PA | 1,430 | 0.15 | 0.79 | $ 25.59 | $ 53,220 |
| Washington-Arlington-Alexandria, DC-VA-MD-WV | 790 | 0.25 | 1.34 | $ 27.27 | $ 56,730 |
| Los Angeles-Long Beach-Anaheim, CA | 720 | 0.12 | 0.61 | $ 35.45 | $ 73,740 |
| Miami-Fort Lauderdale-West Palm Beach, FL | 670 | 0.25 | 1.30 | $ 23.81 | $ 49,520 |
| Chicago-Naperville-Elgin, IL-IN-WI | 660 | 0.15 | 0.76 | $ 23.20 | $ 48,250 |
| Baton Rouge, LA | 610 | 1.59 | 8.33 | $ 27.36 | $ 56,910 |
| Baltimore-Columbia-Towson, MD | 470 | 0.36 | 1.91 | $ 24.75 | $ 51,490 |
| Kansas City, MO-KS | 470 | 0.43 | 2.28 | $ 22.90 | $ 47,620 |
| Las Vegas-Henderson-Paradise, NV | 470 | 0.43 | 2.26 | $ 24.39 | $ 50,740 |
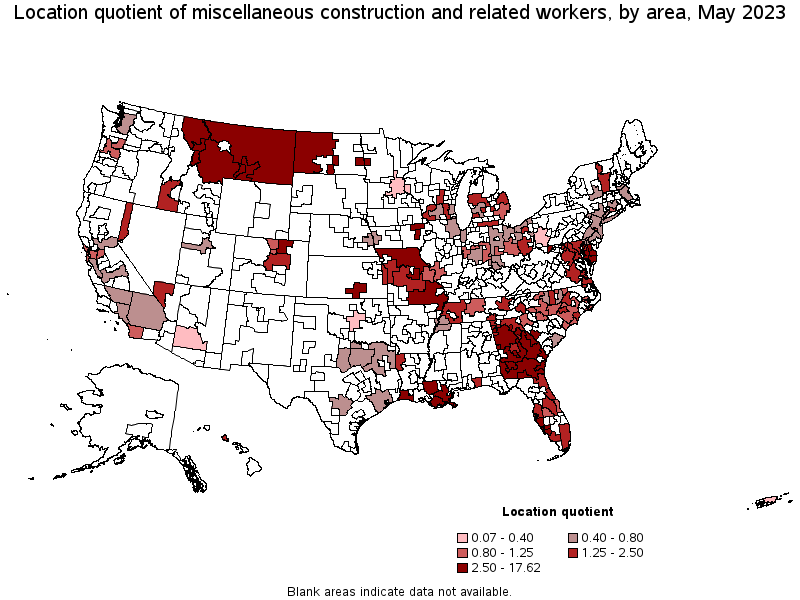
Metropolitan areas with the highest concentration of jobs and location quotients in Miscellaneous Construction and Related Workers:
| Metropolitan area | Employment (1) | Employment per thousand jobs | Location quotient (9) | Hourly mean wage | Annual mean wage (2) |
|---|---|---|---|---|---|
| Athens-Clarke County, GA | 300 | 3.36 | 17.62 | $ 22.90 | $ 47,630 |
| Jefferson City, MO | 180 | 2.33 | 12.25 | $ 21.46 | $ 44,640 |
| Baton Rouge, LA | 610 | 1.59 | 8.33 | $ 27.36 | $ 56,910 |
| Houma-Thibodaux, LA | 130 | 1.57 | 8.26 | $ 23.42 | $ 48,710 |
| Cedar Rapids, IA | 210 | 1.47 | 7.74 | $ 20.90 | $ 43,480 |
| Billings, MT | 130 | 1.40 | 7.34 | $ 21.78 | $ 45,290 |
| Gainesville, GA | 120 | 1.20 | 6.30 | $ 21.14 | $ 43,960 |
| Missoula, MT | 70 | 1.08 | 5.70 | $ 20.14 | $ 41,890 |
| Atlanta-Sandy Springs-Roswell, GA | 2,600 | 0.92 | 4.84 | $ 25.48 | $ 53,000 |
| Cape Coral-Fort Myers, FL | 240 | 0.83 | 4.34 | $ 22.89 | $ 47,610 |
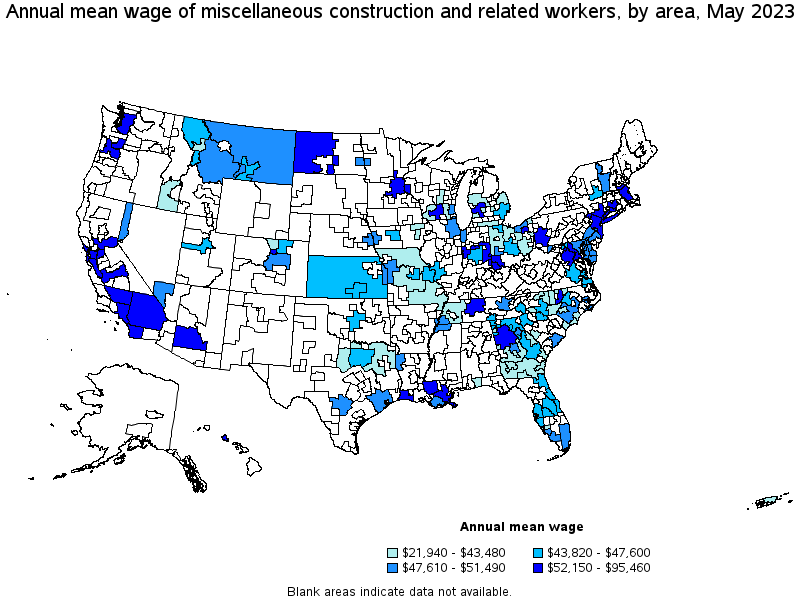
Top paying metropolitan areas for Miscellaneous Construction and Related Workers:
| Metropolitan area | Employment (1) | Employment per thousand jobs | Location quotient (9) | Hourly mean wage | Annual mean wage (2) |
|---|---|---|---|---|---|
| San Francisco-Oakland-Hayward, CA | 440 | 0.18 | 0.96 | $ 45.89 | $ 95,460 |
| San Jose-Sunnyvale-Santa Clara, CA | 100 | 0.09 | 0.47 | $ 43.66 | $ 90,800 |
| Boston-Cambridge-Nashua, MA-NH | 330 | 0.12 | 0.62 | $ 36.44 | $ 75,800 |
| New Haven, CT | 50 | 0.16 | 0.84 | $ 36.12 | $ 75,140 |
| Los Angeles-Long Beach-Anaheim, CA | 720 | 0.12 | 0.61 | $ 35.45 | $ 73,740 |
| Hartford-West Hartford-East Hartford, CT | 60 | 0.10 | 0.52 | $ 34.76 | $ 72,300 |
| Sacramento--Roseville--Arden-Arcade, CA | 140 | 0.13 | 0.68 | $ 34.24 | $ 71,210 |
| Minneapolis-St. Paul-Bloomington, MN-WI | 130 | 0.07 | 0.36 | $ 32.54 | $ 67,680 |
| San Diego-Carlsbad, CA | 230 | 0.15 | 0.81 | $ 31.99 | $ 66,540 |
| Bridgeport-Stamford-Norwalk, CT | 40 | 0.11 | 0.58 | $ 31.81 | $ 66,170 |
Nonmetropolitan areas with the highest employment in Miscellaneous Construction and Related Workers:
| Nonmetropolitan area | Employment (1) | Employment per thousand jobs | Location quotient (9) | Hourly mean wage | Annual mean wage (2) |
|---|---|---|---|---|---|
| North Missouri nonmetropolitan area | 160 | 1.49 | 7.82 | $ 18.50 | $ 38,480 |
| South Georgia nonmetropolitan area | 160 | 0.82 | 4.28 | $ 19.46 | $ 40,490 |
| Balance of Lower Peninsula of Michigan nonmetropolitan area | 110 | 0.41 | 2.17 | $ 17.56 | $ 36,520 |
| Southwest Montana nonmetropolitan area | 100 | 0.68 | 3.59 | $ 23.55 | $ 48,980 |
| Southeast Missouri nonmetropolitan area | 80 | 0.49 | 2.59 | $ 19.55 | $ 40,660 |
Nonmetropolitan areas with the highest concentration of jobs and location quotients in Miscellaneous Construction and Related Workers:
| Nonmetropolitan area | Employment (1) | Employment per thousand jobs | Location quotient (9) | Hourly mean wage | Annual mean wage (2) |
|---|---|---|---|---|---|
| North Missouri nonmetropolitan area | 160 | 1.49 | 7.82 | $ 18.50 | $ 38,480 |
| South Georgia nonmetropolitan area | 160 | 0.82 | 4.28 | $ 19.46 | $ 40,490 |
| West Montana nonmetropolitan area | 60 | 0.70 | 3.65 | $ 22.05 | $ 45,870 |
| Maryland nonmetropolitan area | 40 | 0.68 | 3.59 | $ 23.84 | $ 49,590 |
| Southwest Montana nonmetropolitan area | 100 | 0.68 | 3.59 | $ 23.55 | $ 48,980 |
Top paying nonmetropolitan areas for Miscellaneous Construction and Related Workers:
| Nonmetropolitan area | Employment (1) | Employment per thousand jobs | Location quotient (9) | Hourly mean wage | Annual mean wage (2) |
|---|---|---|---|---|---|
| West North Dakota nonmetropolitan area | 70 | 0.63 | 3.28 | $ 29.23 | $ 60,790 |
| Central Indiana nonmetropolitan area | 30 | 0.19 | 1.02 | $ 25.07 | $ 52,150 |
| Southeast Coastal North Carolina nonmetropolitan area | 40 | 0.17 | 0.87 | $ 24.24 | $ 50,420 |
| East-Central Montana nonmetropolitan area | 30 | 0.50 | 2.61 | $ 24.10 | $ 50,130 |
| Maryland nonmetropolitan area | 40 | 0.68 | 3.59 | $ 23.84 | $ 49,590 |
These estimates are calculated with data collected from employers in all industry sectors, all metropolitan and nonmetropolitan areas, and all states and the District of Columbia. The top employment and wage figures are provided above. The complete list is available in the downloadable XLS files.
The percentile wage estimate is the value of a wage below which a certain percent of workers fall. The median wage is the 50th percentile wage estimate—50 percent of workers earn less than the median and 50 percent of workers earn more than the median. More about percentile wages.
(1) Estimates for detailed occupations do not sum to the totals because the totals include occupations not shown separately. Estimates do not include self-employed workers.
(2) Annual wages have been calculated by multiplying the hourly mean wage by a "year-round, full-time" hours figure of 2,080 hours; for those occupations where there is not an hourly wage published, the annual wage has been directly calculated from the reported survey data.
(3) The relative standard error (RSE) is a measure of the reliability of a survey statistic. The smaller the relative standard error, the more precise the estimate.
(9) The location quotient is the ratio of the area concentration of occupational employment to the national average concentration. A location quotient greater than one indicates the occupation has a higher share of employment than average, and a location quotient less than one indicates the occupation is less prevalent in the area than average.
Other OEWS estimates and related information:
May 2023 National Occupational Employment and Wage Estimates
May 2023 State Occupational Employment and Wage Estimates
May 2023 Metropolitan and Nonmetropolitan Area Occupational Employment and Wage Estimates
May 2023 National Industry-Specific Occupational Employment and Wage Estimates
Last Modified Date: April 3, 2024