
An official website of the United States government
An official website of the United States government
The .gov means it's official.
Federal government websites often end in .gov or .mil. Before sharing sensitive information,
make sure you're on a federal government site.
The site is secure.
The
https:// ensures that you are connecting to the official website and that any
information you provide is encrypted and transmitted securely.
Raise, place, and unite iron or steel girders, columns, and other structural members to form completed structures or structural frameworks. May erect metal storage tanks and assemble prefabricated metal buildings. Excludes �Reinforcing Iron and Rebar Workers� (47-2171).
Employment estimate and mean wage estimates for Structural Iron and Steel Workers:
| Employment (1) | Employment RSE (3) |
Mean hourly wage |
Mean annual wage (2) |
Wage RSE (3) |
|---|---|---|---|---|
| 63,780 | 2.6 % | $ 32.80 | $ 68,220 | 1.1 % |
Percentile wage estimates for Structural Iron and Steel Workers:
| Percentile | 10% | 25% | 50% (Median) |
75% | 90% |
|---|---|---|---|---|---|
| Hourly Wage | $ 19.48 | $ 23.49 | $ 30.17 | $ 38.48 | $ 50.49 |
| Annual Wage (2) | $ 40,510 | $ 48,860 | $ 62,760 | $ 80,040 | $ 105,010 |
Industries with the highest published employment and wages for Structural Iron and Steel Workers are provided. For a list of all industries with employment in Structural Iron and Steel Workers, see the Create Customized Tables function.
Industries with the highest levels of employment in Structural Iron and Steel Workers:
| Industry | Employment (1) | Percent of industry employment | Hourly mean wage | Annual mean wage (2) |
|---|---|---|---|---|
| Foundation, Structure, and Building Exterior Contractors | 32,090 | 3.28 | $ 33.29 | $ 69,240 |
| Nonresidential Building Construction | 13,210 | 1.54 | $ 29.58 | $ 61,530 |
| Fabricated Metal Product Manufacturing (3323 and 3324 only) | 3,820 | 0.77 | $ 30.87 | $ 64,220 |
| Building Equipment Contractors | 2,910 | 0.12 | $ 35.13 | $ 73,060 |
| Other Specialty Trade Contractors | 2,470 | 0.32 | $ 39.11 | $ 81,340 |
Industries with the highest concentration of employment in Structural Iron and Steel Workers:
| Industry | Employment (1) | Percent of industry employment | Hourly mean wage | Annual mean wage (2) |
|---|---|---|---|---|
| Foundation, Structure, and Building Exterior Contractors | 32,090 | 3.28 | $ 33.29 | $ 69,240 |
| Nonresidential Building Construction | 13,210 | 1.54 | $ 29.58 | $ 61,530 |
| Fabricated Metal Product Manufacturing (3323 and 3324 only) | 3,820 | 0.77 | $ 30.87 | $ 64,220 |
| Iron and Steel Mills and Ferroalloy Manufacturing | 490 | 0.58 | $ 34.53 | $ 71,830 |
| Highway, Street, and Bridge Construction | 1,780 | 0.48 | $ 40.11 | $ 83,440 |
Top paying industries for Structural Iron and Steel Workers:
| Industry | Employment (1) | Percent of industry employment | Hourly mean wage | Annual mean wage (2) |
|---|---|---|---|---|
| Local Government, excluding Schools and Hospitals (OEWS Designation) | 450 | 0.01 | $ 44.06 | $ 91,630 |
| Facilities Support Services | (8) | (8) | $ 40.80 | $ 84,870 |
| Highway, Street, and Bridge Construction | 1,780 | 0.48 | $ 40.11 | $ 83,440 |
| Rail Transportation | 130 | 0.07 | $ 39.34 | $ 81,830 |
| Other Specialty Trade Contractors | 2,470 | 0.32 | $ 39.11 | $ 81,340 |
States and areas with the highest published employment, location quotients, and wages for Structural Iron and Steel Workers are provided. For a list of all areas with employment in Structural Iron and Steel Workers, see the Create Customized Tables function.
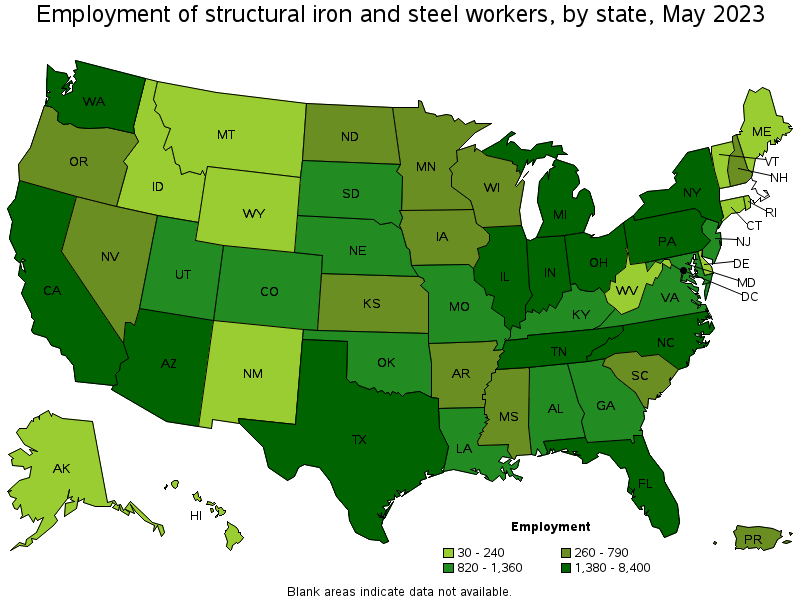
States with the highest employment level in Structural Iron and Steel Workers:
| State | Employment (1) | Employment per thousand jobs | Location quotient (9) | Hourly mean wage | Annual mean wage (2) |
|---|---|---|---|---|---|
| Texas | 8,400 | 0.62 | 1.47 | $ 24.01 | $ 49,940 |
| California | 7,730 | 0.43 | 1.03 | $ 37.44 | $ 77,870 |
| New York | 3,480 | 0.37 | 0.88 | $ 44.56 | $ 92,670 |
| Illinois | 3,180 | 0.53 | 1.26 | $ 45.56 | $ 94,760 |
| Ohio | 2,860 | 0.52 | 1.24 | $ 33.86 | $ 70,420 |
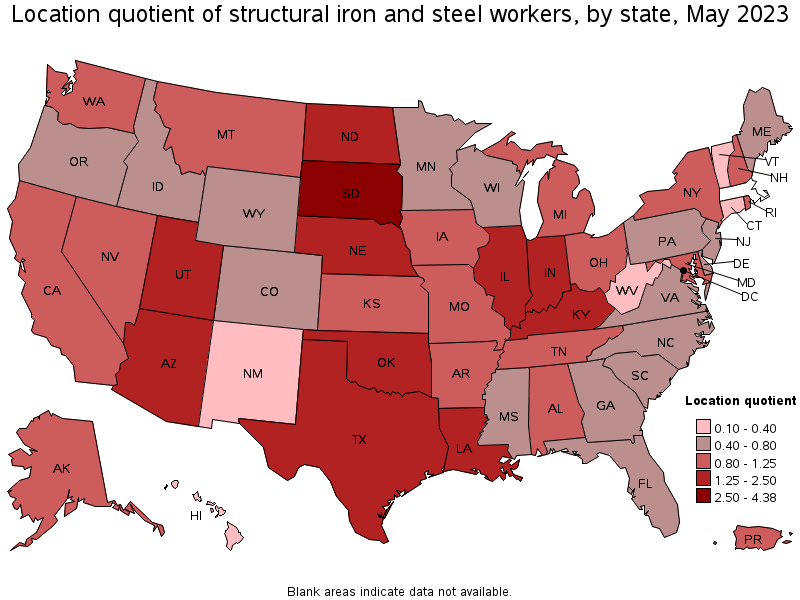
States with the highest concentration of jobs and location quotients in Structural Iron and Steel Workers:
| State | Employment (1) | Employment per thousand jobs | Location quotient (9) | Hourly mean wage | Annual mean wage (2) |
|---|---|---|---|---|---|
| South Dakota | 820 | 1.84 | 4.38 | $ 25.10 | $ 52,210 |
| Nebraska | 920 | 0.92 | 2.20 | $ 30.01 | $ 62,410 |
| Arizona | 2,500 | 0.80 | 1.90 | $ 27.76 | $ 57,730 |
| Louisiana | 1,360 | 0.74 | 1.75 | $ 30.89 | $ 64,260 |
| Indiana | 2,290 | 0.73 | 1.73 | $ 31.91 | $ 66,380 |
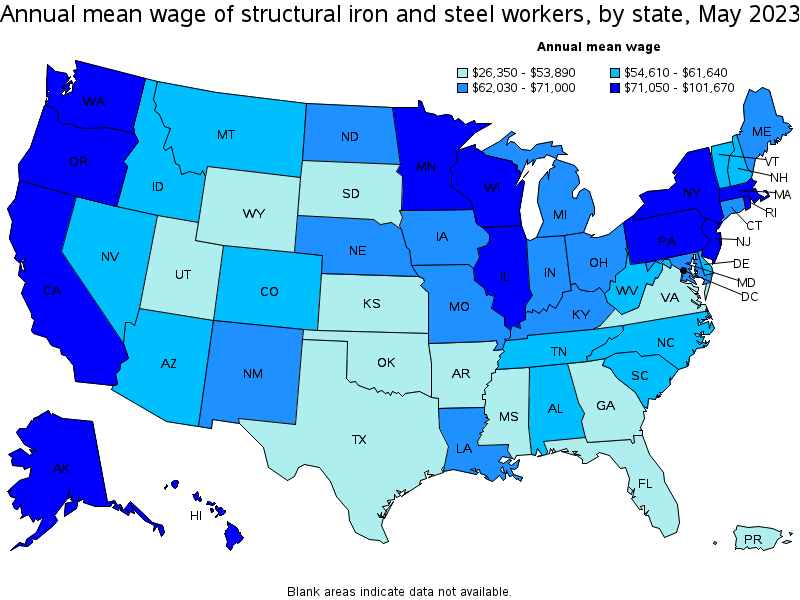
Top paying states for Structural Iron and Steel Workers:
| State | Employment (1) | Employment per thousand jobs | Location quotient (9) | Hourly mean wage | Annual mean wage (2) |
|---|---|---|---|---|---|
| New Jersey | 920 | 0.22 | 0.52 | $ 48.88 | $ 101,670 |
| Massachusetts | (8) | (8) | (8) | $ 46.89 | $ 97,520 |
| Illinois | 3,180 | 0.53 | 1.26 | $ 45.56 | $ 94,760 |
| New York | 3,480 | 0.37 | 0.88 | $ 44.56 | $ 92,670 |
| Washington | 1,500 | 0.43 | 1.02 | $ 44.31 | $ 92,160 |
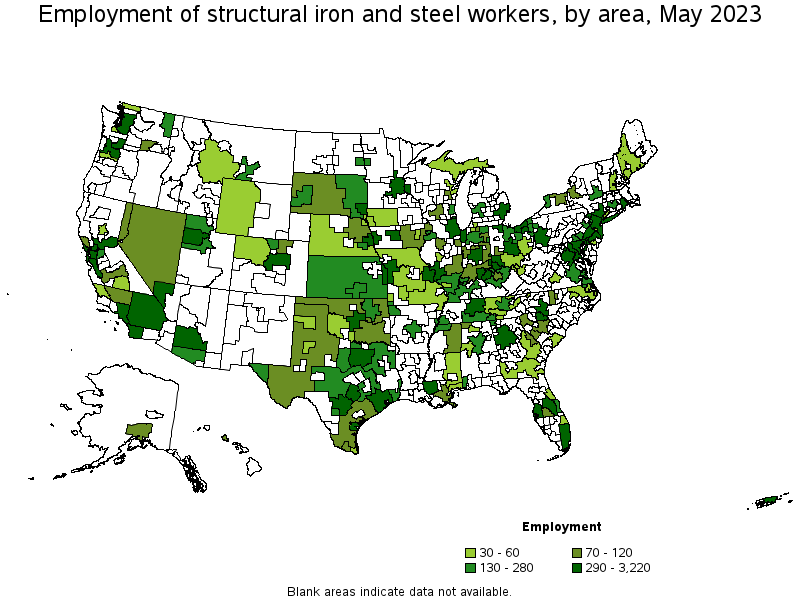
Metropolitan areas with the highest employment level in Structural Iron and Steel Workers:
| Metropolitan area | Employment (1) | Employment per thousand jobs | Location quotient (9) | Hourly mean wage | Annual mean wage (2) |
|---|---|---|---|---|---|
| New York-Newark-Jersey City, NY-NJ-PA | 3,220 | 0.34 | 0.81 | $ 47.26 | $ 98,290 |
| Houston-The Woodlands-Sugar Land, TX | 3,180 | 1.00 | 2.38 | $ 24.36 | $ 50,660 |
| Chicago-Naperville-Elgin, IL-IN-WI | 2,480 | 0.55 | 1.31 | $ 46.94 | $ 97,630 |
| Los Angeles-Long Beach-Anaheim, CA | 2,300 | 0.37 | 0.89 | $ 36.84 | $ 76,640 |
| Phoenix-Mesa-Scottsdale, AZ | 2,160 | 0.94 | 2.24 | $ 28.17 | $ 58,600 |
| Dallas-Fort Worth-Arlington, TX | 1,950 | 0.49 | 1.17 | $ 24.18 | $ 50,290 |
| Washington-Arlington-Alexandria, DC-VA-MD-WV | 1,270 | 0.41 | 0.98 | $ 32.72 | $ 68,050 |
| Riverside-San Bernardino-Ontario, CA | 1,110 | 0.67 | 1.59 | $ 34.46 | $ 71,670 |
| Seattle-Tacoma-Bellevue, WA | 990 | 0.47 | 1.13 | $ 46.46 | $ 96,640 |
| Detroit-Warren-Dearborn, MI | 970 | 0.51 | 1.21 | $ 33.74 | $ 70,190 |
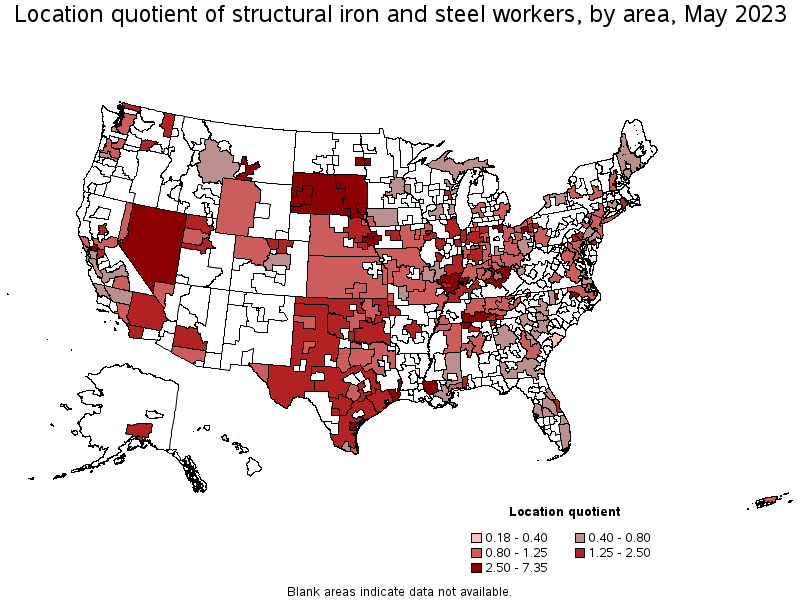
Metropolitan areas with the highest concentration of jobs and location quotients in Structural Iron and Steel Workers:
| Metropolitan area | Employment (1) | Employment per thousand jobs | Location quotient (9) | Hourly mean wage | Annual mean wage (2) |
|---|---|---|---|---|---|
| Vallejo-Fairfield, CA | 430 | 3.09 | 7.35 | $ 40.44 | $ 84,110 |
| Sioux Falls, SD | 340 | 2.06 | 4.89 | $ 25.69 | $ 53,430 |
| Rapid City, SD | 140 | 1.99 | 4.74 | $ 24.95 | $ 51,890 |
| Corpus Christi, TX | 340 | 1.81 | 4.32 | $ 25.02 | $ 52,040 |
| Beaumont-Port Arthur, TX | 280 | 1.80 | 4.28 | $ 28.31 | $ 58,880 |
| Billings, MT | 130 | 1.42 | 3.39 | $ 29.80 | $ 61,980 |
| Akron, OH | 450 | 1.39 | 3.32 | $ 35.29 | $ 73,410 |
| Fargo, ND-MN | 200 | 1.39 | 3.30 | $ 32.19 | $ 66,960 |
| Burlington, NC | 90 | 1.37 | 3.26 | $ 23.61 | $ 49,100 |
| Toledo, OH | 380 | 1.33 | 3.16 | $ 33.74 | $ 70,180 |
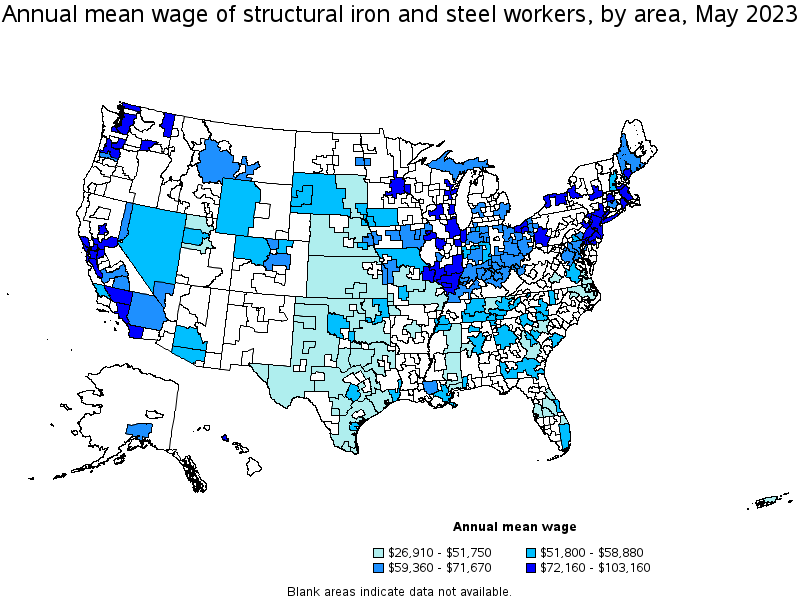
Top paying metropolitan areas for Structural Iron and Steel Workers:
| Metropolitan area | Employment (1) | Employment per thousand jobs | Location quotient (9) | Hourly mean wage | Annual mean wage (2) |
|---|---|---|---|---|---|
| Trenton, NJ | 60 | 0.23 | 0.56 | $ 49.60 | $ 103,160 |
| New York-Newark-Jersey City, NY-NJ-PA | 3,220 | 0.34 | 0.81 | $ 47.26 | $ 98,290 |
| Chicago-Naperville-Elgin, IL-IN-WI | 2,480 | 0.55 | 1.31 | $ 46.94 | $ 97,630 |
| Boston-Cambridge-Nashua, MA-NH | (8) | (8) | (8) | $ 46.81 | $ 97,360 |
| Seattle-Tacoma-Bellevue, WA | 990 | 0.47 | 1.13 | $ 46.46 | $ 96,640 |
| Olympia-Tumwater, WA | 30 | 0.26 | 0.61 | $ 45.61 | $ 94,870 |
| Providence-Warwick, RI-MA | 440 | 0.77 | 1.82 | $ 44.01 | $ 91,540 |
| Springfield, MA-CT | (8) | (8) | (8) | $ 43.28 | $ 90,030 |
| San Francisco-Oakland-Hayward, CA | 770 | 0.32 | 0.76 | $ 43.04 | $ 89,530 |
| Urban Honolulu, HI | 70 | 0.16 | 0.38 | $ 42.75 | $ 88,910 |
Nonmetropolitan areas with the highest employment in Structural Iron and Steel Workers:
| Nonmetropolitan area | Employment (1) | Employment per thousand jobs | Location quotient (9) | Hourly mean wage | Annual mean wage (2) |
|---|---|---|---|---|---|
| Central Kentucky nonmetropolitan area | 240 | 1.30 | 3.10 | $ 31.35 | $ 65,210 |
| East South Dakota nonmetropolitan area | 210 | 1.60 | 3.81 | $ 24.05 | $ 50,030 |
| South Central Tennessee nonmetropolitan area | 190 | 1.71 | 4.08 | $ 26.67 | $ 55,470 |
| South Illinois nonmetropolitan area | 180 | 2.13 | 5.06 | $ 35.37 | $ 73,570 |
| Northern Indiana nonmetropolitan area | 170 | 0.82 | 1.95 | $ 30.17 | $ 62,750 |
Nonmetropolitan areas with the highest concentration of jobs and location quotients in Structural Iron and Steel Workers:
| Nonmetropolitan area | Employment (1) | Employment per thousand jobs | Location quotient (9) | Hourly mean wage | Annual mean wage (2) |
|---|---|---|---|---|---|
| South Illinois nonmetropolitan area | 180 | 2.13 | 5.06 | $ 35.37 | $ 73,570 |
| South Central Tennessee nonmetropolitan area | 190 | 1.71 | 4.08 | $ 26.67 | $ 55,470 |
| West South Dakota nonmetropolitan area | 100 | 1.64 | 3.90 | $ 25.21 | $ 52,430 |
| East South Dakota nonmetropolitan area | 210 | 1.60 | 3.81 | $ 24.05 | $ 50,030 |
| Central Kentucky nonmetropolitan area | 240 | 1.30 | 3.10 | $ 31.35 | $ 65,210 |
Top paying nonmetropolitan areas for Structural Iron and Steel Workers:
| Nonmetropolitan area | Employment (1) | Employment per thousand jobs | Location quotient (9) | Hourly mean wage | Annual mean wage (2) |
|---|---|---|---|---|---|
| South Illinois nonmetropolitan area | 180 | 2.13 | 5.06 | $ 35.37 | $ 73,570 |
| East Central Illinois nonmetropolitan area | 90 | 0.75 | 1.79 | $ 34.69 | $ 72,160 |
| North Northeastern Ohio nonmetropolitan area (noncontiguous) | 150 | 0.47 | 1.12 | $ 32.37 | $ 67,320 |
| Upper Peninsula of Michigan nonmetropolitan area | 40 | 0.32 | 0.77 | $ 32.05 | $ 66,660 |
| Eastern Ohio nonmetropolitan area | 40 | 0.33 | 0.79 | $ 31.88 | $ 66,320 |
These estimates are calculated with data collected from employers in all industry sectors, all metropolitan and nonmetropolitan areas, and all states and the District of Columbia. The top employment and wage figures are provided above. The complete list is available in the downloadable XLS files.
The percentile wage estimate is the value of a wage below which a certain percent of workers fall. The median wage is the 50th percentile wage estimate—50 percent of workers earn less than the median and 50 percent of workers earn more than the median. More about percentile wages.
(1) Estimates for detailed occupations do not sum to the totals because the totals include occupations not shown separately. Estimates do not include self-employed workers.
(2) Annual wages have been calculated by multiplying the hourly mean wage by a "year-round, full-time" hours figure of 2,080 hours; for those occupations where there is not an hourly wage published, the annual wage has been directly calculated from the reported survey data.
(3) The relative standard error (RSE) is a measure of the reliability of a survey statistic. The smaller the relative standard error, the more precise the estimate.
(8) Estimate not released.
(9) The location quotient is the ratio of the area concentration of occupational employment to the national average concentration. A location quotient greater than one indicates the occupation has a higher share of employment than average, and a location quotient less than one indicates the occupation is less prevalent in the area than average.
Other OEWS estimates and related information:
May 2023 National Occupational Employment and Wage Estimates
May 2023 State Occupational Employment and Wage Estimates
May 2023 Metropolitan and Nonmetropolitan Area Occupational Employment and Wage Estimates
May 2023 National Industry-Specific Occupational Employment and Wage Estimates
Last Modified Date: April 3, 2024