
An official website of the United States government
An official website of the United States government
The .gov means it's official.
Federal government websites often end in .gov or .mil. Before sharing sensitive information,
make sure you're on a federal government site.
The site is secure.
The
https:// ensures that you are connecting to the official website and that any
information you provide is encrypted and transmitted securely.
Compile records, and sort, shelve, issue, and receive library materials such as books, electronic media, pictures, cards, slides and microfilm. Locate library materials for loan and replace material in shelving area, stacks, or files according to identification number and title. Register patrons to permit them to borrow books, periodicals, and other library materials. Excludes �Library Technicians� (25-4031).
Employment estimate and mean wage estimates for Library Assistants, Clerical:
| Employment (1) | Employment RSE (3) |
Mean hourly wage |
Mean annual wage (2) |
Wage RSE (3) |
|---|---|---|---|---|
| 83,680 | 1.4 % | $ 17.29 | $ 35,970 | 0.3 % |
Percentile wage estimates for Library Assistants, Clerical:
| Percentile | 10% | 25% | 50% (Median) |
75% | 90% |
|---|---|---|---|---|---|
| Hourly Wage | $ 11.30 | $ 13.79 | $ 16.36 | $ 19.86 | $ 24.14 |
| Annual Wage (2) | $ 23,510 | $ 28,670 | $ 34,020 | $ 41,300 | $ 50,200 |
Industries with the highest published employment and wages for Library Assistants, Clerical are provided. For a list of all industries with employment in Library Assistants, Clerical, see the Create Customized Tables function.
Industries with the highest levels of employment in Library Assistants, Clerical:
| Industry | Employment (1) | Percent of industry employment | Hourly mean wage | Annual mean wage (2) |
|---|---|---|---|---|
| Local Government, excluding Schools and Hospitals (OEWS Designation) | 53,920 | 0.98 | $ 17.04 | $ 35,440 |
| Elementary and Secondary Schools | 11,780 | 0.14 | $ 17.79 | $ 37,000 |
| Web Search Portals, Libraries, Archives, and Other Information Services | 7,580 | 4.11 | $ 16.51 | $ 34,340 |
| Colleges, Universities, and Professional Schools | 7,570 | 0.24 | $ 18.96 | $ 39,430 |
| Junior Colleges | 1,390 | 0.22 | $ 16.89 | $ 35,140 |
Industries with the highest concentration of employment in Library Assistants, Clerical:
| Industry | Employment (1) | Percent of industry employment | Hourly mean wage | Annual mean wage (2) |
|---|---|---|---|---|
| Web Search Portals, Libraries, Archives, and Other Information Services | 7,580 | 4.11 | $ 16.51 | $ 34,340 |
| Local Government, excluding Schools and Hospitals (OEWS Designation) | 53,920 | 0.98 | $ 17.04 | $ 35,440 |
| Colleges, Universities, and Professional Schools | 7,570 | 0.24 | $ 18.96 | $ 39,430 |
| Junior Colleges | 1,390 | 0.22 | $ 16.89 | $ 35,140 |
| Elementary and Secondary Schools | 11,780 | 0.14 | $ 17.79 | $ 37,000 |
Top paying industries for Library Assistants, Clerical:
| Industry | Employment (1) | Percent of industry employment | Hourly mean wage | Annual mean wage (2) |
|---|---|---|---|---|
| Legal Services | 80 | 0.01 | $ 29.82 | $ 62,020 |
| General Medical and Surgical Hospitals | 90 | (7) | $ 21.67 | $ 45,080 |
| Management, Scientific, and Technical Consulting Services | (8) | (8) | $ 21.10 | $ 43,890 |
| State Government, excluding Schools and Hospitals (OEWS Designation) | 400 | 0.02 | $ 18.98 | $ 39,480 |
| Colleges, Universities, and Professional Schools | 7,570 | 0.24 | $ 18.96 | $ 39,430 |
States and areas with the highest published employment, location quotients, and wages for Library Assistants, Clerical are provided. For a list of all areas with employment in Library Assistants, Clerical, see the Create Customized Tables function.
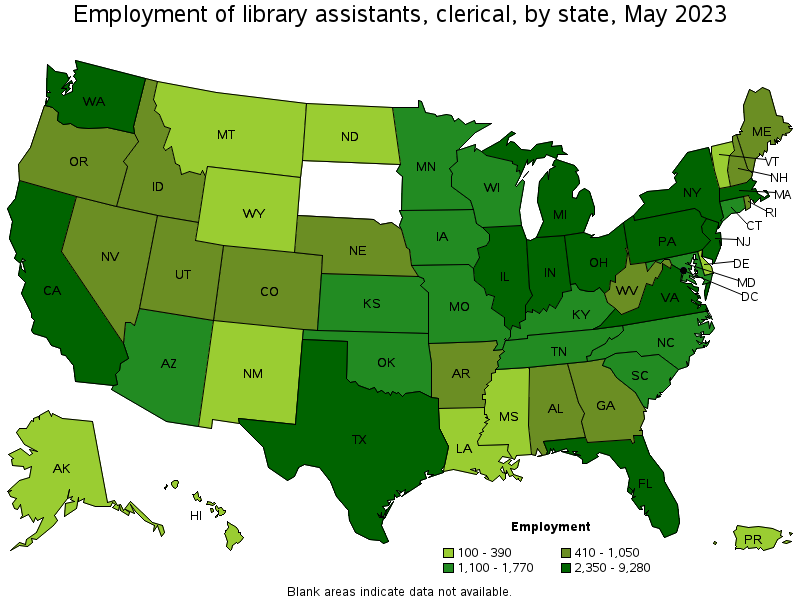
States with the highest employment level in Library Assistants, Clerical:
| State | Employment (1) | Employment per thousand jobs | Location quotient (9) | Hourly mean wage | Annual mean wage (2) |
|---|---|---|---|---|---|
| California | 9,280 | 0.52 | 0.94 | $ 23.12 | $ 48,090 |
| New York | 6,530 | 0.70 | 1.26 | $ 18.32 | $ 38,110 |
| Ohio | 5,770 | 1.05 | 1.91 | $ 15.86 | $ 33,000 |
| Illinois | 5,010 | 0.83 | 1.51 | $ 16.19 | $ 33,680 |
| Pennsylvania | 4,410 | 0.74 | 1.34 | $ 14.63 | $ 30,420 |
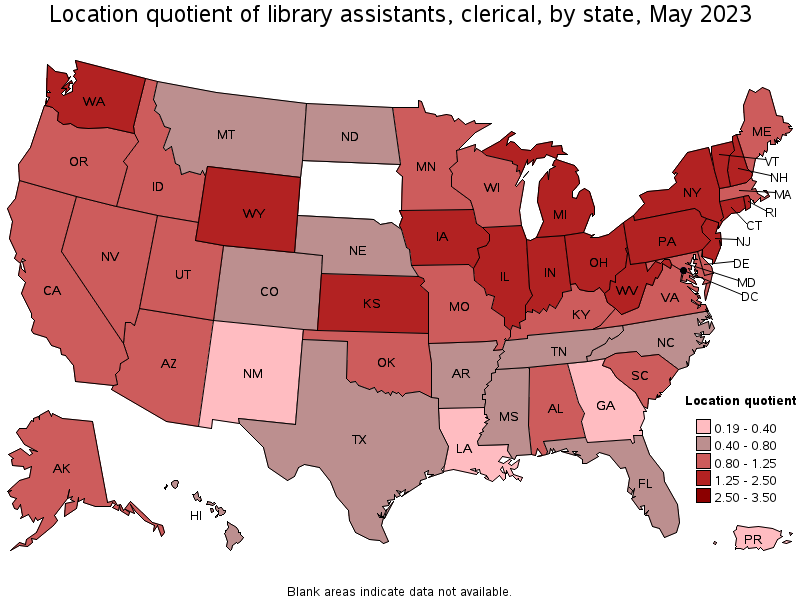
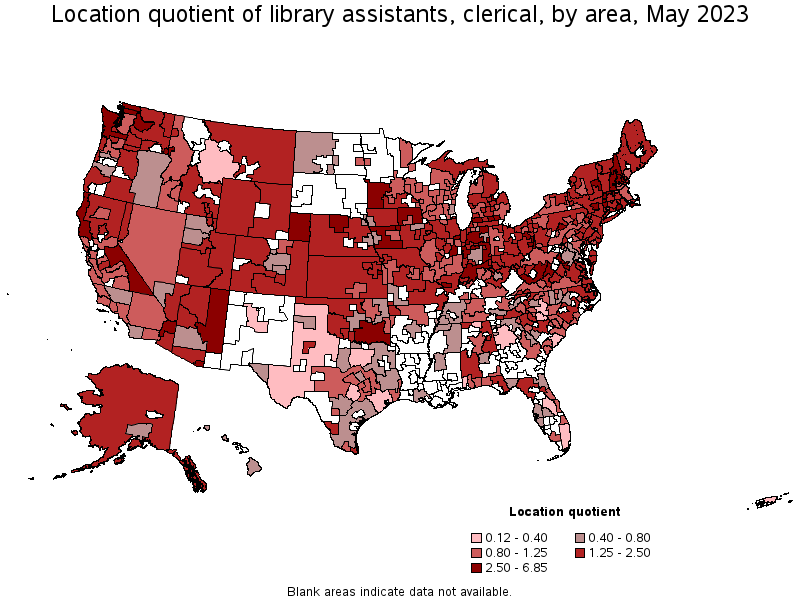
States with the highest concentration of jobs and location quotients in Library Assistants, Clerical:
| State | Employment (1) | Employment per thousand jobs | Location quotient (9) | Hourly mean wage | Annual mean wage (2) |
|---|---|---|---|---|---|
| New Hampshire | 920 | 1.37 | 2.48 | $ 16.55 | $ 34,430 |
| Rhode Island | 540 | 1.11 | 2.02 | $ 17.25 | $ 35,890 |
| Ohio | 5,770 | 1.05 | 1.91 | $ 15.86 | $ 33,000 |
| Vermont | 310 | 1.03 | 1.88 | $ 17.09 | $ 35,540 |
| Connecticut | 1,520 | 0.92 | 1.66 | $ 19.11 | $ 39,740 |
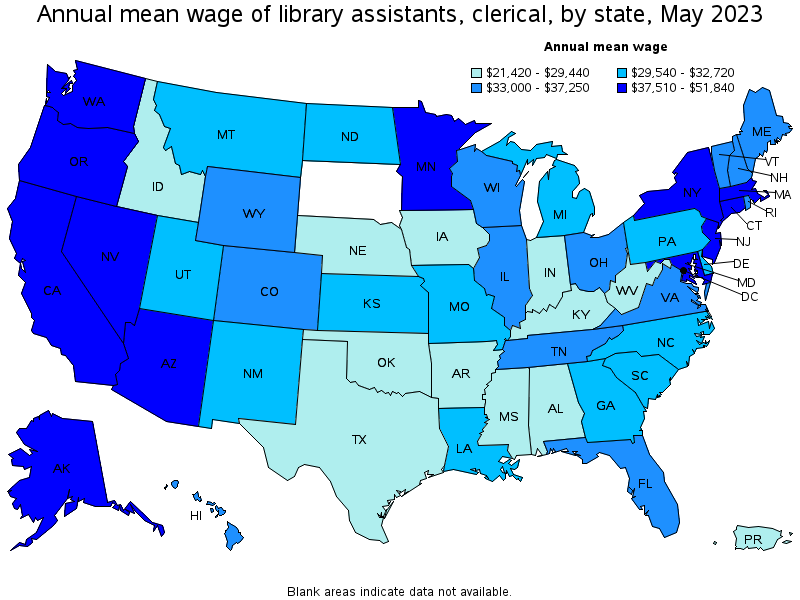
Top paying states for Library Assistants, Clerical:
| State | Employment (1) | Employment per thousand jobs | Location quotient (9) | Hourly mean wage | Annual mean wage (2) |
|---|---|---|---|---|---|
| District of Columbia | 100 | 0.14 | 0.25 | $ 24.92 | $ 51,840 |
| California | 9,280 | 0.52 | 0.94 | $ 23.12 | $ 48,090 |
| Massachusetts | 2,350 | 0.65 | 1.17 | $ 21.85 | $ 45,440 |
| Washington | 3,070 | 0.88 | 1.60 | $ 21.34 | $ 44,390 |
| Nevada | 720 | 0.49 | 0.89 | $ 21.09 | $ 43,870 |
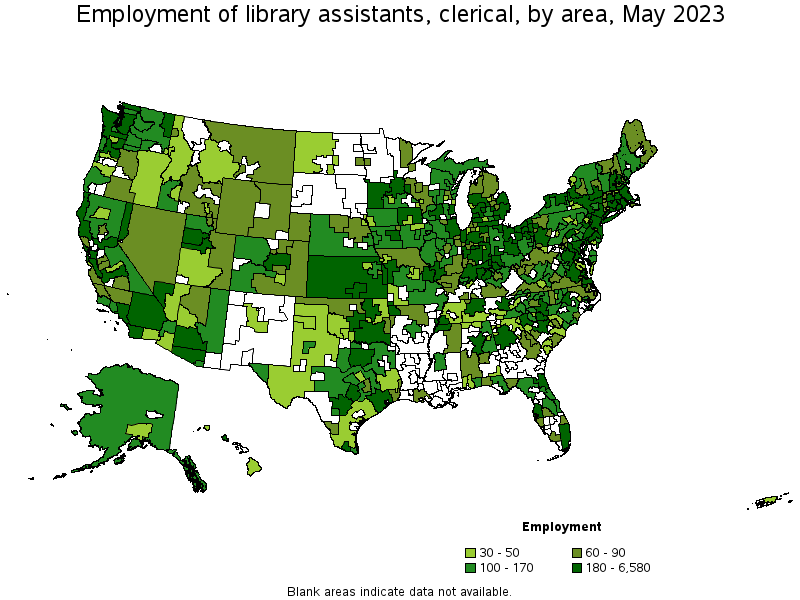
Metropolitan areas with the highest employment level in Library Assistants, Clerical:
| Metropolitan area | Employment (1) | Employment per thousand jobs | Location quotient (9) | Hourly mean wage | Annual mean wage (2) |
|---|---|---|---|---|---|
| New York-Newark-Jersey City, NY-NJ-PA | 6,580 | 0.69 | 1.26 | $ 19.30 | $ 40,150 |
| Chicago-Naperville-Elgin, IL-IN-WI | 3,840 | 0.85 | 1.55 | $ 16.46 | $ 34,240 |
| Los Angeles-Long Beach-Anaheim, CA | 3,080 | 0.50 | 0.90 | $ 22.88 | $ 47,580 |
| Philadelphia-Camden-Wilmington, PA-NJ-DE-MD | 1,960 | 0.69 | 1.26 | $ 16.84 | $ 35,040 |
| Boston-Cambridge-Nashua, MA-NH | 1,850 | 0.67 | 1.21 | $ 22.43 | $ 46,650 |
| San Francisco-Oakland-Hayward, CA | 1,380 | 0.57 | 1.04 | $ 28.54 | $ 59,370 |
| Cleveland-Elyria, OH | 1,300 | 1.30 | 2.35 | $ 16.10 | $ 33,490 |
| Seattle-Tacoma-Bellevue, WA | 1,230 | 0.59 | 1.07 | $ 22.64 | $ 47,090 |
| Washington-Arlington-Alexandria, DC-VA-MD-WV | 1,220 | 0.39 | 0.71 | $ 20.33 | $ 42,280 |
| Cincinnati, OH-KY-IN | 1,210 | 1.12 | 2.03 | $ 15.91 | $ 33,090 |
Metropolitan areas with the highest concentration of jobs and location quotients in Library Assistants, Clerical:
| Metropolitan area | Employment (1) | Employment per thousand jobs | Location quotient (9) | Hourly mean wage | Annual mean wage (2) |
|---|---|---|---|---|---|
| Ann Arbor, MI | 810 | 3.77 | 6.85 | $ 16.48 | $ 34,280 |
| Weirton-Steubenville, WV-OH | 110 | 2.89 | 5.25 | $ 14.42 | $ 29,990 |
| Mount Vernon-Anacortes, WA | 140 | 2.88 | 5.22 | $ 21.82 | $ 45,380 |
| Wheeling, WV-OH | 160 | 2.81 | 5.10 | $ 13.65 | $ 28,400 |
| Ocean City, NJ | 110 | 2.71 | 4.92 | $ 20.90 | $ 43,470 |
| Bellingham, WA | 220 | 2.45 | 4.45 | $ 20.36 | $ 42,340 |
| Wenatchee, WA | 120 | 2.40 | 4.35 | $ 19.93 | $ 41,460 |
| Kingston, NY | 130 | 2.31 | 4.20 | $ 16.68 | $ 34,680 |
| Bay City, MI | 80 | 2.27 | 4.12 | $ 15.94 | $ 33,160 |
| State College, PA | 140 | 2.09 | 3.79 | $ 13.86 | $ 28,830 |
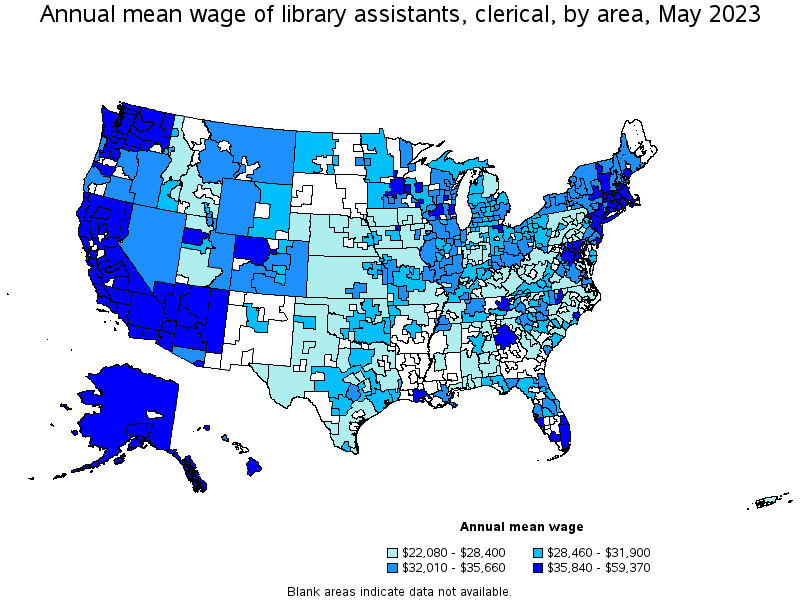
Top paying metropolitan areas for Library Assistants, Clerical:
| Metropolitan area | Employment (1) | Employment per thousand jobs | Location quotient (9) | Hourly mean wage | Annual mean wage (2) |
|---|---|---|---|---|---|
| San Francisco-Oakland-Hayward, CA | 1,380 | 0.57 | 1.04 | $ 28.54 | $ 59,370 |
| San Jose-Sunnyvale-Santa Clara, CA | 740 | 0.65 | 1.17 | $ 27.49 | $ 57,180 |
| Visalia-Porterville, CA | 80 | 0.47 | 0.85 | $ 22.96 | $ 47,750 |
| Reno, NV | 190 | 0.73 | 1.33 | $ 22.88 | $ 47,590 |
| Los Angeles-Long Beach-Anaheim, CA | 3,080 | 0.50 | 0.90 | $ 22.88 | $ 47,580 |
| Seattle-Tacoma-Bellevue, WA | 1,230 | 0.59 | 1.07 | $ 22.64 | $ 47,090 |
| Santa Maria-Santa Barbara, CA | 100 | 0.50 | 0.91 | $ 22.61 | $ 47,020 |
| Boston-Cambridge-Nashua, MA-NH | 1,850 | 0.67 | 1.21 | $ 22.43 | $ 46,650 |
| Modesto, CA | 90 | 0.49 | 0.88 | $ 22.31 | $ 46,400 |
| Portland-Vancouver-Hillsboro, OR-WA | 720 | 0.60 | 1.09 | $ 22.07 | $ 45,900 |
Nonmetropolitan areas with the highest employment in Library Assistants, Clerical:
| Nonmetropolitan area | Employment (1) | Employment per thousand jobs | Location quotient (9) | Hourly mean wage | Annual mean wage (2) |
|---|---|---|---|---|---|
| Kansas nonmetropolitan area | 450 | 1.16 | 2.10 | $ 11.68 | $ 24,300 |
| Southeast Oklahoma nonmetropolitan area | 360 | 2.07 | 3.76 | $ 13.70 | $ 28,500 |
| Central Indiana nonmetropolitan area | 340 | 2.19 | 3.97 | $ 12.25 | $ 25,490 |
| Northern Indiana nonmetropolitan area | 330 | 1.56 | 2.82 | $ 13.21 | $ 27,470 |
| Balance of Lower Peninsula of Michigan nonmetropolitan area | 280 | 1.07 | 1.95 | $ 13.89 | $ 28,900 |
Nonmetropolitan areas with the highest concentration of jobs and location quotients in Library Assistants, Clerical:
| Nonmetropolitan area | Employment (1) | Employment per thousand jobs | Location quotient (9) | Hourly mean wage | Annual mean wage (2) |
|---|---|---|---|---|---|
| Eastern Sierra-Mother Lode Region of California nonmetropolitan area | 160 | 2.57 | 4.67 | $ 19.00 | $ 39,520 |
| Southwest Minnesota nonmetropolitan area | 270 | 2.27 | 4.11 | $ 14.83 | $ 30,840 |
| Central Indiana nonmetropolitan area | 340 | 2.19 | 3.97 | $ 12.25 | $ 25,490 |
| Connecticut nonmetropolitan area | 70 | 2.17 | 3.94 | $ 16.72 | $ 34,770 |
| Southeast Oklahoma nonmetropolitan area | 360 | 2.07 | 3.76 | $ 13.70 | $ 28,500 |
Top paying nonmetropolitan areas for Library Assistants, Clerical:
| Nonmetropolitan area | Employment (1) | Employment per thousand jobs | Location quotient (9) | Hourly mean wage | Annual mean wage (2) |
|---|---|---|---|---|---|
| Eastern Washington nonmetropolitan area | 130 | 1.23 | 2.24 | $ 20.91 | $ 43,500 |
| Alaska nonmetropolitan area | 110 | 1.04 | 1.89 | $ 20.53 | $ 42,700 |
| Western Washington nonmetropolitan area | 220 | 1.74 | 3.16 | $ 20.35 | $ 42,320 |
| North Coast Region of California nonmetropolitan area | 210 | 2.02 | 3.67 | $ 19.79 | $ 41,150 |
| North Valley-Northern Mountains Region of California nonmetropolitan area | 130 | 1.28 | 2.33 | $ 19.59 | $ 40,740 |
These estimates are calculated with data collected from employers in all industry sectors, all metropolitan and nonmetropolitan areas, and all states and the District of Columbia. The top employment and wage figures are provided above. The complete list is available in the downloadable XLS files.
The percentile wage estimate is the value of a wage below which a certain percent of workers fall. The median wage is the 50th percentile wage estimate—50 percent of workers earn less than the median and 50 percent of workers earn more than the median. More about percentile wages.
(1) Estimates for detailed occupations do not sum to the totals because the totals include occupations not shown separately. Estimates do not include self-employed workers.
(2) Annual wages have been calculated by multiplying the hourly mean wage by a "year-round, full-time" hours figure of 2,080 hours; for those occupations where there is not an hourly wage published, the annual wage has been directly calculated from the reported survey data.
(3) The relative standard error (RSE) is a measure of the reliability of a survey statistic. The smaller the relative standard error, the more precise the estimate.
(7) The value is less than .005 percent of industry employment.
(8) Estimate not released.
(9) The location quotient is the ratio of the area concentration of occupational employment to the national average concentration. A location quotient greater than one indicates the occupation has a higher share of employment than average, and a location quotient less than one indicates the occupation is less prevalent in the area than average.
Other OEWS estimates and related information:
May 2023 National Occupational Employment and Wage Estimates
May 2023 State Occupational Employment and Wage Estimates
May 2023 Metropolitan and Nonmetropolitan Area Occupational Employment and Wage Estimates
May 2023 National Industry-Specific Occupational Employment and Wage Estimates
Last Modified Date: April 3, 2024