
An official website of the United States government
An official website of the United States government
The .gov means it's official.
Federal government websites often end in .gov or .mil. Before sharing sensitive information,
make sure you're on a federal government site.
The site is secure.
The
https:// ensures that you are connecting to the official website and that any
information you provide is encrypted and transmitted securely.
Assist patrons at hotel, apartment, or office building with personal services. May take messages; arrange or give advice on transportation, business services, or entertainment; or monitor guest requests for housekeeping and maintenance.
Employment estimate and mean wage estimates for Concierges:
| Employment (1) | Employment RSE (3) |
Mean hourly wage |
Mean annual wage (2) |
Wage RSE (3) |
|---|---|---|---|---|
| 41,020 | 6.8 % | $ 19.34 | $ 40,230 | 1.2 % |
Percentile wage estimates for Concierges:
| Percentile | 10% | 25% | 50% (Median) |
75% | 90% |
|---|---|---|---|---|---|
| Hourly Wage | $ 14.19 | $ 16.01 | $ 17.86 | $ 21.84 | $ 27.53 |
| Annual Wage (2) | $ 29,510 | $ 33,300 | $ 37,150 | $ 45,440 | $ 57,270 |
Industries with the highest published employment and wages for Concierges are provided. For a list of all industries with employment in Concierges, see the Create Customized Tables function.
Industries with the highest levels of employment in Concierges:
| Industry | Employment (1) | Percent of industry employment | Hourly mean wage | Annual mean wage (2) |
|---|---|---|---|---|
| Real Estate | 10,440 | 0.58 | $ 21.81 | $ 45,360 |
| Traveler Accommodation | 7,310 | 0.40 | $ 20.42 | $ 42,470 |
| Continuing Care Retirement Communities and Assisted Living Facilities for the Elderly | 6,460 | 0.70 | $ 16.68 | $ 34,700 |
| Other Personal Services | 4,070 | 1.01 | $ 18.07 | $ 37,590 |
| Nursing Care Facilities (Skilled Nursing Facilities) | 1,020 | 0.07 | $ 17.16 | $ 35,680 |
Industries with the highest concentration of employment in Concierges:
| Industry | Employment (1) | Percent of industry employment | Hourly mean wage | Annual mean wage (2) |
|---|---|---|---|---|
| Other Personal Services | 4,070 | 1.01 | $ 18.07 | $ 37,590 |
| Continuing Care Retirement Communities and Assisted Living Facilities for the Elderly | 6,460 | 0.70 | $ 16.68 | $ 34,700 |
| Real Estate | 10,440 | 0.58 | $ 21.81 | $ 45,360 |
| Facilities Support Services | 760 | 0.40 | $ 18.82 | $ 39,140 |
| Traveler Accommodation | 7,310 | 0.40 | $ 20.42 | $ 42,470 |
Top paying industries for Concierges:
| Industry | Employment (1) | Percent of industry employment | Hourly mean wage | Annual mean wage (2) |
|---|---|---|---|---|
| Civic and Social Organizations | 50 | 0.01 | $ 28.86 | $ 60,030 |
| Credit Intermediation and Related Activities (5221 and 5223 only) | (8) | (8) | $ 24.19 | $ 50,310 |
| Deep Sea, Coastal, and Great Lakes Water Transportation | 80 | 0.19 | $ 23.73 | $ 49,360 |
| Scheduled Air Transportation | 170 | 0.04 | $ 23.61 | $ 49,110 |
| Services to Buildings and Dwellings | 100 | (7) | $ 23.35 | $ 48,570 |
States and areas with the highest published employment, location quotients, and wages for Concierges are provided. For a list of all areas with employment in Concierges, see the Create Customized Tables function.
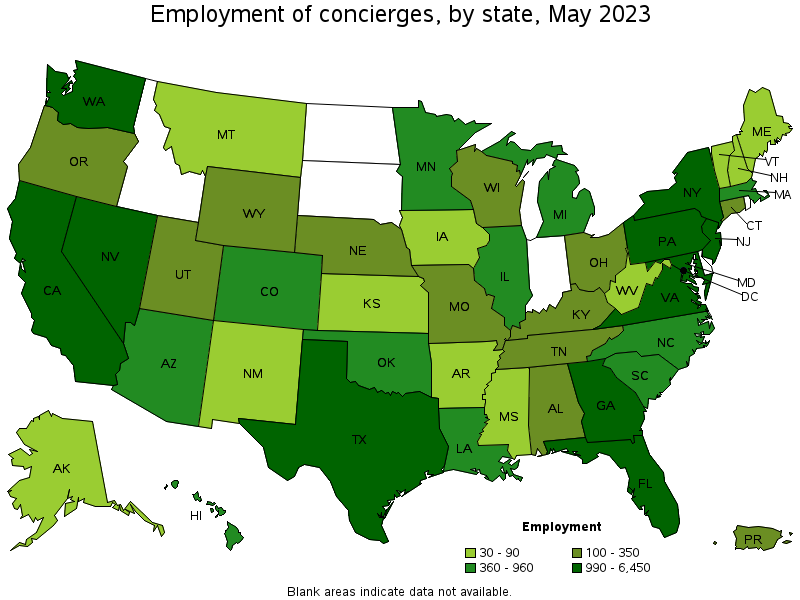
States with the highest employment level in Concierges:
| State | Employment (1) | Employment per thousand jobs | Location quotient (9) | Hourly mean wage | Annual mean wage (2) |
|---|---|---|---|---|---|
| New York | 6,450 | 0.69 | 2.54 | $ 24.38 | $ 50,700 |
| California | 4,300 | 0.24 | 0.89 | $ 20.68 | $ 43,010 |
| Florida | 3,600 | 0.38 | 1.39 | $ 18.03 | $ 37,510 |
| District of Columbia | 2,900 | 4.14 | 15.31 | $ 19.22 | $ 39,970 |
| Virginia | 2,710 | 0.68 | 2.52 | $ 16.91 | $ 35,170 |
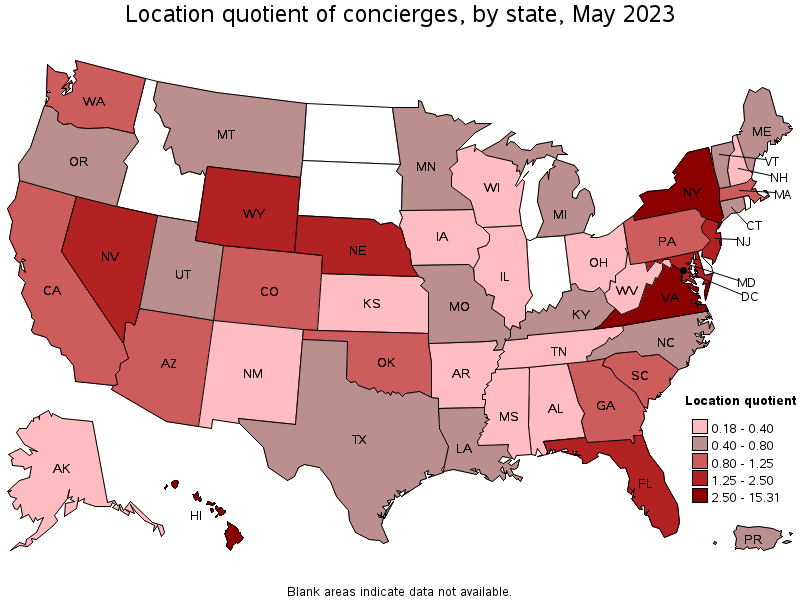
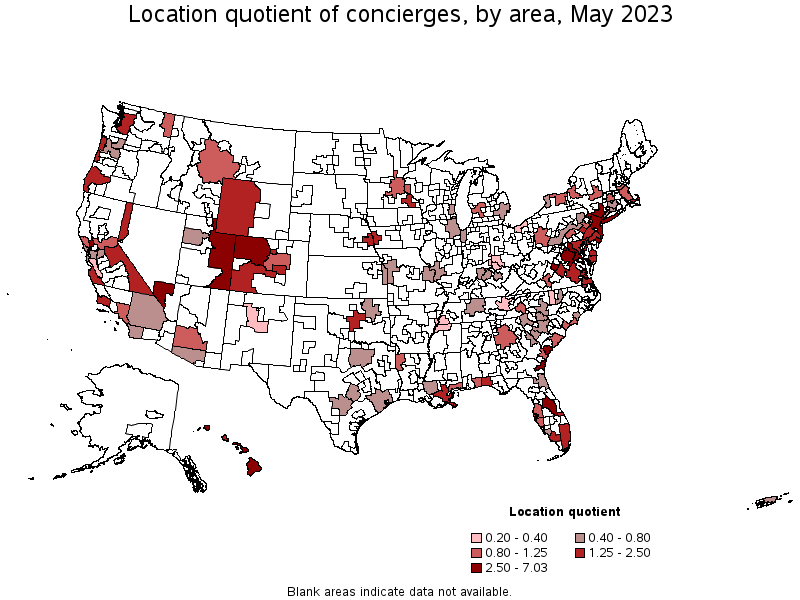
States with the highest concentration of jobs and location quotients in Concierges:
| State | Employment (1) | Employment per thousand jobs | Location quotient (9) | Hourly mean wage | Annual mean wage (2) |
|---|---|---|---|---|---|
| District of Columbia | 2,900 | 4.14 | 15.31 | $ 19.22 | $ 39,970 |
| Hawaii | 530 | 0.87 | 3.20 | $ 25.19 | $ 52,390 |
| New York | 6,450 | 0.69 | 2.54 | $ 24.38 | $ 50,700 |
| Virginia | 2,710 | 0.68 | 2.52 | $ 16.91 | $ 35,170 |
| Nevada | 990 | 0.67 | 2.47 | $ 19.28 | $ 40,090 |
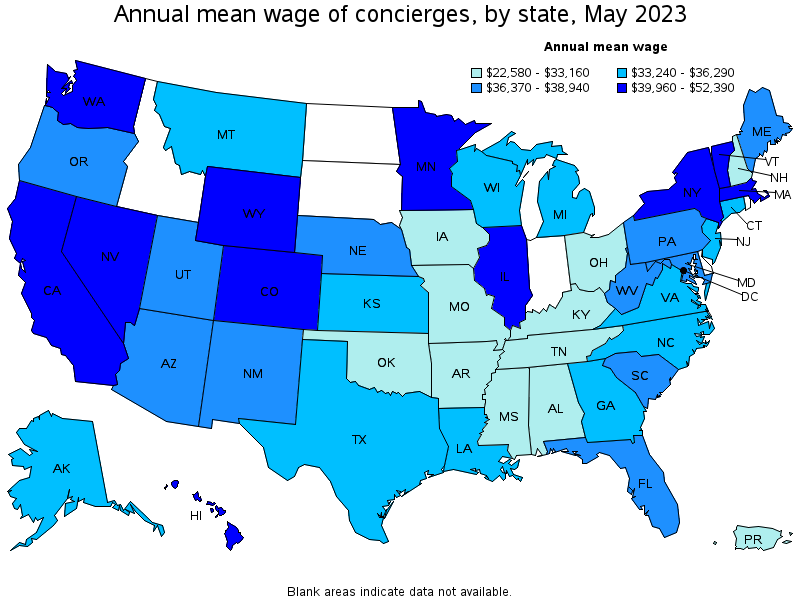
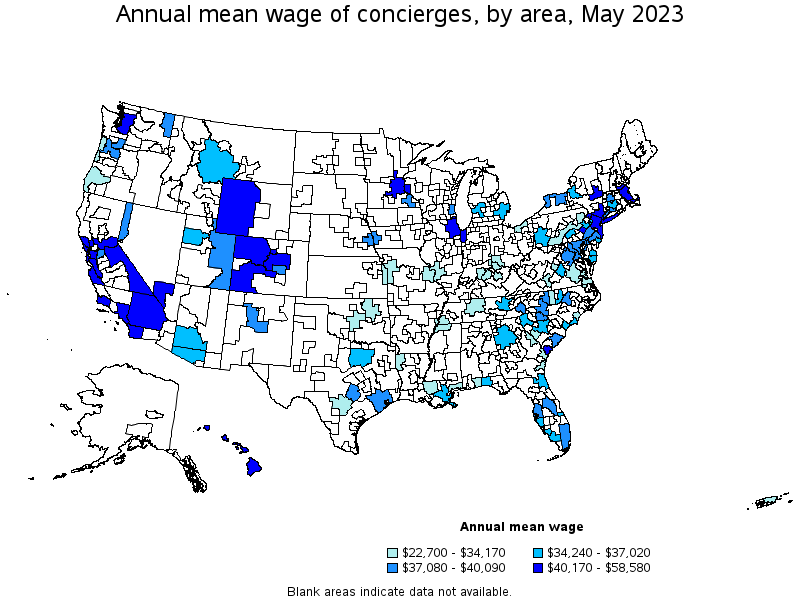
Top paying states for Concierges:
| State | Employment (1) | Employment per thousand jobs | Location quotient (9) | Hourly mean wage | Annual mean wage (2) |
|---|---|---|---|---|---|
| Hawaii | 530 | 0.87 | 3.20 | $ 25.19 | $ 52,390 |
| New York | 6,450 | 0.69 | 2.54 | $ 24.38 | $ 50,700 |
| Colorado | 900 | 0.32 | 1.18 | $ 21.47 | $ 44,660 |
| Vermont | 60 | 0.21 | 0.78 | $ 20.82 | $ 43,300 |
| California | 4,300 | 0.24 | 0.89 | $ 20.68 | $ 43,010 |
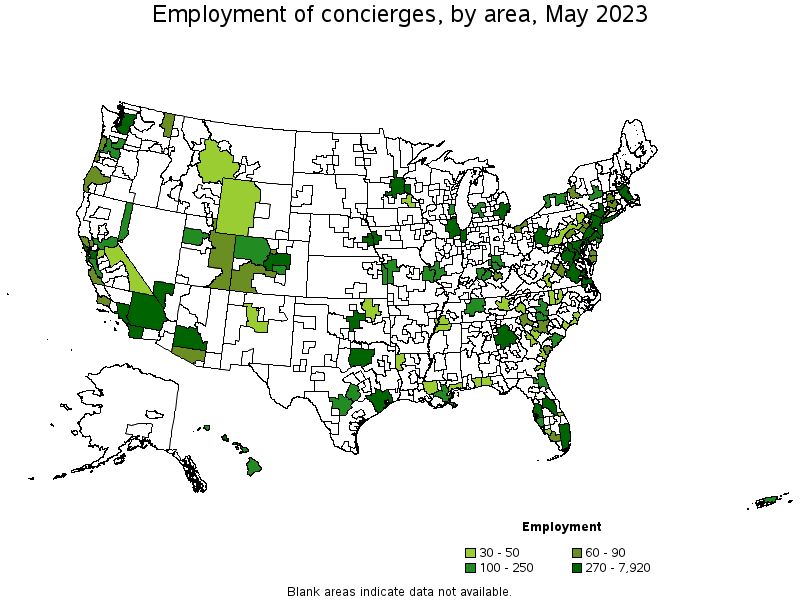
Metropolitan areas with the highest employment level in Concierges:
| Metropolitan area | Employment (1) | Employment per thousand jobs | Location quotient (9) | Hourly mean wage | Annual mean wage (2) |
|---|---|---|---|---|---|
| New York-Newark-Jersey City, NY-NJ-PA | 7,920 | 0.83 | 3.09 | $ 22.95 | $ 47,740 |
| Washington-Arlington-Alexandria, DC-VA-MD-WV | 4,750 | 1.54 | 5.69 | $ 18.90 | $ 39,300 |
| Los Angeles-Long Beach-Anaheim, CA | 2,080 | 0.34 | 1.24 | $ 20.34 | $ 42,320 |
| Philadelphia-Camden-Wilmington, PA-NJ-DE-MD | 1,230 | 0.43 | 1.61 | $ 18.25 | $ 37,950 |
| Miami-Fort Lauderdale-West Palm Beach, FL | 1,200 | 0.44 | 1.63 | $ 19.10 | $ 39,720 |
| Orlando-Kissimmee-Sanford, FL | 1,090 | 0.80 | 2.94 | $ 17.88 | $ 37,190 |
| Las Vegas-Henderson-Paradise, NV | 830 | 0.77 | 2.83 | $ 19.38 | $ 40,310 |
| Boston-Cambridge-Nashua, MA-NH | 820 | 0.30 | 1.09 | $ 20.72 | $ 43,100 |
| Atlanta-Sandy Springs-Roswell, GA | 810 | 0.29 | 1.06 | $ 16.78 | $ 34,890 |
| Seattle-Tacoma-Bellevue, WA | 740 | 0.36 | 1.32 | $ 21.03 | $ 43,740 |
Metropolitan areas with the highest concentration of jobs and location quotients in Concierges:
| Metropolitan area | Employment (1) | Employment per thousand jobs | Location quotient (9) | Hourly mean wage | Annual mean wage (2) |
|---|---|---|---|---|---|
| Kahului-Wailuku-Lahaina, HI | 140 | 1.90 | 7.03 | $ 28.17 | $ 58,580 |
| Washington-Arlington-Alexandria, DC-VA-MD-WV | 4,750 | 1.54 | 5.69 | $ 18.90 | $ 39,300 |
| Staunton-Waynesboro, VA | 60 | 1.23 | 4.57 | $ 15.89 | $ 33,040 |
| Brunswick, GA | 40 | 0.92 | 3.40 | $ 16.04 | $ 33,370 |
| Atlantic City-Hammonton, NJ | 110 | 0.85 | 3.14 | $ 16.62 | $ 34,560 |
| New York-Newark-Jersey City, NY-NJ-PA | 7,920 | 0.83 | 3.09 | $ 22.95 | $ 47,740 |
| Orlando-Kissimmee-Sanford, FL | 1,090 | 0.80 | 2.94 | $ 17.88 | $ 37,190 |
| Hilton Head Island-Bluffton-Beaufort, SC | 60 | 0.77 | 2.87 | $ 19.31 | $ 40,170 |
| Las Vegas-Henderson-Paradise, NV | 830 | 0.77 | 2.83 | $ 19.38 | $ 40,310 |
| Napa, CA | 60 | 0.74 | 2.75 | $ 23.05 | $ 47,940 |
Top paying metropolitan areas for Concierges:
| Metropolitan area | Employment (1) | Employment per thousand jobs | Location quotient (9) | Hourly mean wage | Annual mean wage (2) |
|---|---|---|---|---|---|
| Kahului-Wailuku-Lahaina, HI | 140 | 1.90 | 7.03 | $ 28.17 | $ 58,580 |
| San Francisco-Oakland-Hayward, CA | 470 | 0.19 | 0.72 | $ 23.87 | $ 49,650 |
| San Jose-Sunnyvale-Santa Clara, CA | 120 | 0.11 | 0.39 | $ 23.47 | $ 48,830 |
| Urban Honolulu, HI | 280 | 0.64 | 2.36 | $ 23.36 | $ 48,590 |
| Napa, CA | 60 | 0.74 | 2.75 | $ 23.05 | $ 47,940 |
| New York-Newark-Jersey City, NY-NJ-PA | 7,920 | 0.83 | 3.09 | $ 22.95 | $ 47,740 |
| Denver-Aurora-Lakewood, CO | 380 | 0.24 | 0.89 | $ 22.47 | $ 46,730 |
| Salinas, CA | 70 | 0.39 | 1.45 | $ 22.02 | $ 45,790 |
| Chicago-Naperville-Elgin, IL-IN-WI | 500 | 0.11 | 0.41 | $ 21.15 | $ 43,990 |
| Seattle-Tacoma-Bellevue, WA | 740 | 0.36 | 1.32 | $ 21.03 | $ 43,740 |
Nonmetropolitan areas with the highest employment in Concierges:
| Nonmetropolitan area | Employment (1) | Employment per thousand jobs | Location quotient (9) | Hourly mean wage | Annual mean wage (2) |
|---|---|---|---|---|---|
| Northwest Colorado nonmetropolitan area | 180 | 1.42 | 5.25 | $ 23.07 | $ 47,980 |
| Hawaii / Kauai nonmetropolitan area | 110 | 1.09 | 4.02 | $ 25.93 | $ 53,940 |
| Eastern Utah nonmetropolitan area | 80 | 0.94 | 3.49 | $ 19.02 | $ 39,560 |
| Southwest Colorado nonmetropolitan area | 60 | 0.58 | 2.14 | $ 22.10 | $ 45,960 |
| Coast Oregon nonmetropolitan area | 60 | 0.50 | 1.87 | $ 16.43 | $ 34,170 |
Nonmetropolitan areas with the highest concentration of jobs and location quotients in Concierges:
| Nonmetropolitan area | Employment (1) | Employment per thousand jobs | Location quotient (9) | Hourly mean wage | Annual mean wage (2) |
|---|---|---|---|---|---|
| Northwest Colorado nonmetropolitan area | 180 | 1.42 | 5.25 | $ 23.07 | $ 47,980 |
| Hawaii / Kauai nonmetropolitan area | 110 | 1.09 | 4.02 | $ 25.93 | $ 53,940 |
| Eastern Utah nonmetropolitan area | 80 | 0.94 | 3.49 | $ 19.02 | $ 39,560 |
| Southwest Colorado nonmetropolitan area | 60 | 0.58 | 2.14 | $ 22.10 | $ 45,960 |
| Western Wyoming nonmetropolitan area | 50 | 0.53 | 1.96 | $ 21.89 | $ 45,530 |
Top paying nonmetropolitan areas for Concierges:
| Nonmetropolitan area | Employment (1) | Employment per thousand jobs | Location quotient (9) | Hourly mean wage | Annual mean wage (2) |
|---|---|---|---|---|---|
| Hawaii / Kauai nonmetropolitan area | 110 | 1.09 | 4.02 | $ 25.93 | $ 53,940 |
| Northwest Colorado nonmetropolitan area | 180 | 1.42 | 5.25 | $ 23.07 | $ 47,980 |
| Southwest Colorado nonmetropolitan area | 60 | 0.58 | 2.14 | $ 22.10 | $ 45,960 |
| Western Wyoming nonmetropolitan area | 50 | 0.53 | 1.96 | $ 21.89 | $ 45,530 |
| Eastern Sierra-Mother Lode Region of California nonmetropolitan area | 30 | 0.51 | 1.87 | $ 20.08 | $ 41,760 |
These estimates are calculated with data collected from employers in all industry sectors, all metropolitan and nonmetropolitan areas, and all states and the District of Columbia. The top employment and wage figures are provided above. The complete list is available in the downloadable XLS files.
The percentile wage estimate is the value of a wage below which a certain percent of workers fall. The median wage is the 50th percentile wage estimate—50 percent of workers earn less than the median and 50 percent of workers earn more than the median. More about percentile wages.
(1) Estimates for detailed occupations do not sum to the totals because the totals include occupations not shown separately. Estimates do not include self-employed workers.
(2) Annual wages have been calculated by multiplying the hourly mean wage by a "year-round, full-time" hours figure of 2,080 hours; for those occupations where there is not an hourly wage published, the annual wage has been directly calculated from the reported survey data.
(3) The relative standard error (RSE) is a measure of the reliability of a survey statistic. The smaller the relative standard error, the more precise the estimate.
(7) The value is less than .005 percent of industry employment.
(8) Estimate not released.
(9) The location quotient is the ratio of the area concentration of occupational employment to the national average concentration. A location quotient greater than one indicates the occupation has a higher share of employment than average, and a location quotient less than one indicates the occupation is less prevalent in the area than average.
Other OEWS estimates and related information:
May 2023 National Occupational Employment and Wage Estimates
May 2023 State Occupational Employment and Wage Estimates
May 2023 Metropolitan and Nonmetropolitan Area Occupational Employment and Wage Estimates
May 2023 National Industry-Specific Occupational Employment and Wage Estimates
Last Modified Date: April 3, 2024