
An official website of the United States government
An official website of the United States government
The .gov means it's official.
Federal government websites often end in .gov or .mil. Before sharing sensitive information,
make sure you're on a federal government site.
The site is secure.
The
https:// ensures that you are connecting to the official website and that any
information you provide is encrypted and transmitted securely.
Diagnose and provide nonsurgical treatment for a wide range of diseases and injuries of internal organ systems. Provide care mainly for adults and adolescents, and are based primarily in an outpatient care setting. Excludes �Family Medicine Physicians� (29-1215) and �Pediatricians, General� (29-1221).
Employment estimate and mean wage estimates for General Internal Medicine Physicians:
| Employment (1) | Employment RSE (3) |
Mean hourly wage |
Mean annual wage (2) |
Wage RSE (3) |
|---|---|---|---|---|
| 67,210 | 3.5 % | $ 118.01 | $ 245,450 | 3.6 % |
Percentile wage estimates for General Internal Medicine Physicians:
| Percentile | 10% | 25% | 50% (Median) |
75% | 90% |
|---|---|---|---|---|---|
| Hourly Wage | $ 33.71 | $ 52.10 | $ 107.36 | (5) | (5) |
| Annual Wage (2) | $ 70,120 | $ 108,380 | $ 223,310 | (5) | (5) |
Industries with the highest published employment and wages for General Internal Medicine Physicians are provided. For a list of all industries with employment in General Internal Medicine Physicians, see the Create Customized Tables function.
Industries with the highest levels of employment in General Internal Medicine Physicians:
| Industry | Employment (1) | Percent of industry employment | Hourly mean wage | Annual mean wage (2) |
|---|---|---|---|---|
| Offices of Physicians | 34,610 | 1.22 | $ 131.04 | $ 272,550 |
| General Medical and Surgical Hospitals | 19,830 | 0.35 | $ 95.18 | $ 197,970 |
| Outpatient Care Centers | 3,220 | 0.30 | $ 124.08 | $ 258,090 |
| Specialty (except Psychiatric and Substance Abuse) Hospitals | 820 | 0.29 | $ 129.64 | $ 269,660 |
| Management of Companies and Enterprises | 430 | 0.02 | (8) | (8) |
Industries with the highest concentration of employment in General Internal Medicine Physicians:
| Industry | Employment (1) | Percent of industry employment | Hourly mean wage | Annual mean wage (2) |
|---|---|---|---|---|
| Offices of Physicians | 34,610 | 1.22 | $ 131.04 | $ 272,550 |
| General Medical and Surgical Hospitals | 19,830 | 0.35 | $ 95.18 | $ 197,970 |
| Outpatient Care Centers | 3,220 | 0.30 | $ 124.08 | $ 258,090 |
| Specialty (except Psychiatric and Substance Abuse) Hospitals | 820 | 0.29 | $ 129.64 | $ 269,660 |
| Psychiatric and Substance Abuse Hospitals | 100 | 0.04 | (8) | (8) |
Top paying industries for General Internal Medicine Physicians:
| Industry | Employment (1) | Percent of industry employment | Hourly mean wage | Annual mean wage (2) |
|---|---|---|---|---|
| Medical and Diagnostic Laboratories | 80 | 0.02 | $ 191.21 | $ 397,710 |
| Scientific Research and Development Services | (8) | (8) | $ 138.54 | $ 288,170 |
| Local Government, excluding Schools and Hospitals (OEWS Designation) | 390 | 0.01 | $ 135.15 | $ 281,110 |
| Offices of Physicians | 34,610 | 1.22 | $ 131.04 | $ 272,550 |
| Specialty (except Psychiatric and Substance Abuse) Hospitals | 820 | 0.29 | $ 129.64 | $ 269,660 |
States and areas with the highest published employment, location quotients, and wages for General Internal Medicine Physicians are provided. For a list of all areas with employment in General Internal Medicine Physicians, see the Create Customized Tables function.
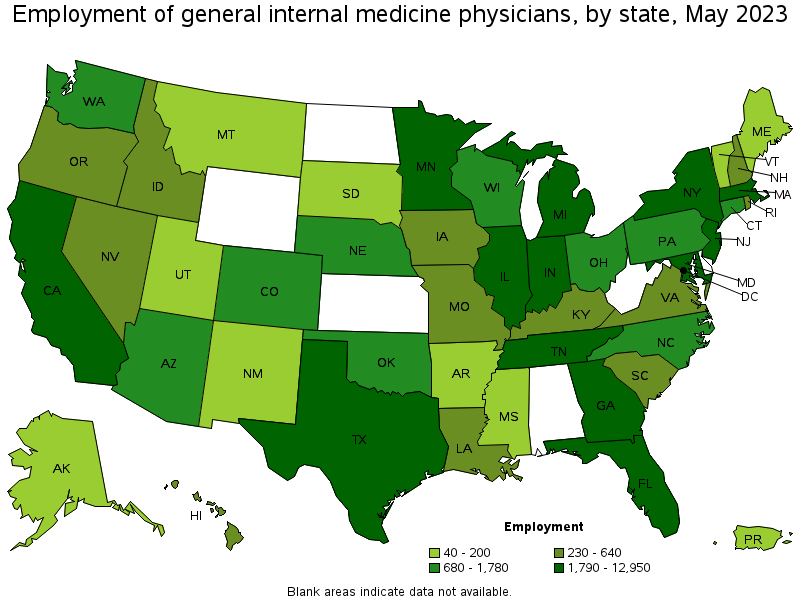
States with the highest employment level in General Internal Medicine Physicians:
| State | Employment (1) | Employment per thousand jobs | Location quotient (9) | Hourly mean wage | Annual mean wage (2) |
|---|---|---|---|---|---|
| New York | 12,950 | 1.38 | 3.11 | $ 96.31 | $ 200,320 |
| California | 5,940 | 0.33 | 0.75 | $ 132.26 | $ 275,110 |
| Georgia | 5,130 | 1.08 | 2.44 | $ 162.31 | $ 337,610 |
| Maryland | 3,180 | 1.19 | 2.69 | $ 121.31 | $ 252,330 |
| Florida | 3,010 | 0.31 | 0.71 | $ 112.03 | $ 233,010 |
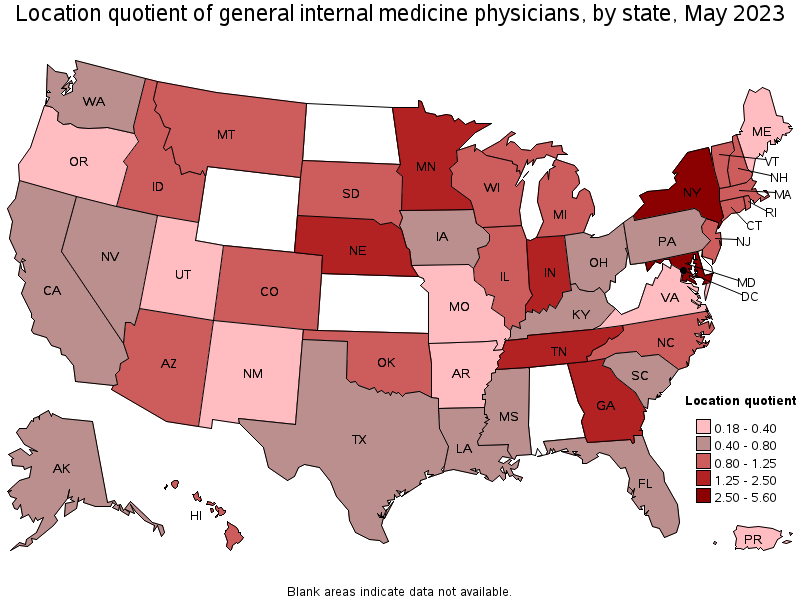
States with the highest concentration of jobs and location quotients in General Internal Medicine Physicians:
| State | Employment (1) | Employment per thousand jobs | Location quotient (9) | Hourly mean wage | Annual mean wage (2) |
|---|---|---|---|---|---|
| District of Columbia | 1,740 | 2.48 | 5.60 | (8) | (8) |
| New York | 12,950 | 1.38 | 3.11 | $ 96.31 | $ 200,320 |
| Maryland | 3,180 | 1.19 | 2.69 | $ 121.31 | $ 252,330 |
| Georgia | 5,130 | 1.08 | 2.44 | $ 162.31 | $ 337,610 |
| Tennessee | 2,600 | 0.81 | 1.82 | $ 74.56 | $ 155,070 |
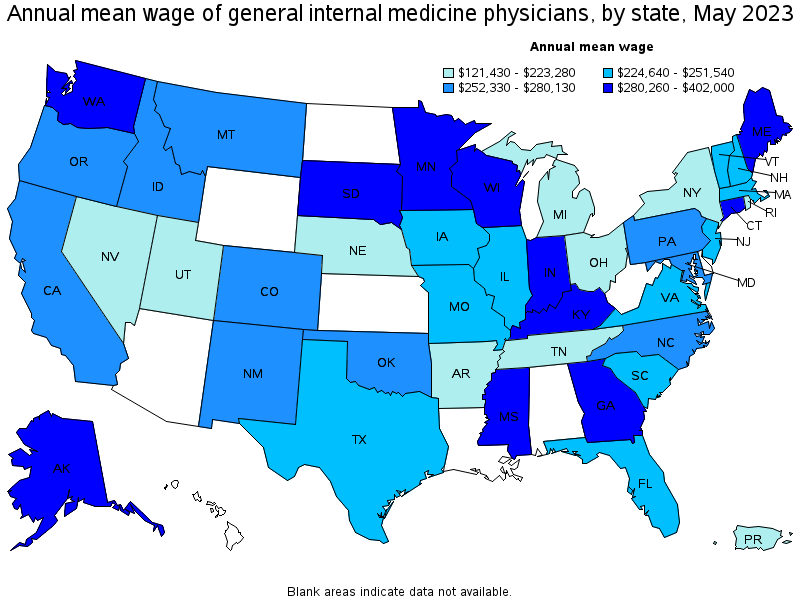
Top paying states for General Internal Medicine Physicians:
| State | Employment (1) | Employment per thousand jobs | Location quotient (9) | Hourly mean wage | Annual mean wage (2) |
|---|---|---|---|---|---|
| Hawaii | 280 | 0.46 | 1.03 | (5) | (5) |
| Alaska | 80 | 0.25 | 0.57 | $ 193.27 | $ 402,000 |
| Georgia | 5,130 | 1.08 | 2.44 | $ 162.31 | $ 337,610 |
| Mississippi | 200 | 0.18 | 0.40 | $ 156.30 | $ 325,090 |
| South Dakota | 160 | 0.37 | 0.84 | $ 152.25 | $ 316,690 |
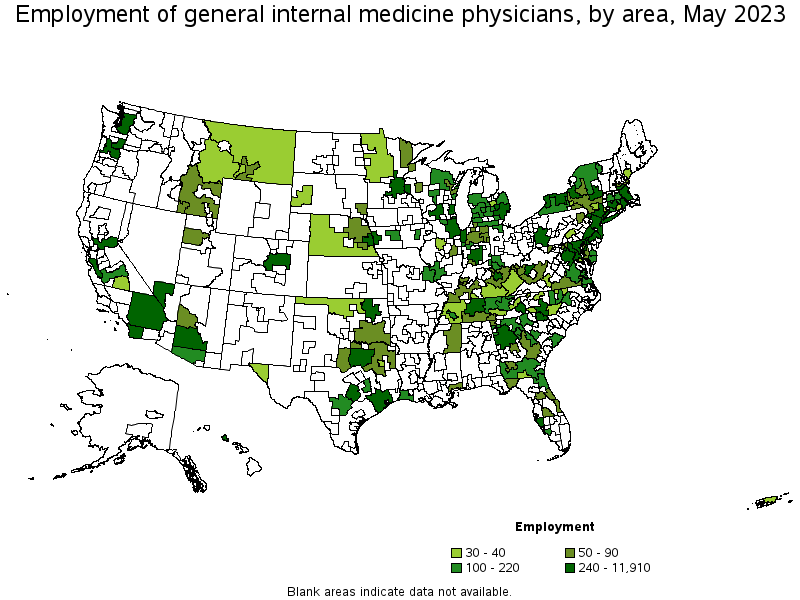
Metropolitan areas with the highest employment level in General Internal Medicine Physicians:
| Metropolitan area | Employment (1) | Employment per thousand jobs | Location quotient (9) | Hourly mean wage | Annual mean wage (2) |
|---|---|---|---|---|---|
| New York-Newark-Jersey City, NY-NJ-PA | 11,910 | 1.25 | 2.83 | $ 93.34 | $ 194,160 |
| Atlanta-Sandy Springs-Roswell, GA | 3,940 | 1.40 | 3.16 | $ 177.50 | $ 369,200 |
| Washington-Arlington-Alexandria, DC-VA-MD-WV | 3,040 | 0.98 | 2.22 | $ 101.43 | $ 210,980 |
| Chicago-Naperville-Elgin, IL-IN-WI | 1,750 | 0.39 | 0.88 | $ 99.52 | $ 206,990 |
| San Diego-Carlsbad, CA | 1,660 | 1.09 | 2.47 | $ 108.52 | $ 225,720 |
| Baltimore-Columbia-Towson, MD | 1,600 | 1.23 | 2.78 | $ 121.69 | $ 253,110 |
| Boston-Cambridge-Nashua, MA-NH | 1,420 | 0.52 | 1.16 | $ 106.59 | $ 221,700 |
| Indianapolis-Carmel-Anderson, IN | 1,210 | 1.12 | 2.52 | $ 133.32 | $ 277,310 |
| Phoenix-Mesa-Scottsdale, AZ | 1,160 | 0.51 | 1.14 | (8) | (8) |
| Houston-The Woodlands-Sugar Land, TX | 970 | 0.30 | 0.69 | $ 99.51 | $ 206,970 |
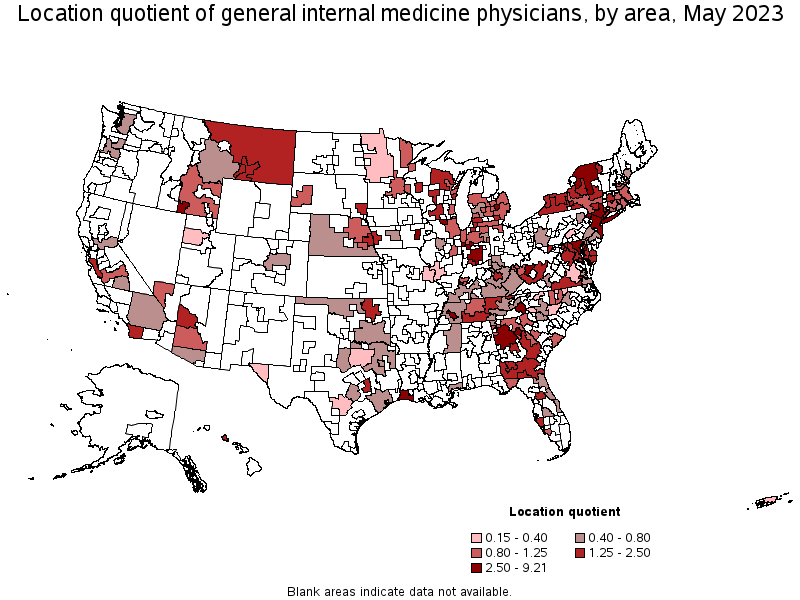
Metropolitan areas with the highest concentration of jobs and location quotients in General Internal Medicine Physicians:
| Metropolitan area | Employment (1) | Employment per thousand jobs | Location quotient (9) | Hourly mean wage | Annual mean wage (2) |
|---|---|---|---|---|---|
| Charleston, WV | 420 | 4.08 | 9.21 | $ 110.84 | $ 230,550 |
| Athens-Clarke County, GA | 220 | 2.45 | 5.55 | $ 57.42 | $ 119,430 |
| Lafayette-West Lafayette, IN | 220 | 2.23 | 5.03 | $ 160.78 | $ 334,420 |
| Flint, MI | 280 | 2.14 | 4.83 | $ 108.22 | $ 225,090 |
| Jackson, TN | 110 | 1.57 | 3.55 | $ 109.03 | $ 226,780 |
| Twin Falls, ID | 70 | 1.42 | 3.21 | $ 140.20 | $ 291,620 |
| Lake Charles, LA | 130 | 1.41 | 3.18 | (5) | (5) |
| Atlanta-Sandy Springs-Roswell, GA | 3,940 | 1.40 | 3.16 | $ 177.50 | $ 369,200 |
| Rockford, IL | 190 | 1.36 | 3.08 | $ 170.71 | $ 355,080 |
| Asheville, NC | 260 | 1.27 | 2.87 | $ 130.53 | $ 271,510 |
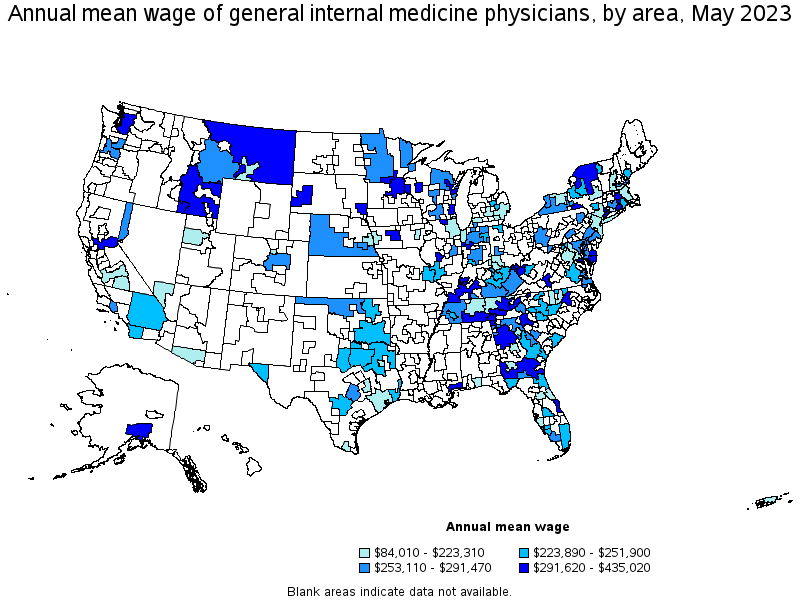
Top paying metropolitan areas for General Internal Medicine Physicians:
| Metropolitan area | Employment (1) | Employment per thousand jobs | Location quotient (9) | Hourly mean wage | Annual mean wage (2) |
|---|---|---|---|---|---|
| Lake Charles, LA | 130 | 1.41 | 3.18 | (5) | (5) |
| Urban Honolulu, HI | 240 | 0.56 | 1.26 | (5) | (5) |
| Springfield, MA-CT | 220 | 0.67 | 1.52 | (5) | (5) |
| Anchorage, AK | (8) | (8) | (8) | $ 209.14 | $ 435,020 |
| Knoxville, TN | 100 | 0.24 | 0.55 | $ 186.01 | $ 386,900 |
| Eau Claire, WI | 60 | 0.74 | 1.67 | $ 181.31 | $ 377,120 |
| Atlanta-Sandy Springs-Roswell, GA | 3,940 | 1.40 | 3.16 | $ 177.50 | $ 369,200 |
| Roanoke, VA | 40 | 0.26 | 0.60 | $ 175.86 | $ 365,790 |
| St. Cloud, MN | (8) | (8) | (8) | $ 172.77 | $ 359,360 |
| Rockford, IL | 190 | 1.36 | 3.08 | $ 170.71 | $ 355,080 |
Nonmetropolitan areas with the highest employment in General Internal Medicine Physicians:
| Nonmetropolitan area | Employment (1) | Employment per thousand jobs | Location quotient (9) | Hourly mean wage | Annual mean wage (2) |
|---|---|---|---|---|---|
| Capital/Northern New York nonmetropolitan area | 190 | 1.34 | 3.02 | $ 164.47 | $ 342,100 |
| South Georgia nonmetropolitan area | 140 | 0.73 | 1.65 | $ 157.47 | $ 327,540 |
| Northeastern Wisconsin nonmetropolitan area | 140 | 0.70 | 1.59 | $ 135.94 | $ 282,750 |
| Southwest New York nonmetropolitan area | 120 | 0.68 | 1.54 | $ 129.67 | $ 269,720 |
| North Georgia nonmetropolitan area | 100 | 0.52 | 1.18 | $ 128.48 | $ 267,230 |
Nonmetropolitan areas with the highest concentration of jobs and location quotients in General Internal Medicine Physicians:
| Nonmetropolitan area | Employment (1) | Employment per thousand jobs | Location quotient (9) | Hourly mean wage | Annual mean wage (2) |
|---|---|---|---|---|---|
| Capital/Northern New York nonmetropolitan area | 190 | 1.34 | 3.02 | $ 164.47 | $ 342,100 |
| Maryland nonmetropolitan area | 60 | 0.97 | 2.18 | $ 122.20 | $ 254,180 |
| North Central Tennessee nonmetropolitan area | 100 | 0.85 | 1.91 | $ 98.65 | $ 205,190 |
| Southern West Virginia nonmetropolitan area | 50 | 0.73 | 1.66 | (8) | (8) |
| South Georgia nonmetropolitan area | 140 | 0.73 | 1.65 | $ 157.47 | $ 327,540 |
Top paying nonmetropolitan areas for General Internal Medicine Physicians:
| Nonmetropolitan area | Employment (1) | Employment per thousand jobs | Location quotient (9) | Hourly mean wage | Annual mean wage (2) |
|---|---|---|---|---|---|
| Northeast Nebraska nonmetropolitan area | 50 | 0.55 | 1.23 | (5) | (5) |
| East-Central Montana nonmetropolitan area | 40 | 0.60 | 1.37 | $ 186.43 | $ 387,780 |
| Southeast-Central Idaho nonmetropolitan area | 50 | 0.49 | 1.12 | $ 181.46 | $ 377,430 |
| Capital/Northern New York nonmetropolitan area | 190 | 1.34 | 3.02 | $ 164.47 | $ 342,100 |
| East Tennessee nonmetropolitan area | 40 | 0.27 | 0.62 | $ 158.00 | $ 328,630 |
These estimates are calculated with data collected from employers in all industry sectors, all metropolitan and nonmetropolitan areas, and all states and the District of Columbia. The top employment and wage figures are provided above. The complete list is available in the downloadable XLS files.
The percentile wage estimate is the value of a wage below which a certain percent of workers fall. The median wage is the 50th percentile wage estimate—50 percent of workers earn less than the median and 50 percent of workers earn more than the median. More about percentile wages.
(1) Estimates for detailed occupations do not sum to the totals because the totals include occupations not shown separately. Estimates do not include self-employed workers.
(2) Annual wages have been calculated by multiplying the hourly mean wage by a "year-round, full-time" hours figure of 2,080 hours; for those occupations where there is not an hourly wage published, the annual wage has been directly calculated from the reported survey data.
(3) The relative standard error (RSE) is a measure of the reliability of a survey statistic. The smaller the relative standard error, the more precise the estimate.
(5) This wage is equal to or greater than $115.00 per hour or $239,200 per year.
(8) Estimate not released.
(9) The location quotient is the ratio of the area concentration of occupational employment to the national average concentration. A location quotient greater than one indicates the occupation has a higher share of employment than average, and a location quotient less than one indicates the occupation is less prevalent in the area than average.
Other OEWS estimates and related information:
May 2023 National Occupational Employment and Wage Estimates
May 2023 State Occupational Employment and Wage Estimates
May 2023 Metropolitan and Nonmetropolitan Area Occupational Employment and Wage Estimates
May 2023 National Industry-Specific Occupational Employment and Wage Estimates
Last Modified Date: April 3, 2024