
An official website of the United States government
An official website of the United States government
The .gov means it's official.
Federal government websites often end in .gov or .mil. Before sharing sensitive information,
make sure you're on a federal government site.
The site is secure.
The
https:// ensures that you are connecting to the official website and that any
information you provide is encrypted and transmitted securely.
Plan, direct, or coordinate compensation and benefits activities of an organization. Job analysis and position description managers are included in �Human Resources Managers� (11-3121).
Employment estimate and mean wage estimates for Compensation and Benefits Managers:
| Employment (1) | Employment RSE (3) |
Mean hourly wage |
Mean annual wage (2) |
Wage RSE (3) |
|---|---|---|---|---|
| 18,690 | 2.6 % | $ 72.57 | $ 150,940 | 1.2 % |
Percentile wage estimates for Compensation and Benefits Managers:
| Percentile | 10% | 25% | 50% (Median) |
75% | 90% |
|---|---|---|---|---|---|
| Hourly Wage | $ 36.81 | $ 49.30 | $ 65.57 | $ 87.03 | $ 110.56 |
| Annual Wage (2) | $ 76,550 | $ 102,540 | $ 136,380 | $ 181,030 | $ 229,970 |
Industries with the highest published employment and wages for Compensation and Benefits Managers are provided. For a list of all industries with employment in Compensation and Benefits Managers, see the Create Customized Tables function.
Industries with the highest levels of employment in Compensation and Benefits Managers:
| Industry | Employment (1) | Percent of industry employment | Hourly mean wage | Annual mean wage (2) |
|---|---|---|---|---|
| Management of Companies and Enterprises | 4,650 | 0.17 | $ 77.52 | $ 161,230 |
| Agencies, Brokerages, and Other Insurance Related Activities | 1,130 | 0.09 | $ 75.87 | $ 157,800 |
| Insurance Carriers | 720 | 0.06 | $ 72.95 | $ 151,740 |
| Management, Scientific, and Technical Consulting Services | 710 | 0.04 | $ 93.58 | $ 194,640 |
| Employment Services | 680 | 0.02 | $ 56.14 | $ 116,770 |
Industries with the highest concentration of employment in Compensation and Benefits Managers:
| Industry | Employment (1) | Percent of industry employment | Hourly mean wage | Annual mean wage (2) |
|---|---|---|---|---|
| Insurance and Employee Benefit Funds | 150 | 1.32 | $ 57.38 | $ 119,340 |
| Management of Companies and Enterprises | 4,650 | 0.17 | $ 77.52 | $ 161,230 |
| Agencies, Brokerages, and Other Insurance Related Activities | 1,130 | 0.09 | $ 75.87 | $ 157,800 |
| Insurance Carriers | 720 | 0.06 | $ 72.95 | $ 151,740 |
| Business, Professional, Labor, Political, and Similar Organizations | 280 | 0.06 | $ 68.28 | $ 142,020 |
Top paying industries for Compensation and Benefits Managers:
| Industry | Employment (1) | Percent of industry employment | Hourly mean wage | Annual mean wage (2) |
|---|---|---|---|---|
| Computer and Peripheral Equipment Manufacturing | 60 | 0.04 | $ 117.92 | $ 245,280 |
| Aerospace Product and Parts Manufacturing | 70 | 0.01 | $ 106.06 | $ 220,600 |
| Computing Infrastructure Providers, Data Processing, Web Hosting, and Related Services | 250 | 0.05 | $ 96.56 | $ 200,840 |
| Software Publishers | 240 | 0.04 | $ 95.08 | $ 197,770 |
| Securities, Commodity Contracts, and Other Financial Investments and Related Activities | 390 | 0.04 | $ 94.25 | $ 196,030 |
States and areas with the highest published employment, location quotients, and wages for Compensation and Benefits Managers are provided. For a list of all areas with employment in Compensation and Benefits Managers, see the Create Customized Tables function.
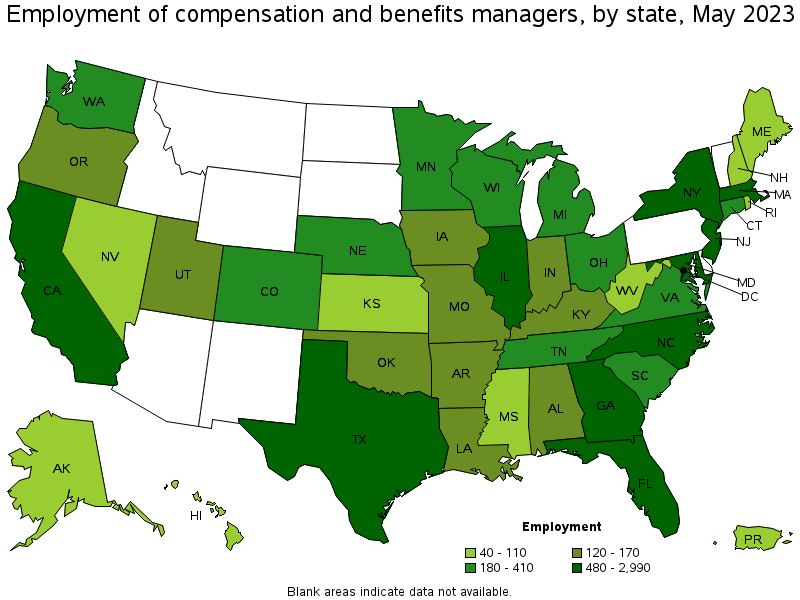
States with the highest employment level in Compensation and Benefits Managers:
| State | Employment (1) | Employment per thousand jobs | Location quotient (9) | Hourly mean wage | Annual mean wage (2) |
|---|---|---|---|---|---|
| California | 2,990 | 0.17 | 1.35 | $ 80.10 | $ 166,620 |
| New York | 1,880 | 0.20 | 1.63 | $ 96.79 | $ 201,320 |
| Texas | 1,730 | 0.13 | 1.04 | $ 63.54 | $ 132,170 |
| Florida | 1,060 | 0.11 | 0.90 | $ 63.09 | $ 131,240 |
| North Carolina | 780 | 0.16 | 1.33 | $ 67.93 | $ 141,300 |
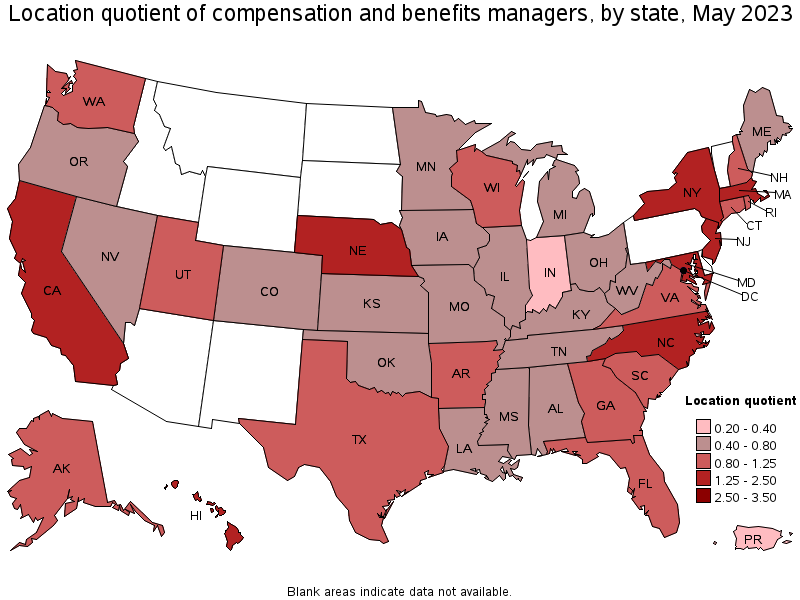
States with the highest concentration of jobs and location quotients in Compensation and Benefits Managers:
| State | Employment (1) | Employment per thousand jobs | Location quotient (9) | Hourly mean wage | Annual mean wage (2) |
|---|---|---|---|---|---|
| District of Columbia | 170 | 0.24 | 1.95 | $ 81.05 | $ 168,590 |
| New York | 1,880 | 0.20 | 1.63 | $ 96.79 | $ 201,320 |
| Massachusetts | 720 | 0.20 | 1.60 | $ 84.27 | $ 175,290 |
| Nebraska | 180 | 0.18 | 1.48 | $ 60.17 | $ 125,160 |
| Maryland | 480 | 0.18 | 1.47 | $ 68.88 | $ 143,260 |
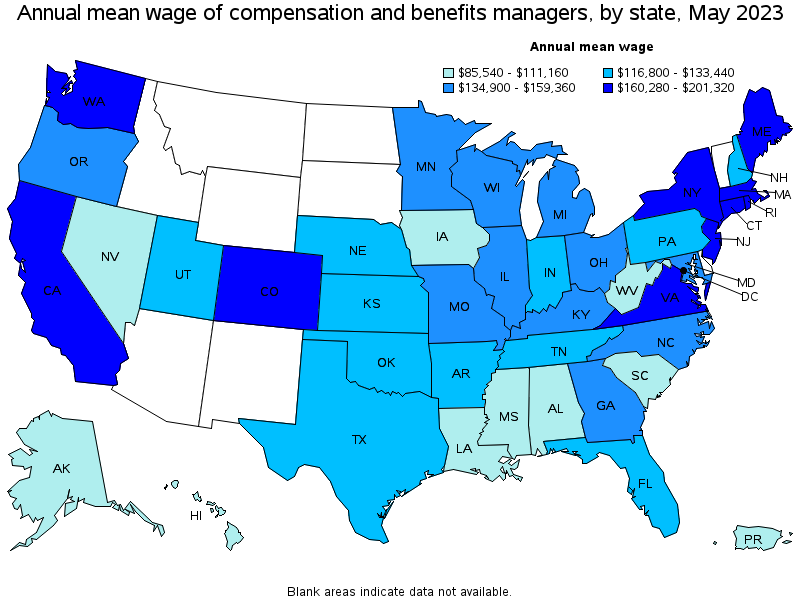
Top paying states for Compensation and Benefits Managers:
| State | Employment (1) | Employment per thousand jobs | Location quotient (9) | Hourly mean wage | Annual mean wage (2) |
|---|---|---|---|---|---|
| New York | 1,880 | 0.20 | 1.63 | $ 96.79 | $ 201,320 |
| New Jersey | 660 | 0.16 | 1.27 | $ 90.53 | $ 188,300 |
| Washington | 350 | 0.10 | 0.81 | $ 87.93 | $ 182,900 |
| Connecticut | 210 | 0.13 | 1.04 | $ 87.68 | $ 182,380 |
| Massachusetts | 720 | 0.20 | 1.60 | $ 84.27 | $ 175,290 |
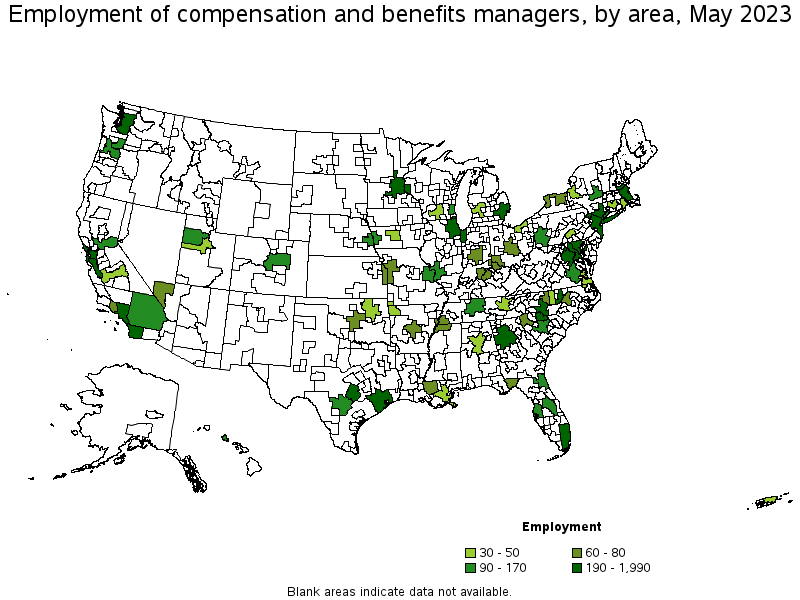
Metropolitan areas with the highest employment level in Compensation and Benefits Managers:
| Metropolitan area | Employment (1) | Employment per thousand jobs | Location quotient (9) | Hourly mean wage | Annual mean wage (2) |
|---|---|---|---|---|---|
| New York-Newark-Jersey City, NY-NJ-PA | 1,990 | 0.21 | 1.70 | $ 99.52 | $ 207,000 |
| Los Angeles-Long Beach-Anaheim, CA | 1,000 | 0.16 | 1.31 | $ 79.16 | $ 164,650 |
| Boston-Cambridge-Nashua, MA-NH | 640 | 0.23 | 1.90 | $ 85.95 | $ 178,780 |
| San Francisco-Oakland-Hayward, CA | 620 | 0.26 | 2.09 | $ 92.46 | $ 192,310 |
| Atlanta-Sandy Springs-Roswell, GA | 580 | 0.21 | 1.67 | $ 77.36 | $ 160,910 |
| Washington-Arlington-Alexandria, DC-VA-MD-WV | 560 | 0.18 | 1.47 | $ 79.10 | $ 164,520 |
| Chicago-Naperville-Elgin, IL-IN-WI | 450 | 0.10 | 0.82 | $ 66.11 | $ 137,510 |
| Houston-The Woodlands-Sugar Land, TX | 360 | 0.11 | 0.92 | $ 66.04 | $ 137,360 |
| Seattle-Tacoma-Bellevue, WA | 280 | 0.13 | 1.09 | $ 91.06 | $ 189,400 |
| Miami-Fort Lauderdale-West Palm Beach, FL | 270 | 0.10 | 0.82 | $ 61.91 | $ 128,760 |
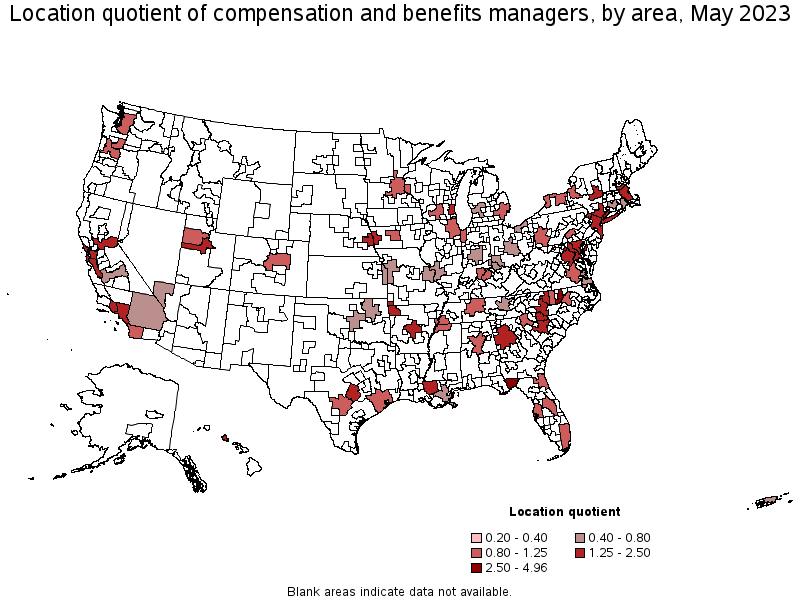
Metropolitan areas with the highest concentration of jobs and location quotients in Compensation and Benefits Managers:
| Metropolitan area | Employment (1) | Employment per thousand jobs | Location quotient (9) | Hourly mean wage | Annual mean wage (2) |
|---|---|---|---|---|---|
| Durham-Chapel Hill, NC | 210 | 0.61 | 4.96 | $ 49.73 | $ 103,440 |
| Tallahassee, FL | 60 | 0.31 | 2.52 | $ 41.87 | $ 87,100 |
| Columbia, SC | 120 | 0.30 | 2.45 | $ 37.31 | $ 77,600 |
| Bridgeport-Stamford-Norwalk, CT | 110 | 0.27 | 2.16 | $ 89.42 | $ 185,990 |
| San Francisco-Oakland-Hayward, CA | 620 | 0.26 | 2.09 | $ 92.46 | $ 192,310 |
| Omaha-Council Bluffs, NE-IA | 120 | 0.25 | 2.00 | $ 60.97 | $ 126,820 |
| San Jose-Sunnyvale-Santa Clara, CA | 270 | 0.23 | 1.91 | $ 100.69 | $ 209,440 |
| Boston-Cambridge-Nashua, MA-NH | 640 | 0.23 | 1.90 | $ 85.95 | $ 178,780 |
| Winston-Salem, NC | 60 | 0.23 | 1.85 | $ 59.42 | $ 123,590 |
| New York-Newark-Jersey City, NY-NJ-PA | 1,990 | 0.21 | 1.70 | $ 99.52 | $ 207,000 |
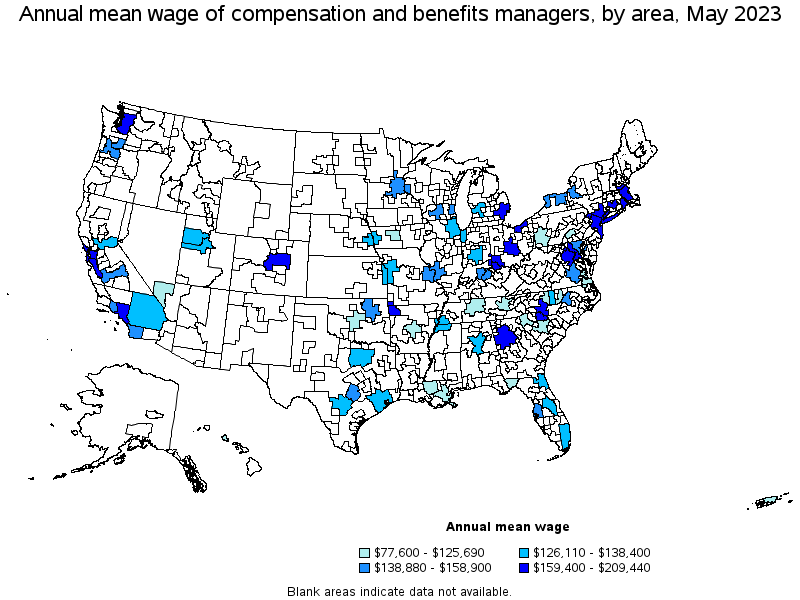
Top paying metropolitan areas for Compensation and Benefits Managers:
| Metropolitan area | Employment (1) | Employment per thousand jobs | Location quotient (9) | Hourly mean wage | Annual mean wage (2) |
|---|---|---|---|---|---|
| San Jose-Sunnyvale-Santa Clara, CA | 270 | 0.23 | 1.91 | $ 100.69 | $ 209,440 |
| New York-Newark-Jersey City, NY-NJ-PA | 1,990 | 0.21 | 1.70 | $ 99.52 | $ 207,000 |
| San Francisco-Oakland-Hayward, CA | 620 | 0.26 | 2.09 | $ 92.46 | $ 192,310 |
| Seattle-Tacoma-Bellevue, WA | 280 | 0.13 | 1.09 | $ 91.06 | $ 189,400 |
| Hartford-West Hartford-East Hartford, CT | 50 | 0.09 | 0.76 | $ 89.75 | $ 186,680 |
| Bridgeport-Stamford-Norwalk, CT | 110 | 0.27 | 2.16 | $ 89.42 | $ 185,990 |
| Boston-Cambridge-Nashua, MA-NH | 640 | 0.23 | 1.90 | $ 85.95 | $ 178,780 |
| Charlotte-Concord-Gastonia, NC-SC | 270 | 0.20 | 1.66 | $ 85.05 | $ 176,900 |
| Denver-Aurora-Lakewood, CO | 170 | 0.10 | 0.85 | $ 82.21 | $ 170,990 |
| Detroit-Warren-Dearborn, MI | 250 | 0.13 | 1.05 | $ 81.95 | $ 170,460 |
These estimates are calculated with data collected from employers in all industry sectors, all metropolitan and nonmetropolitan areas, and all states and the District of Columbia. The top employment and wage figures are provided above. The complete list is available in the downloadable XLS files.
The percentile wage estimate is the value of a wage below which a certain percent of workers fall. The median wage is the 50th percentile wage estimate—50 percent of workers earn less than the median and 50 percent of workers earn more than the median. More about percentile wages.
(1) Estimates for detailed occupations do not sum to the totals because the totals include occupations not shown separately. Estimates do not include self-employed workers.
(2) Annual wages have been calculated by multiplying the hourly mean wage by a "year-round, full-time" hours figure of 2,080 hours; for those occupations where there is not an hourly wage published, the annual wage has been directly calculated from the reported survey data.
(3) The relative standard error (RSE) is a measure of the reliability of a survey statistic. The smaller the relative standard error, the more precise the estimate.
(9) The location quotient is the ratio of the area concentration of occupational employment to the national average concentration. A location quotient greater than one indicates the occupation has a higher share of employment than average, and a location quotient less than one indicates the occupation is less prevalent in the area than average.
Other OEWS estimates and related information:
May 2023 National Occupational Employment and Wage Estimates
May 2023 State Occupational Employment and Wage Estimates
May 2023 Metropolitan and Nonmetropolitan Area Occupational Employment and Wage Estimates
May 2023 National Industry-Specific Occupational Employment and Wage Estimates
Last Modified Date: April 3, 2024