
An official website of the United States government
An official website of the United States government
The .gov means it's official.
Federal government websites often end in .gov or .mil. Before sharing sensitive information,
make sure you're on a federal government site.
The site is secure.
The
https:// ensures that you are connecting to the official website and that any
information you provide is encrypted and transmitted securely.
Diagnose, adjust, repair, or overhaul railroad rolling stock, mine cars, or mass transit rail cars. Excludes "Bus and Truck Mechanics and Diesel Engine Specialists" (49-3031).
Employment estimate and mean wage estimates for Rail Car Repairers:
| Employment (1) | Employment RSE (3) |
Mean hourly wage |
Mean annual wage (2) |
Wage RSE (3) |
|---|---|---|---|---|
| 22,310 | 5.4 % | $ 28.01 | $ 58,250 | 2.0 % |
Percentile wage estimates for Rail Car Repairers:
| Percentile | 10% | 25% | 50% (Median) |
75% | 90% |
|---|---|---|---|---|---|
| Hourly Wage | $ 16.88 | $ 21.23 | $ 27.74 | $ 35.18 | $ 39.79 |
| Annual Wage (2) | $ 35,110 | $ 44,160 | $ 57,710 | $ 73,170 | $ 82,760 |
Industries with the highest published employment and wages for Rail Car Repairers are provided. For a list of all industries with employment in Rail Car Repairers, see the Create Customized Tables function.
Industries with the highest levels of employment in Rail Car Repairers:
| Industry | Employment (1) | Percent of industry employment | Hourly mean wage | Annual mean wage (2) |
|---|---|---|---|---|
| Rail Transportation | 10,130 | 4.74 | $ 29.33 | $ 61,010 |
| Support Activities for Rail Transportation | 7,490 | 22.24 | $ 23.85 | $ 49,600 |
| Local Government, excluding schools and hospitals (OEWS Designation) | 2,160 | 0.04 | $ 35.54 | $ 73,910 |
| Railroad Rolling Stock Manufacturing | 1,170 | 5.42 | (8) | (8) |
| State Government, excluding schools and hospitals (OEWS Designation) | 550 | 0.02 | $ 35.68 | $ 74,210 |
Industries with the highest concentration of employment in Rail Car Repairers:
| Industry | Employment (1) | Percent of industry employment | Hourly mean wage | Annual mean wage (2) |
|---|---|---|---|---|
| Support Activities for Rail Transportation | 7,490 | 22.24 | $ 23.85 | $ 49,600 |
| Railroad Rolling Stock Manufacturing | 1,170 | 5.42 | (8) | (8) |
| Rail Transportation | 10,130 | 4.74 | $ 29.33 | $ 61,010 |
| Scenic and Sightseeing Transportation, Land | 60 | 0.64 | $ 20.59 | $ 42,820 |
| Urban Transit Systems | 60 | 0.15 | $ 34.15 | $ 71,030 |
Top paying industries for Rail Car Repairers:
| Industry | Employment (1) | Percent of industry employment | Hourly mean wage | Annual mean wage (2) |
|---|---|---|---|---|
| State Government, excluding schools and hospitals (OEWS Designation) | 550 | 0.02 | $ 35.68 | $ 74,210 |
| Local Government, excluding schools and hospitals (OEWS Designation) | 2,160 | 0.04 | $ 35.54 | $ 73,910 |
| Urban Transit Systems | 60 | 0.15 | $ 34.15 | $ 71,030 |
| Rail Transportation | 10,130 | 4.74 | $ 29.33 | $ 61,010 |
| Fabricated Metal Product Manufacturing (3321, 3322, 3325, 3326, and 3329 only) | 70 | 0.02 | $ 25.51 | $ 53,060 |
States and areas with the highest published employment, location quotients, and wages for Rail Car Repairers are provided. For a list of all areas with employment in Rail Car Repairers, see the Create Customized Tables function.

States with the highest employment level in Rail Car Repairers:
| State | Employment (1) | Employment per thousand jobs | Location quotient (9) | Hourly mean wage | Annual mean wage (2) |
|---|---|---|---|---|---|
| Illinois | 2,780 | 0.49 | 3.08 | $ 27.83 | $ 57,880 |
| Texas | 1,900 | 0.16 | 0.98 | $ 25.36 | $ 52,750 |
| New York | 1,520 | 0.17 | 1.09 | $ 35.90 | $ 74,670 |
| California | 1,290 | 0.08 | 0.49 | $ 30.66 | $ 63,780 |
| Minnesota | 1,190 | 0.44 | 2.74 | $ 30.37 | $ 63,170 |

States with the highest concentration of jobs and location quotients in Rail Car Repairers:
| State | Employment (1) | Employment per thousand jobs | Location quotient (9) | Hourly mean wage | Annual mean wage (2) |
|---|---|---|---|---|---|
| Wyoming | 290 | 1.12 | 6.97 | $ 24.44 | $ 50,830 |
| Nebraska | 690 | 0.73 | 4.53 | $ 26.68 | $ 55,500 |
| Illinois | 2,780 | 0.49 | 3.08 | $ 27.83 | $ 57,880 |
| Minnesota | 1,190 | 0.44 | 2.74 | $ 30.37 | $ 63,170 |
| North Dakota | 170 | 0.42 | 2.65 | $ 27.28 | $ 56,740 |
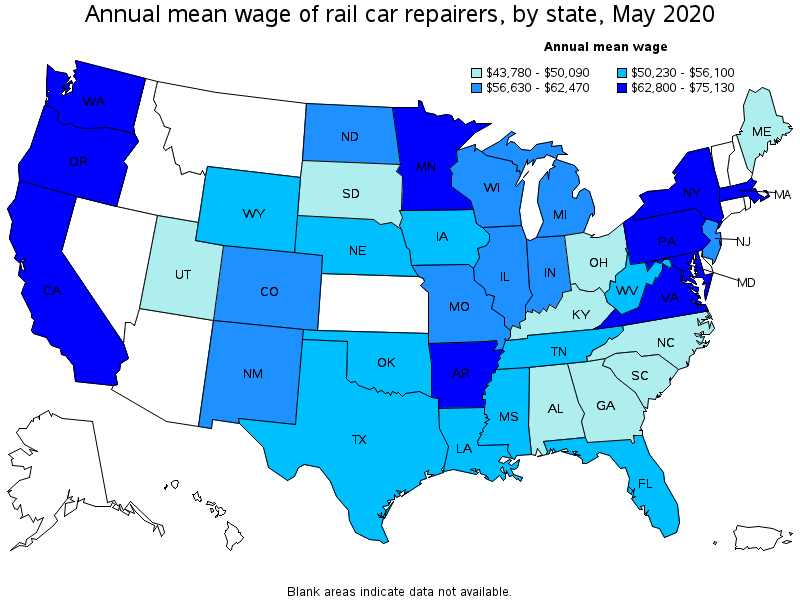
Top paying states for Rail Car Repairers:
| State | Employment (1) | Employment per thousand jobs | Location quotient (9) | Hourly mean wage | Annual mean wage (2) |
|---|---|---|---|---|---|
| Massachusetts | 330 | 0.10 | 0.61 | $ 36.12 | $ 75,130 |
| New York | 1,520 | 0.17 | 1.09 | $ 35.90 | $ 74,670 |
| Maryland | 630 | 0.25 | 1.56 | $ 33.96 | $ 70,630 |
| Arkansas | 220 | 0.19 | 1.19 | $ 33.40 | $ 69,470 |
| Virginia | 610 | 0.17 | 1.03 | $ 33.35 | $ 69,370 |

Metropolitan areas with the highest employment level in Rail Car Repairers:
| Metropolitan area | Employment (1) | Employment per thousand jobs | Location quotient (9) | Hourly mean wage | Annual mean wage (2) |
|---|---|---|---|---|---|
| Chicago-Naperville-Elgin, IL-IN-WI | 1,380 | 0.32 | 1.97 | $ 25.02 | $ 52,040 |
| New York-Newark-Jersey City, NY-NJ-PA | 870 | 0.10 | 0.61 | $ 37.82 | $ 78,660 |
| St. Louis, MO-IL | 520 | 0.40 | 2.47 | $ 24.93 | $ 51,850 |
| Dallas-Fort Worth-Arlington, TX | 420 | 0.12 | 0.74 | $ 23.45 | $ 48,770 |
| Houston-The Woodlands-Sugar Land, TX | 360 | 0.12 | 0.75 | $ 23.38 | $ 48,630 |
| Denver-Aurora-Lakewood, CO | 180 | 0.12 | 0.78 | (8) | (8) |
| Philadelphia-Camden-Wilmington, PA-NJ-DE-MD | 170 | 0.06 | 0.40 | $ 23.19 | $ 48,230 |
| Salt Lake City, UT | 160 | 0.21 | 1.34 | $ 19.84 | $ 41,270 |
| Kansas City, MO-KS | 140 | 0.14 | 0.86 | $ 20.89 | $ 43,450 |
| Louisville/Jefferson County, KY-IN | 100 | 0.16 | 1.01 | $ 20.98 | $ 43,640 |

Metropolitan areas with the highest concentration of jobs and location quotients in Rail Car Repairers:
| Metropolitan area | Employment (1) | Employment per thousand jobs | Location quotient (9) | Hourly mean wage | Annual mean wage (2) |
|---|---|---|---|---|---|
| Montgomery, AL | 90 | 0.56 | 3.50 | $ 20.07 | $ 41,740 |
| St. Louis, MO-IL | 520 | 0.40 | 2.47 | $ 24.93 | $ 51,850 |
| Huntington-Ashland, WV-KY-OH | 50 | 0.39 | 2.46 | $ 17.88 | $ 37,200 |
| Chicago-Naperville-Elgin, IL-IN-WI | 1,380 | 0.32 | 1.97 | $ 25.02 | $ 52,040 |
| Baton Rouge, LA | 90 | 0.25 | 1.59 | $ 26.89 | $ 55,930 |
| Salt Lake City, UT | 160 | 0.21 | 1.34 | $ 19.84 | $ 41,270 |
| Omaha-Council Bluffs, NE-IA | 100 | 0.20 | 1.28 | $ 19.74 | $ 41,060 |
| Stockton-Lodi, CA | 40 | 0.18 | 1.09 | $ 29.45 | $ 61,260 |
| Louisville/Jefferson County, KY-IN | 100 | 0.16 | 1.01 | $ 20.98 | $ 43,640 |
| Kansas City, MO-KS | 140 | 0.14 | 0.86 | $ 20.89 | $ 43,450 |

Top paying metropolitan areas for Rail Car Repairers:
| Metropolitan area | Employment (1) | Employment per thousand jobs | Location quotient (9) | Hourly mean wage | Annual mean wage (2) |
|---|---|---|---|---|---|
| New York-Newark-Jersey City, NY-NJ-PA | 870 | 0.10 | 0.61 | $ 37.82 | $ 78,660 |
| Washington-Arlington-Alexandria, DC-VA-MD-WV | (8) | (8) | (8) | $ 35.56 | $ 73,970 |
| Portland-Vancouver-Hillsboro, OR-WA | (8) | (8) | (8) | $ 35.48 | $ 73,790 |
| Sacramento--Roseville--Arden-Arcade, CA | 50 | 0.05 | 0.30 | $ 33.45 | $ 69,580 |
| Seattle-Tacoma-Bellevue, WA | (8) | (8) | (8) | $ 30.74 | $ 63,940 |
| Minneapolis-St. Paul-Bloomington, MN-WI | (8) | (8) | (8) | $ 30.26 | $ 62,940 |
| Stockton-Lodi, CA | 40 | 0.18 | 1.09 | $ 29.45 | $ 61,260 |
| New Orleans-Metairie, LA | (8) | (8) | (8) | $ 28.30 | $ 58,870 |
| Baton Rouge, LA | 90 | 0.25 | 1.59 | $ 26.89 | $ 55,930 |
| Chicago-Naperville-Elgin, IL-IN-WI | 1,380 | 0.32 | 1.97 | $ 25.02 | $ 52,040 |
Nonmetropolitan areas with the highest employment in Rail Car Repairers:
| Nonmetropolitan area | Employment (1) | Employment per thousand jobs | Location quotient (9) | Hourly mean wage | Annual mean wage (2) |
|---|---|---|---|---|---|
| Western Wyoming nonmetropolitan area | 150 | 1.57 | 9.82 | $ 21.83 | $ 45,400 |
| Southeast Mississippi nonmetropolitan area | 140 | 0.95 | 5.89 | $ 25.63 | $ 53,320 |
| South Georgia nonmetropolitan area | 110 | 0.59 | 3.68 | $ 21.56 | $ 44,840 |
| North Texas Region of Texas nonmetropolitan area | 90 | 0.32 | 1.98 | $ 19.25 | $ 40,050 |
Nonmetropolitan areas with the highest concentration of jobs and location quotients in Rail Car Repairers:
| Nonmetropolitan area | Employment (1) | Employment per thousand jobs | Location quotient (9) | Hourly mean wage | Annual mean wage (2) |
|---|---|---|---|---|---|
| Western Wyoming nonmetropolitan area | 150 | 1.57 | 9.82 | $ 21.83 | $ 45,400 |
| Southeast Mississippi nonmetropolitan area | 140 | 0.95 | 5.89 | $ 25.63 | $ 53,320 |
| South Georgia nonmetropolitan area | 110 | 0.59 | 3.68 | $ 21.56 | $ 44,840 |
| North Texas Region of Texas nonmetropolitan area | 90 | 0.32 | 1.98 | $ 19.25 | $ 40,050 |
Top paying nonmetropolitan areas for Rail Car Repairers:
| Nonmetropolitan area | Employment (1) | Employment per thousand jobs | Location quotient (9) | Hourly mean wage | Annual mean wage (2) |
|---|---|---|---|---|---|
| Southeast Mississippi nonmetropolitan area | 140 | 0.95 | 5.89 | $ 25.63 | $ 53,320 |
| Western Wyoming nonmetropolitan area | 150 | 1.57 | 9.82 | $ 21.83 | $ 45,400 |
| South Georgia nonmetropolitan area | 110 | 0.59 | 3.68 | $ 21.56 | $ 44,840 |
| North Texas Region of Texas nonmetropolitan area | 90 | 0.32 | 1.98 | $ 19.25 | $ 40,050 |
These estimates are calculated with data collected from employers in all industry sectors, all metropolitan and nonmetropolitan areas, and all states and the District of Columbia. The top employment and wage figures are provided above. The complete list is available in the downloadable XLS files.
The percentile wage estimate is the value of a wage below which a certain percent of workers fall. The median wage is the 50th percentile wage estimate—50 percent of workers earn less than the median and 50 percent of workers earn more than the median. More about percentile wages.
(1) Estimates for detailed occupations do not sum to the totals because the totals include occupations not shown separately. Estimates do not include self-employed workers.
(2) Annual wages have been calculated by multiplying the hourly mean wage by a "year-round, full-time" hours figure of 2,080 hours; for those occupations where there is not an hourly wage published, the annual wage has been directly calculated from the reported survey data.
(3) The relative standard error (RSE) is a measure of the reliability of a survey statistic. The smaller the relative standard error, the more precise the estimate.
(8) Estimate not released.
(9) The location quotient is the ratio of the area concentration of occupational employment to the national average concentration. A location quotient greater than one indicates the occupation has a higher share of employment than average, and a location quotient less than one indicates the occupation is less prevalent in the area than average.
Other OEWS estimates and related information:
May 2020 National Occupational Employment and Wage Estimates
May 2020 State Occupational Employment and Wage Estimates
May 2020 Metropolitan and Nonmetropolitan Area Occupational Employment and Wage Estimates
May 2020 National Industry-Specific Occupational Employment and Wage Estimates
Last Modified Date: March 31, 2021