
An official website of the United States government
An official website of the United States government
The .gov means it's official.
Federal government websites often end in .gov or .mil. Before sharing sensitive information,
make sure you're on a federal government site.
The site is secure.
The
https:// ensures that you are connecting to the official website and that any
information you provide is encrypted and transmitted securely.
Direct and may participate in the preparation, seasoning, and cooking of salads, soups, fish, meats, vegetables, desserts, or other foods. May plan and price menu items, order supplies, and keep records and accounts.
Employment estimate and mean wage estimates for Chefs and Head Cooks:
| Employment (1) | Employment RSE (3) |
Mean hourly wage |
Mean annual wage (2) |
Wage RSE (3) |
|---|---|---|---|---|
| 101,490 | 2.6 % | $ 28.24 | $ 58,740 | 1.5 % |
Percentile wage estimates for Chefs and Head Cooks:
| Percentile | 10% | 25% | 50% (Median) |
75% | 90% |
|---|---|---|---|---|---|
| Hourly Wage | $ 14.57 | $ 18.95 | $ 25.66 | $ 34.30 | $ 43.65 |
| Annual Wage (2) | $ 30,300 | $ 39,420 | $ 53,380 | $ 71,350 | $ 90,790 |
Industries with the highest published employment and wages for Chefs and Head Cooks are provided. For a list of all industries with employment in Chefs and Head Cooks, see the Create Customized Tables function.
Industries with the highest levels of employment in Chefs and Head Cooks:
| Industry | Employment (1) | Percent of industry employment | Hourly mean wage | Annual mean wage (2) |
|---|---|---|---|---|
| Restaurants and Other Eating Places | 50,210 | 0.56 | $ 27.03 | $ 56,230 |
| Special Food Services | 12,000 | 2.15 | $ 29.87 | $ 62,120 |
| Traveler Accommodation | 10,870 | 0.72 | $ 31.22 | $ 64,940 |
| Other Amusement and Recreation Industries | 5,440 | 0.54 | $ 31.29 | $ 65,070 |
| Continuing Care Retirement Communities and Assisted Living Facilities for the Elderly | 2,960 | 0.31 | $ 26.02 | $ 54,130 |
Industries with the highest concentration of employment in Chefs and Head Cooks:
| Industry | Employment (1) | Percent of industry employment | Hourly mean wage | Annual mean wage (2) |
|---|---|---|---|---|
| Special Food Services | 12,000 | 2.15 | $ 29.87 | $ 62,120 |
| Rooming and Boarding Houses | 80 | 0.79 | $ 22.24 | $ 46,260 |
| Traveler Accommodation | 10,870 | 0.72 | $ 31.22 | $ 64,940 |
| Scenic and Sightseeing Transportation, Water | 80 | 0.68 | $ 29.90 | $ 62,200 |
| Restaurants and Other Eating Places | 50,210 | 0.56 | $ 27.03 | $ 56,230 |
Top paying industries for Chefs and Head Cooks:
| Industry | Employment (1) | Percent of industry employment | Hourly mean wage | Annual mean wage (2) |
|---|---|---|---|---|
| Deep Sea, Coastal, and Great Lakes Water Transportation | 60 | 0.16 | $ 42.74 | $ 88,890 |
| Office Administrative Services | (8) | (8) | $ 36.90 | $ 76,750 |
| Federal Executive Branch (OEWS Designation) | 1,520 | 0.07 | $ 35.87 | $ 74,610 |
| Insurance Carriers | 60 | (7) | $ 35.65 | $ 74,160 |
| Land Subdivision | 40 | 0.12 | $ 34.03 | $ 70,790 |
States and areas with the highest published employment, location quotients, and wages for Chefs and Head Cooks are provided. For a list of all areas with employment in Chefs and Head Cooks, see the Create Customized Tables function.

States with the highest employment level in Chefs and Head Cooks:
| State | Employment (1) | Employment per thousand jobs | Location quotient (9) | Hourly mean wage | Annual mean wage (2) |
|---|---|---|---|---|---|
| California | 15,960 | 0.97 | 1.33 | $ 32.41 | $ 67,400 |
| New York | 12,930 | 1.49 | 2.04 | $ 29.83 | $ 62,050 |
| Florida | 10,580 | 1.25 | 1.72 | $ 26.60 | $ 55,330 |
| Texas | 4,900 | 0.40 | 0.56 | $ 27.53 | $ 57,260 |
| Massachusetts | 3,250 | 0.97 | 1.33 | $ 31.66 | $ 65,850 |

States with the highest concentration of jobs and location quotients in Chefs and Head Cooks:
| State | Employment (1) | Employment per thousand jobs | Location quotient (9) | Hourly mean wage | Annual mean wage (2) |
|---|---|---|---|---|---|
| Vermont | 730 | 2.60 | 3.56 | $ 22.16 | $ 46,100 |
| Nevada | 2,150 | 1.72 | 2.36 | $ 27.60 | $ 57,410 |
| New York | 12,930 | 1.49 | 2.04 | $ 29.83 | $ 62,050 |
| Alaska | 420 | 1.41 | 1.93 | $ 25.29 | $ 52,590 |
| District of Columbia | 930 | 1.36 | 1.86 | $ 31.40 | $ 65,320 |

Top paying states for Chefs and Head Cooks:
| State | Employment (1) | Employment per thousand jobs | Location quotient (9) | Hourly mean wage | Annual mean wage (2) |
|---|---|---|---|---|---|
| New Jersey | 2,380 | 0.63 | 0.86 | $ 40.24 | $ 83,700 |
| Hawaii | 610 | 1.06 | 1.45 | $ 35.65 | $ 74,150 |
| Rhode Island | 230 | 0.51 | 0.70 | $ 35.55 | $ 73,950 |
| California | 15,960 | 0.97 | 1.33 | $ 32.41 | $ 67,400 |
| Massachusetts | 3,250 | 0.97 | 1.33 | $ 31.66 | $ 65,850 |
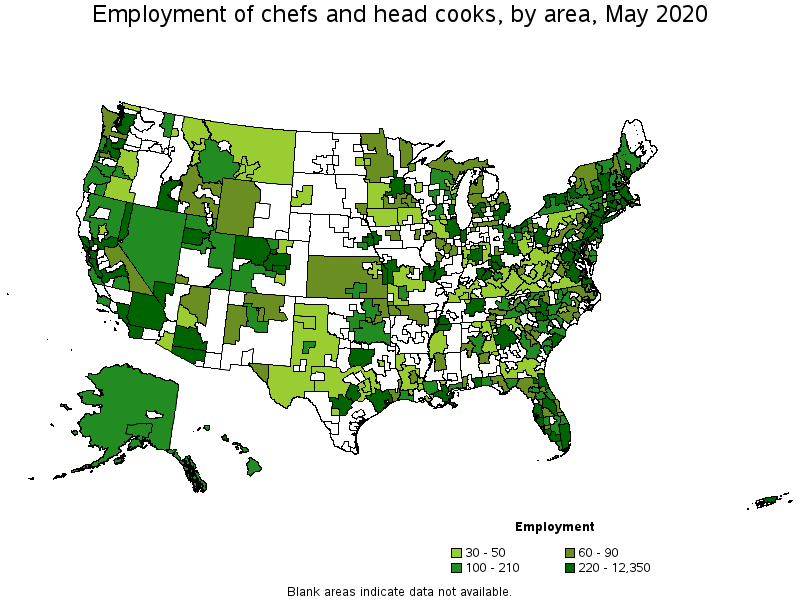
Metropolitan areas with the highest employment level in Chefs and Head Cooks:
| Metropolitan area | Employment (1) | Employment per thousand jobs | Location quotient (9) | Hourly mean wage | Annual mean wage (2) |
|---|---|---|---|---|---|
| New York-Newark-Jersey City, NY-NJ-PA | 12,350 | 1.40 | 1.92 | $ 32.33 | $ 67,250 |
| Los Angeles-Long Beach-Anaheim, CA | 5,380 | 0.92 | 1.27 | $ 28.46 | $ 59,190 |
| San Francisco-Oakland-Hayward, CA | 3,680 | 1.58 | 2.16 | $ 34.35 | $ 71,450 |
| Miami-Fort Lauderdale-West Palm Beach, FL | 2,820 | 1.12 | 1.54 | $ 26.82 | $ 55,780 |
| Chicago-Naperville-Elgin, IL-IN-WI | 2,600 | 0.60 | 0.82 | $ 29.79 | $ 61,960 |
| Washington-Arlington-Alexandria, DC-VA-MD-WV | 2,550 | 0.84 | 1.16 | $ 29.71 | $ 61,800 |
| Boston-Cambridge-Nashua, MA-NH | 2,550 | 0.98 | 1.34 | $ 32.11 | $ 66,780 |
| Orlando-Kissimmee-Sanford, FL | 1,960 | 1.65 | 2.26 | $ 27.28 | $ 56,750 |
| Las Vegas-Henderson-Paradise, NV | 1,760 | 1.95 | 2.68 | $ 27.90 | $ 58,040 |
| Dallas-Fort Worth-Arlington, TX | 1,710 | 0.48 | 0.65 | $ 28.12 | $ 58,500 |

Metropolitan areas with the highest concentration of jobs and location quotients in Chefs and Head Cooks:
| Metropolitan area | Employment (1) | Employment per thousand jobs | Location quotient (9) | Hourly mean wage | Annual mean wage (2) |
|---|---|---|---|---|---|
| Napa, CA | 230 | 3.36 | 4.61 | $ 35.85 | $ 74,570 |
| Cape Coral-Fort Myers, FL | 810 | 3.09 | 4.24 | $ 35.52 | $ 73,890 |
| The Villages, FL | 90 | 2.99 | 4.10 | $ 26.47 | $ 55,050 |
| Naples-Immokalee-Marco Island, FL | 430 | 2.98 | 4.08 | $ 32.48 | $ 67,550 |
| Hilton Head Island-Bluffton-Beaufort, SC | 200 | 2.71 | 3.71 | $ 23.37 | $ 48,620 |
| Medford, OR | 190 | 2.32 | 3.17 | $ 24.77 | $ 51,520 |
| Charleston-North Charleston, SC | 780 | 2.27 | 3.11 | $ 20.24 | $ 42,100 |
| Kingston, NY | 120 | 2.22 | 3.04 | $ 29.19 | $ 60,720 |
| Kahului-Wailuku-Lahaina, HI | 150 | 2.19 | 3.00 | $ 43.67 | $ 90,840 |
| Glens Falls, NY | 100 | 2.17 | 2.97 | $ 24.26 | $ 50,470 |
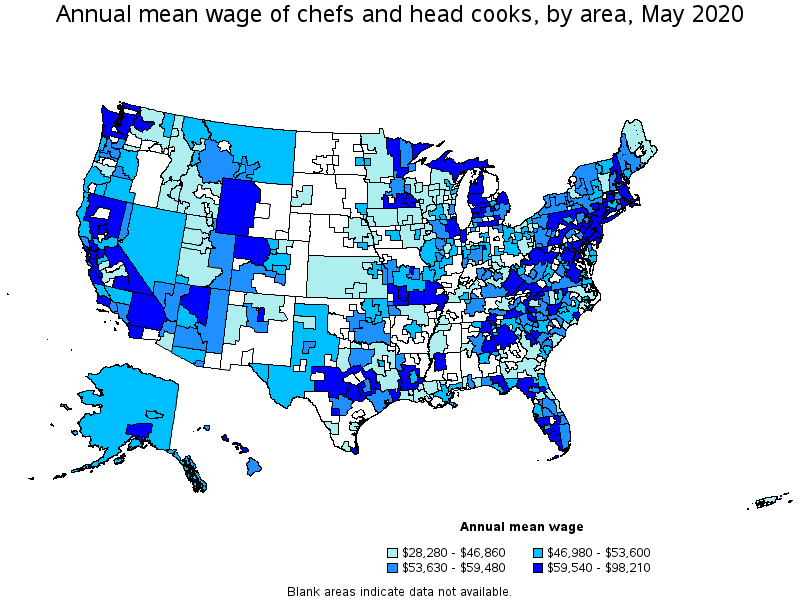
Top paying metropolitan areas for Chefs and Head Cooks:
| Metropolitan area | Employment (1) | Employment per thousand jobs | Location quotient (9) | Hourly mean wage | Annual mean wage (2) |
|---|---|---|---|---|---|
| San Diego-Carlsbad, CA | 1,450 | 1.04 | 1.42 | $ 47.22 | $ 98,210 |
| Kahului-Wailuku-Lahaina, HI | 150 | 2.19 | 3.00 | $ 43.67 | $ 90,840 |
| Bridgeport-Stamford-Norwalk, CT | 290 | 0.76 | 1.04 | $ 41.57 | $ 86,460 |
| San Jose-Sunnyvale-Santa Clara, CA | 990 | 0.90 | 1.23 | $ 40.45 | $ 84,130 |
| Muncie, IN | (8) | (8) | (8) | $ 39.05 | $ 81,230 |
| Ocean City, NJ | 50 | 1.54 | 2.10 | $ 36.91 | $ 76,770 |
| Santa Fe, NM | 60 | 1.06 | 1.45 | $ 36.59 | $ 76,100 |
| Napa, CA | 230 | 3.36 | 4.61 | $ 35.85 | $ 74,570 |
| Urban Honolulu, HI | 300 | 0.72 | 0.98 | $ 35.75 | $ 74,350 |
| Atlantic City-Hammonton, NJ | 90 | 0.79 | 1.08 | $ 35.68 | $ 74,210 |
Nonmetropolitan areas with the highest employment in Chefs and Head Cooks:
| Nonmetropolitan area | Employment (1) | Employment per thousand jobs | Location quotient (9) | Hourly mean wage | Annual mean wage (2) |
|---|---|---|---|---|---|
| Southern Vermont nonmetropolitan area | 410 | 4.24 | 5.81 | $ 20.44 | $ 42,520 |
| Northwest Colorado nonmetropolitan area | 370 | 3.27 | 4.49 | $ 29.51 | $ 61,380 |
| Southwest Maine nonmetropolitan area | 210 | 1.15 | 1.58 | $ 27.30 | $ 56,780 |
| Northeastern Wisconsin nonmetropolitan area | 200 | 1.06 | 1.45 | $ 18.73 | $ 38,960 |
| Northern Vermont nonmetropolitan area | 200 | 3.05 | 4.18 | $ 25.25 | $ 52,520 |
Nonmetropolitan areas with the highest concentration of jobs and location quotients in Chefs and Head Cooks:
| Nonmetropolitan area | Employment (1) | Employment per thousand jobs | Location quotient (9) | Hourly mean wage | Annual mean wage (2) |
|---|---|---|---|---|---|
| Southern Vermont nonmetropolitan area | 410 | 4.24 | 5.81 | $ 20.44 | $ 42,520 |
| Northwest Colorado nonmetropolitan area | 370 | 3.27 | 4.49 | $ 29.51 | $ 61,380 |
| Northern Vermont nonmetropolitan area | 200 | 3.05 | 4.18 | $ 25.25 | $ 52,520 |
| Massachusetts nonmetropolitan area | 150 | 2.59 | 3.56 | $ 33.04 | $ 68,720 |
| Northern New Hampshire nonmetropolitan area | 80 | 2.55 | 3.50 | $ 31.12 | $ 64,730 |
Top paying nonmetropolitan areas for Chefs and Head Cooks:
| Nonmetropolitan area | Employment (1) | Employment per thousand jobs | Location quotient (9) | Hourly mean wage | Annual mean wage (2) |
|---|---|---|---|---|---|
| Central New Hampshire nonmetropolitan area | 100 | 1.07 | 1.47 | $ 38.36 | $ 79,790 |
| Northern Pennsylvania nonmetropolitan area | 40 | 0.30 | 0.41 | $ 34.65 | $ 72,070 |
| Upper Peninsula of Michigan nonmetropolitan area | 70 | 0.68 | 0.93 | $ 34.44 | $ 71,640 |
| Northern West Virginia nonmetropolitan area | 40 | 0.28 | 0.38 | $ 33.09 | $ 68,830 |
| East Kentucky nonmetropolitan area | 40 | 0.38 | 0.53 | $ 33.05 | $ 68,750 |
These estimates are calculated with data collected from employers in all industry sectors, all metropolitan and nonmetropolitan areas, and all states and the District of Columbia. The top employment and wage figures are provided above. The complete list is available in the downloadable XLS files.
The percentile wage estimate is the value of a wage below which a certain percent of workers fall. The median wage is the 50th percentile wage estimate—50 percent of workers earn less than the median and 50 percent of workers earn more than the median. More about percentile wages.
(1) Estimates for detailed occupations do not sum to the totals because the totals include occupations not shown separately. Estimates do not include self-employed workers.
(2) Annual wages have been calculated by multiplying the hourly mean wage by a "year-round, full-time" hours figure of 2,080 hours; for those occupations where there is not an hourly wage published, the annual wage has been directly calculated from the reported survey data.
(3) The relative standard error (RSE) is a measure of the reliability of a survey statistic. The smaller the relative standard error, the more precise the estimate.
(7) The value is less than .005 percent of industry employment.
(8) Estimate not released.
(9) The location quotient is the ratio of the area concentration of occupational employment to the national average concentration. A location quotient greater than one indicates the occupation has a higher share of employment than average, and a location quotient less than one indicates the occupation is less prevalent in the area than average.
Other OEWS estimates and related information:
May 2020 National Occupational Employment and Wage Estimates
May 2020 State Occupational Employment and Wage Estimates
May 2020 Metropolitan and Nonmetropolitan Area Occupational Employment and Wage Estimates
May 2020 National Industry-Specific Occupational Employment and Wage Estimates
Last Modified Date: March 31, 2021