
An official website of the United States government
An official website of the United States government
The .gov means it's official.
Federal government websites often end in .gov or .mil. Before sharing sensitive information,
make sure you're on a federal government site.
The site is secure.
The
https:// ensures that you are connecting to the official website and that any
information you provide is encrypted and transmitted securely.
This occupation includes the 2018 SOC occupations 33-9094 School Bus Monitors and 33-9099 Protective Service Workers, All Other and the 2010 SOC occupation 33-9099 Protective Service Workers, All Other.
Employment estimate and mean wage estimates for School Bus Monitors and Protective Service Workers, All Other:
| Employment (1) | Employment RSE (3) |
Mean hourly wage |
Mean annual wage (2) |
Wage RSE (3) |
|---|---|---|---|---|
| 144,310 | 2.1 % | $ 17.38 | $ 36,140 | 0.6 % |
Percentile wage estimates for School Bus Monitors and Protective Service Workers, All Other:
| Percentile | 10% | 25% | 50% (Median) |
75% | 90% |
|---|---|---|---|---|---|
| Hourly Wage | $ 10.39 | $ 12.76 | $ 15.37 | $ 19.85 | $ 26.84 |
| Annual Wage (2) | $ 21,610 | $ 26,540 | $ 31,960 | $ 41,290 | $ 55,830 |
Industries with the highest published employment and wages for School Bus Monitors and Protective Service Workers, All Other are provided. For a list of all industries with employment in School Bus Monitors and Protective Service Workers, All Other, see the Create Customized Tables function.
Industries with the highest levels of employment in School Bus Monitors and Protective Service Workers, All Other:
| Industry | Employment (1) | Percent of industry employment | Hourly mean wage | Annual mean wage (2) |
|---|---|---|---|---|
| Elementary and Secondary Schools | 60,250 | 0.73 | $ 15.07 | $ 31,350 |
| School and Employee Bus Transportation | 17,960 | 10.56 | $ 15.04 | $ 31,280 |
| Local Government, excluding schools and hospitals (OEWS Designation) | 17,090 | 0.32 | $ 20.69 | $ 43,030 |
| State Government, excluding schools and hospitals (OEWS Designation) | 4,360 | 0.20 | $ 22.58 | $ 46,970 |
| Warehousing and Storage | 4,010 | 0.28 | $ 21.31 | $ 44,330 |
Industries with the highest concentration of employment in School Bus Monitors and Protective Service Workers, All Other:
| Industry | Employment (1) | Percent of industry employment | Hourly mean wage | Annual mean wage (2) |
|---|---|---|---|---|
| School and Employee Bus Transportation | 17,960 | 10.56 | $ 15.04 | $ 31,280 |
| Other Transit and Ground Passenger Transportation | 1,300 | 1.34 | $ 14.35 | $ 29,840 |
| Elementary and Secondary Schools | 60,250 | 0.73 | $ 15.07 | $ 31,350 |
| Monetary Authorities-Central Bank | 90 | 0.46 | $ 26.67 | $ 55,480 |
| Local Government, excluding schools and hospitals (OEWS Designation) | 17,090 | 0.32 | $ 20.69 | $ 43,030 |
Top paying industries for School Bus Monitors and Protective Service Workers, All Other:
| Industry | Employment (1) | Percent of industry employment | Hourly mean wage | Annual mean wage (2) |
|---|---|---|---|---|
| Postal Service (federal government) | 240 | 0.04 | $ 38.04 | $ 79,120 |
| Architectural, Engineering, and Related Services | 110 | 0.01 | $ 35.18 | $ 73,170 |
| Machinery Manufacturing (3331, 3332, 3334, and 3339 only) | 80 | 0.01 | $ 32.22 | $ 67,020 |
| Computer Systems Design and Related Services | 130 | 0.01 | $ 30.69 | $ 63,840 |
| Monetary Authorities-Central Bank | 90 | 0.46 | $ 26.67 | $ 55,480 |
States and areas with the highest published employment, location quotients, and wages for School Bus Monitors and Protective Service Workers, All Other are provided. For a list of all areas with employment in School Bus Monitors and Protective Service Workers, All Other, see the Create Customized Tables function.
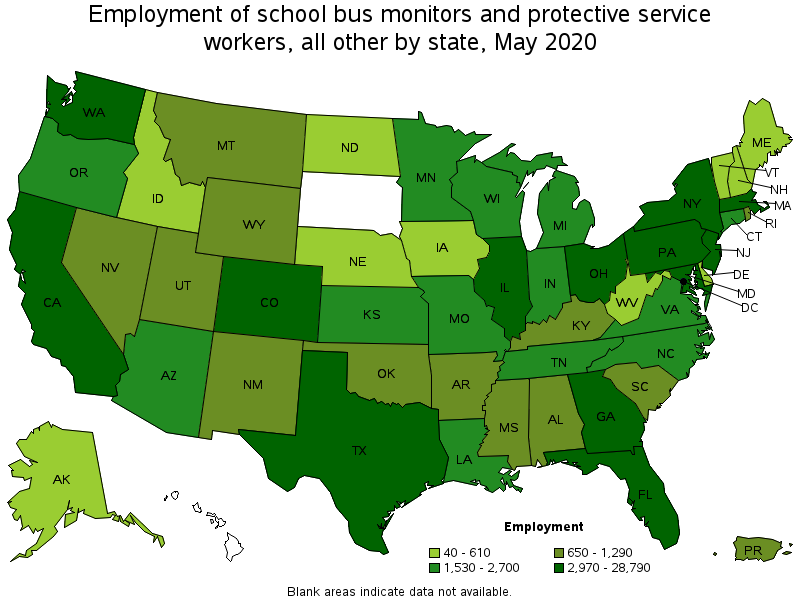
States with the highest employment level in School Bus Monitors and Protective Service Workers, All Other:
| State | Employment (1) | Employment per thousand jobs | Location quotient (9) | Hourly mean wage | Annual mean wage (2) |
|---|---|---|---|---|---|
| California | 28,790 | 1.75 | 1.69 | $ 18.80 | $ 39,110 |
| New York | 13,470 | 1.55 | 1.49 | $ 16.14 | $ 33,570 |
| Texas | 10,370 | 0.86 | 0.83 | $ 13.47 | $ 28,010 |
| Florida | 9,900 | 1.17 | 1.13 | $ 16.80 | $ 34,940 |
| Pennsylvania | 6,510 | 1.18 | 1.14 | $ 15.15 | $ 31,510 |

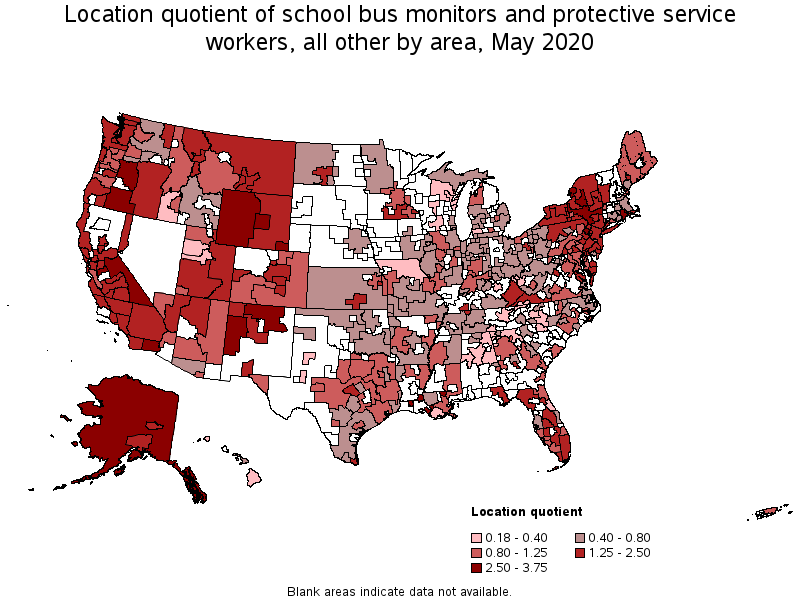
States with the highest concentration of jobs and location quotients in School Bus Monitors and Protective Service Workers, All Other:
| State | Employment (1) | Employment per thousand jobs | Location quotient (9) | Hourly mean wage | Annual mean wage (2) |
|---|---|---|---|---|---|
| Wyoming | 780 | 2.97 | 2.87 | $ 18.67 | $ 38,840 |
| Rhode Island | 1,290 | 2.92 | 2.81 | $ 16.25 | $ 33,790 |
| Alaska | 610 | 2.04 | 1.97 | $ 20.74 | $ 43,130 |
| Colorado | 4,640 | 1.80 | 1.73 | $ 18.95 | $ 39,420 |
| California | 28,790 | 1.75 | 1.69 | $ 18.80 | $ 39,110 |
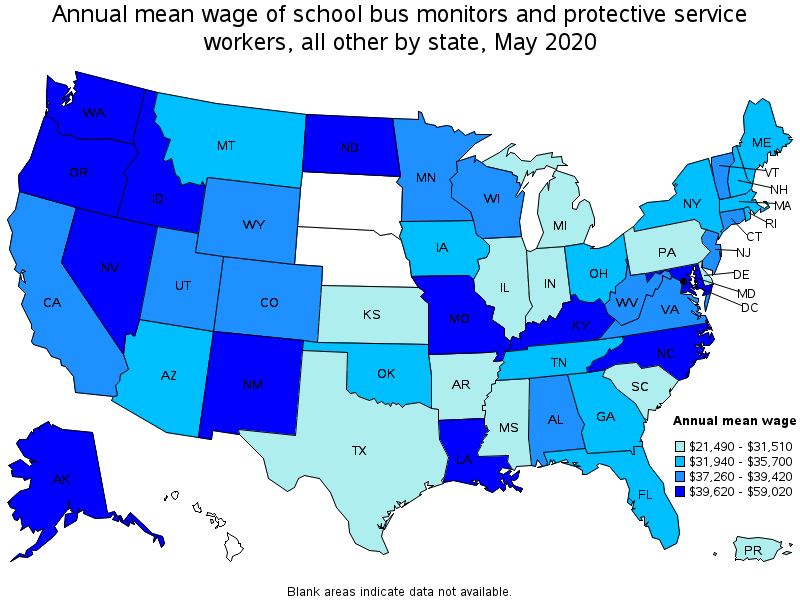
Top paying states for School Bus Monitors and Protective Service Workers, All Other:
| State | Employment (1) | Employment per thousand jobs | Location quotient (9) | Hourly mean wage | Annual mean wage (2) |
|---|---|---|---|---|---|
| District of Columbia | 160 | 0.23 | 0.22 | $ 28.38 | $ 59,020 |
| New Mexico | 1,280 | 1.63 | 1.57 | $ 21.95 | $ 45,650 |
| Washington | 4,670 | 1.46 | 1.41 | $ 21.92 | $ 45,600 |
| Alaska | 610 | 2.04 | 1.97 | $ 20.74 | $ 43,130 |
| North Dakota | 230 | 0.58 | 0.55 | $ 20.71 | $ 43,070 |

Metropolitan areas with the highest employment level in School Bus Monitors and Protective Service Workers, All Other:
| Metropolitan area | Employment (1) | Employment per thousand jobs | Location quotient (9) | Hourly mean wage | Annual mean wage (2) |
|---|---|---|---|---|---|
| New York-Newark-Jersey City, NY-NJ-PA | 12,050 | 1.36 | 1.31 | $ 17.56 | $ 36,530 |
| Los Angeles-Long Beach-Anaheim, CA | 9,640 | 1.66 | 1.60 | $ 18.04 | $ 37,520 |
| Miami-Fort Lauderdale-West Palm Beach, FL | 3,950 | 1.58 | 1.52 | $ 17.53 | $ 36,450 |
| Riverside-San Bernardino-Ontario, CA | 3,760 | 2.52 | 2.43 | $ 17.18 | $ 35,740 |
| Philadelphia-Camden-Wilmington, PA-NJ-DE-MD | 3,740 | 1.39 | 1.34 | $ 13.84 | $ 28,780 |
| San Francisco-Oakland-Hayward, CA | 3,210 | 1.38 | 1.33 | $ 25.11 | $ 52,220 |
| Dallas-Fort Worth-Arlington, TX | 3,130 | 0.87 | 0.84 | $ 13.83 | $ 28,770 |
| Chicago-Naperville-Elgin, IL-IN-WI | 2,950 | 0.68 | 0.65 | $ 14.71 | $ 30,590 |
| Washington-Arlington-Alexandria, DC-VA-MD-WV | 2,900 | 0.96 | 0.92 | $ 21.67 | $ 45,080 |
| Denver-Aurora-Lakewood, CO | 2,850 | 1.96 | 1.89 | $ 18.95 | $ 39,420 |
Metropolitan areas with the highest concentration of jobs and location quotients in School Bus Monitors and Protective Service Workers, All Other:
| Metropolitan area | Employment (1) | Employment per thousand jobs | Location quotient (9) | Hourly mean wage | Annual mean wage (2) |
|---|---|---|---|---|---|
| Casper, WY | 140 | 3.89 | 3.75 | $ 17.02 | $ 35,400 |
| Utica-Rome, NY | 400 | 3.43 | 3.30 | $ 14.50 | $ 30,170 |
| El Centro, CA | 190 | 3.35 | 3.23 | $ 18.35 | $ 38,160 |
| East Stroudsburg, PA | 150 | 2.98 | 2.87 | $ 13.78 | $ 28,660 |
| Watertown-Fort Drum, NY | 100 | 2.73 | 2.63 | $ 15.51 | $ 32,260 |
| Cheyenne, WY | 120 | 2.72 | 2.62 | $ 21.30 | $ 44,300 |
| Modesto, CA | 480 | 2.69 | 2.59 | $ 16.93 | $ 35,210 |
| Providence-Warwick, RI-MA | 1,390 | 2.63 | 2.54 | $ 16.27 | $ 33,850 |
| Stockton-Lodi, CA | 630 | 2.53 | 2.44 | $ 18.92 | $ 39,350 |
| Riverside-San Bernardino-Ontario, CA | 3,760 | 2.52 | 2.43 | $ 17.18 | $ 35,740 |

Top paying metropolitan areas for School Bus Monitors and Protective Service Workers, All Other:
| Metropolitan area | Employment (1) | Employment per thousand jobs | Location quotient (9) | Hourly mean wage | Annual mean wage (2) |
|---|---|---|---|---|---|
| Gettysburg, PA | 40 | 1.22 | 1.18 | $ 27.91 | $ 58,050 |
| San Francisco-Oakland-Hayward, CA | 3,210 | 1.38 | 1.33 | $ 25.11 | $ 52,220 |
| Albuquerque, NM | 550 | 1.47 | 1.42 | $ 23.61 | $ 49,110 |
| Mount Vernon-Anacortes, WA | 80 | 1.76 | 1.70 | $ 23.47 | $ 48,820 |
| San Luis Obispo-Paso Robles-Arroyo Grande, CA | 170 | 1.55 | 1.50 | $ 22.99 | $ 47,820 |
| Bremerton-Silverdale, WA | 90 | 1.06 | 1.02 | $ 22.96 | $ 47,750 |
| Seattle-Tacoma-Bellevue, WA | 2,840 | 1.45 | 1.40 | $ 22.87 | $ 47,560 |
| Napa, CA | (8) | (8) | (8) | $ 22.62 | $ 47,050 |
| Lexington-Fayette, KY | 90 | 0.34 | 0.33 | $ 22.58 | $ 46,960 |
| San Jose-Sunnyvale-Santa Clara, CA | 1,120 | 1.02 | 0.98 | $ 22.47 | $ 46,730 |
Nonmetropolitan areas with the highest employment in School Bus Monitors and Protective Service Workers, All Other:
| Nonmetropolitan area | Employment (1) | Employment per thousand jobs | Location quotient (9) | Hourly mean wage | Annual mean wage (2) |
|---|---|---|---|---|---|
| Central East New York nonmetropolitan area | 420 | 2.80 | 2.70 | $ 17.49 | $ 36,370 |
| Western Wyoming nonmetropolitan area | 350 | 3.71 | 3.57 | $ 19.50 | $ 40,550 |
| Southwest New York nonmetropolitan area | 330 | 2.01 | 1.94 | $ 13.41 | $ 27,890 |
| North Florida nonmetropolitan area | 310 | 2.57 | 2.47 | $ 16.56 | $ 34,450 |
| Alaska nonmetropolitan area | 290 | 2.86 | 2.76 | $ 23.90 | $ 49,720 |
Nonmetropolitan areas with the highest concentration of jobs and location quotients in School Bus Monitors and Protective Service Workers, All Other:
| Nonmetropolitan area | Employment (1) | Employment per thousand jobs | Location quotient (9) | Hourly mean wage | Annual mean wage (2) |
|---|---|---|---|---|---|
| Western Wyoming nonmetropolitan area | 350 | 3.71 | 3.57 | $ 19.50 | $ 40,550 |
| Eastern Sierra-Mother Lode Region of California nonmetropolitan area | 200 | 3.58 | 3.45 | $ 21.95 | $ 45,650 |
| Northern New Mexico nonmetropolitan area | 270 | 3.50 | 3.38 | (8) | (8) |
| Southwest Louisiana nonmetropolitan area | 210 | 3.13 | 3.01 | $ 20.52 | $ 42,680 |
| Alaska nonmetropolitan area | 290 | 2.86 | 2.76 | $ 23.90 | $ 49,720 |
Top paying nonmetropolitan areas for School Bus Monitors and Protective Service Workers, All Other:
| Nonmetropolitan area | Employment (1) | Employment per thousand jobs | Location quotient (9) | Hourly mean wage | Annual mean wage (2) |
|---|---|---|---|---|---|
| Hawaii / Kauai nonmetropolitan area | 30 | 0.34 | 0.33 | $ 25.32 | $ 52,660 |
| Alaska nonmetropolitan area | 290 | 2.86 | 2.76 | $ 23.90 | $ 49,720 |
| Eastern Sierra-Mother Lode Region of California nonmetropolitan area | 200 | 3.58 | 3.45 | $ 21.95 | $ 45,650 |
| West North Dakota nonmetropolitan area | 60 | 0.50 | 0.48 | $ 21.63 | $ 44,990 |
| Northeastern Wisconsin nonmetropolitan area | 70 | 0.35 | 0.34 | $ 21.60 | $ 44,930 |
These estimates are calculated with data collected from employers in all industry sectors, all metropolitan and nonmetropolitan areas, and all states and the District of Columbia. The top employment and wage figures are provided above. The complete list is available in the downloadable XLS files.
The percentile wage estimate is the value of a wage below which a certain percent of workers fall. The median wage is the 50th percentile wage estimate—50 percent of workers earn less than the median and 50 percent of workers earn more than the median. More about percentile wages.
(1) Estimates for detailed occupations do not sum to the totals because the totals include occupations not shown separately. Estimates do not include self-employed workers.
(2) Annual wages have been calculated by multiplying the hourly mean wage by a "year-round, full-time" hours figure of 2,080 hours; for those occupations where there is not an hourly wage published, the annual wage has been directly calculated from the reported survey data.
(3) The relative standard error (RSE) is a measure of the reliability of a survey statistic. The smaller the relative standard error, the more precise the estimate.
(8) Estimate not released.
(9) The location quotient is the ratio of the area concentration of occupational employment to the national average concentration. A location quotient greater than one indicates the occupation has a higher share of employment than average, and a location quotient less than one indicates the occupation is less prevalent in the area than average.
Other OEWS estimates and related information:
May 2020 National Occupational Employment and Wage Estimates
May 2020 State Occupational Employment and Wage Estimates
May 2020 Metropolitan and Nonmetropolitan Area Occupational Employment and Wage Estimates
May 2020 National Industry-Specific Occupational Employment and Wage Estimates
Last Modified Date: March 31, 2021