
An official website of the United States government
An official website of the United States government
The .gov means it's official.
Federal government websites often end in .gov or .mil. Before sharing sensitive information,
make sure you're on a federal government site.
The site is secure.
The
https:// ensures that you are connecting to the official website and that any
information you provide is encrypted and transmitted securely.
Assess patient health problems and needs, develop and implement nursing care plans, and maintain medical records. Administer nursing care to ill, injured, convalescent, or disabled patients. May advise patients on health maintenance and disease prevention or provide case management. Licensing or registration required. Includes Clinical Nurse Specialists. Excludes "Nurse Anesthetists" (29-1151), "Nurse Midwives" (29-1161), and "Nurse Practitioners" (29-1171).
| Employment (1) | Employment RSE (3) |
Mean hourly wage |
Mean annual wage (2) |
Wage RSE (3) |
|---|---|---|---|---|
| 2,986,500 | 0.5 % | $ 38.47 | $ 80,010 | 0.4 % |
| Percentile | 10% | 25% | 50% (Median) |
75% | 90% |
|---|---|---|---|---|---|
| Hourly Wage | $ 25.68 | $ 29.63 | $ 36.22 | $ 44.99 | $ 55.88 |
| Annual Wage (2) | $ 53,410 | $ 61,630 | $ 75,330 | $ 93,590 | $ 116,230 |
Industries with the highest published employment and wages for Registered Nurses are provided. For a list of all industries with employment in Registered Nurses, see the Create Customized Tables function.
| Industry | Employment (1) | Percent of industry employment | Hourly mean wage | Annual mean wage (2) |
|---|---|---|---|---|
| General Medical and Surgical Hospitals | 1,729,200 | 30.90 | $ 39.27 | $ 81,680 |
| Offices of Physicians | 192,300 | 7.42 | $ 34.45 | $ 71,660 |
| Home Health Care Services | 169,630 | 11.35 | $ 36.48 | $ 75,870 |
| Outpatient Care Centers | 150,380 | 15.66 | $ 42.93 | $ 89,300 |
| Nursing Care Facilities (Skilled Nursing Facilities) | 143,250 | 9.34 | $ 34.66 | $ 72,090 |
| Industry | Employment (1) | Percent of industry employment | Hourly mean wage | Annual mean wage (2) |
|---|---|---|---|---|
| General Medical and Surgical Hospitals | 1,729,200 | 30.90 | $ 39.27 | $ 81,680 |
| Specialty (except Psychiatric and Substance Abuse) Hospitals | 63,910 | 23.93 | $ 39.86 | $ 82,910 |
| Psychiatric and Substance Abuse Hospitals | 39,840 | 16.47 | $ 37.14 | $ 77,250 |
| Outpatient Care Centers | 150,380 | 15.66 | $ 42.93 | $ 89,300 |
| Home Health Care Services | 169,630 | 11.35 | $ 36.48 | $ 75,870 |
| Industry | Employment (1) | Percent of industry employment | Hourly mean wage | Annual mean wage (2) |
|---|---|---|---|---|
| Business Support Services | 560 | 0.07 | $ 51.28 | $ 106,670 |
| Federal Executive Branch (OEWS Designation) | 86,860 | 4.17 | $ 46.26 | $ 96,230 |
| Pharmaceutical and Medicine Manufacturing | 340 | 0.11 | $ 44.29 | $ 92,110 |
| Other Investment Pools and Funds | 100 | 0.92 | $ 44.23 | $ 91,990 |
| Office Administrative Services | (8) | (8) | $ 43.02 | $ 89,490 |
States and areas with the highest published employment, location quotients, and wages for Registered Nurses are provided. For a list of all areas with employment in Registered Nurses, see the Create Customized Tables function.
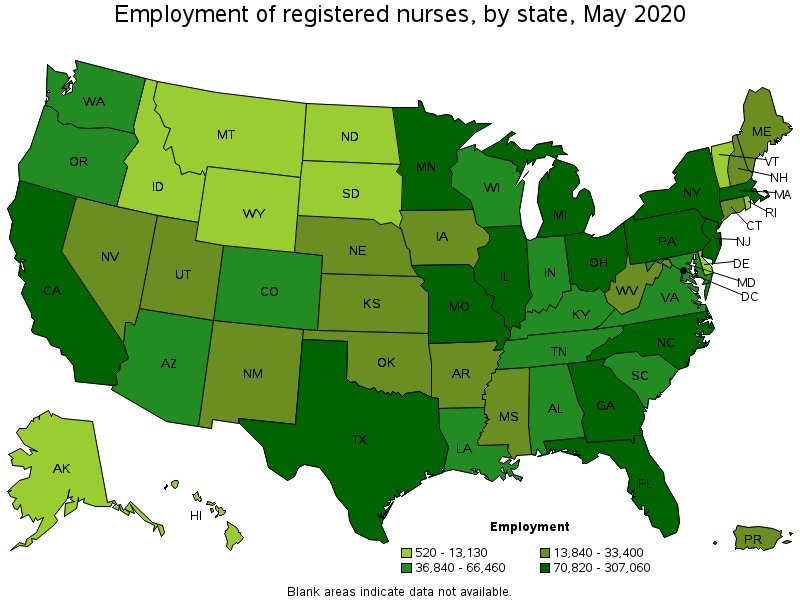
| State | Employment (1) | Employment per thousand jobs | Location quotient (9) | Hourly mean wage | Annual mean wage (2) |
|---|---|---|---|---|---|
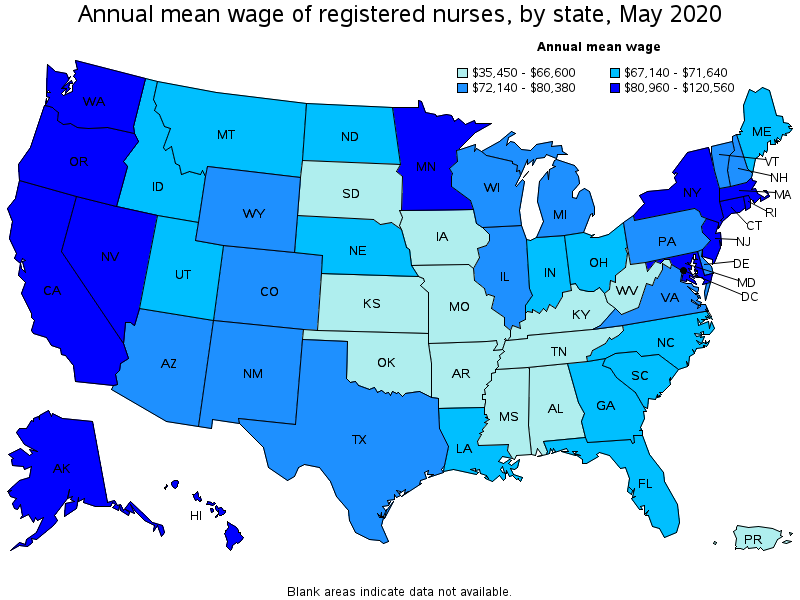
| California | 307,060 | 18.69 | 0.87 | $ 57.96 | $ 120,560 |
| Texas | 219,330 | 18.12 | 0.84 | $ 36.92 | $ 76,800 |
| Florida | 183,130 | 21.69 | 1.01 | $ 33.42 | $ 69,510 |
| New York | 178,550 | 20.54 | 0.96 | $ 43.16 | $ 89,760 |
| Pennsylvania | 146,640 | 26.60 | 1.24 | $ 35.66 | $ 74,170 |
| State | Employment (1) | Employment per thousand jobs | Location quotient (9) | Hourly mean wage | Annual mean wage (2) |
|---|---|---|---|---|---|
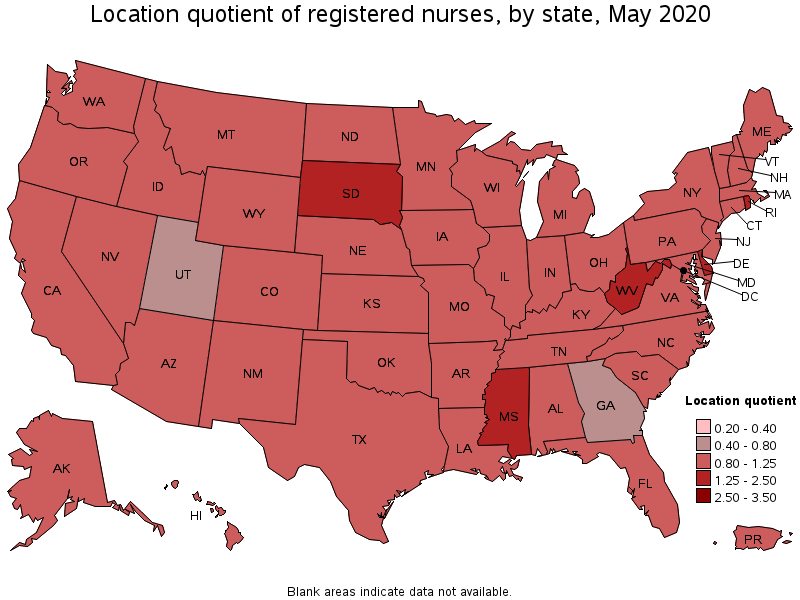
| South Dakota | 13,130 | 31.93 | 1.49 | $ 29.31 | $ 60,960 |
| West Virginia | 19,800 | 30.46 | 1.42 | $ 31.31 | $ 65,130 |
| Rhode Island | 12,150 | 27.42 | 1.28 | $ 39.81 | $ 82,790 |
| Delaware | 11,410 | 26.77 | 1.25 | $ 35.74 | $ 74,330 |
| Mississippi | 28,800 | 26.74 | 1.25 | $ 29.45 | $ 61,250 |
| State | Employment (1) | Employment per thousand jobs | Location quotient (9) | Hourly mean wage | Annual mean wage (2) |
|---|---|---|---|---|---|
| California | 307,060 | 18.69 | 0.87 | $ 57.96 | $ 120,560 |
| Hawaii | 11,260 | 19.62 | 0.91 | $ 50.40 | $ 104,830 |
| Massachusetts | 84,030 | 25.08 | 1.17 | $ 46.27 | $ 96,250 |
| Oregon | 36,840 | 20.39 | 0.95 | $ 46.27 | $ 96,230 |
| Alaska | 6,240 | 21.05 | 0.98 | $ 45.81 | $ 95,270 |
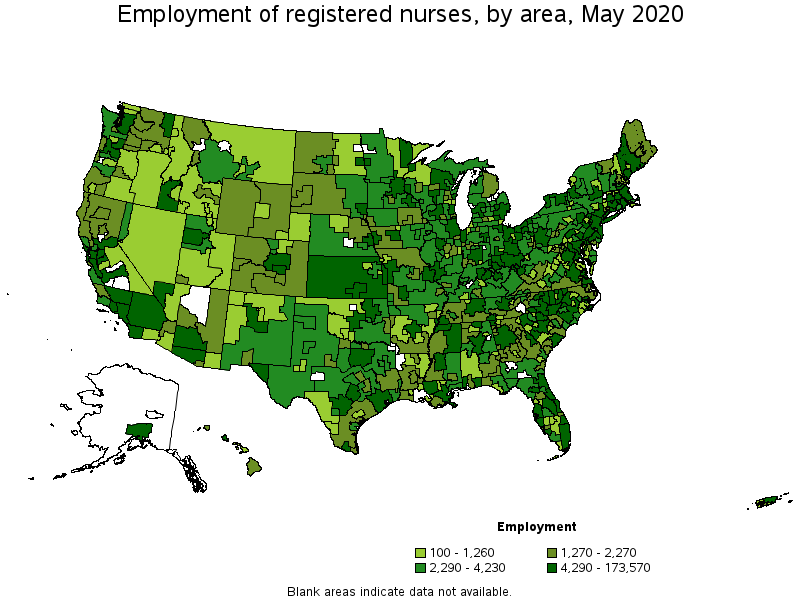
Metropolitan areas with the highest employment level in Registered Nurses:
| Metropolitan area | Employment (1) | Employment per thousand jobs | Location quotient (9) | Hourly mean wage | Annual mean wage (2) |
|---|---|---|---|---|---|
| New York-Newark-Jersey City, NY-NJ-PA | 173,570 | 19.65 | 0.92 | $ 45.63 | $ 94,920 |
| Los Angeles-Long Beach-Anaheim, CA | 109,790 | 18.86 | 0.88 | $ 54.38 | $ 113,120 |
| Chicago-Naperville-Elgin, IL-IN-WI | 95,730 | 21.95 | 1.02 | $ 37.48 | $ 77,970 |
| Philadelphia-Camden-Wilmington, PA-NJ-DE-MD | 70,350 | 26.09 | 1.21 | $ 38.45 | $ 79,980 |
| Boston-Cambridge-Nashua, MA-NH | 62,260 | 23.93 | 1.11 | $ 47.79 | $ 99,410 |
| Dallas-Fort Worth-Arlington, TX | 60,140 | 16.76 | 0.78 | $ 37.50 | $ 77,990 |
| Houston-The Woodlands-Sugar Land, TX | 56,520 | 19.04 | 0.89 | $ 40.85 | $ 84,960 |
| Miami-Fort Lauderdale-West Palm Beach, FL | 53,900 | 21.49 | 1.00 | $ 34.76 | $ 72,300 |
| Detroit-Warren-Dearborn, MI | 43,250 | 24.31 | 1.13 | $ 36.64 | $ 76,210 |
| Washington-Arlington-Alexandria, DC-VA-MD-WV | 42,820 | 14.17 | 0.66 | $ 40.14 | $ 83,490 |
| Metropolitan area | Employment (1) | Employment per thousand jobs | Location quotient (9) | Hourly mean wage | Annual mean wage (2) |
|---|---|---|---|---|---|
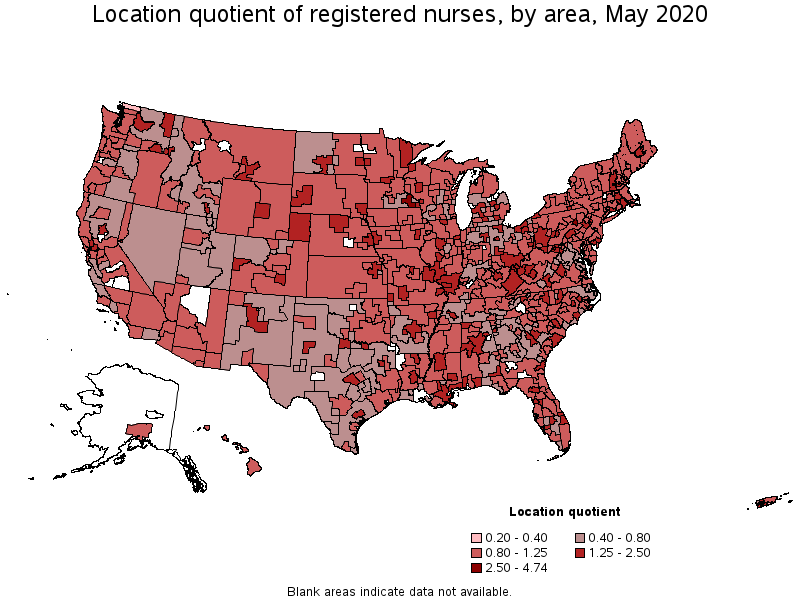
| Rochester, MN | 11,700 | 101.72 | 4.74 | $ 34.67 | $ 72,110 |
| Bloomsburg-Berwick, PA | 2,590 | 66.90 | 3.12 | $ 33.98 | $ 70,680 |
| Morgantown, WV | 3,200 | 51.66 | 2.41 | $ 32.52 | $ 67,640 |
| Greenville, NC | 3,460 | 46.91 | 2.18 | $ 32.88 | $ 68,390 |
| Ann Arbor, MI | 9,690 | 46.51 | 2.17 | $ 39.09 | $ 81,310 |
| Iowa City, IA | 4,000 | 46.25 | 2.15 | $ 33.14 | $ 68,940 |
| Sebring, FL | 1,120 | 45.49 | 2.12 | $ 32.61 | $ 67,830 |
| Sioux Falls, SD | 6,550 | 42.69 | 1.99 | $ 29.70 | $ 61,770 |
| La Crosse-Onalaska, WI-MN | 3,020 | 42.10 | 1.96 | $ 36.67 | $ 76,270 |
| Carbondale-Marion, IL | 2,120 | 42.09 | 1.96 | $ 30.64 | $ 63,740 |
| Metropolitan area | Employment (1) | Employment per thousand jobs | Location quotient (9) | Hourly mean wage | Annual mean wage (2) |
|---|---|---|---|---|---|
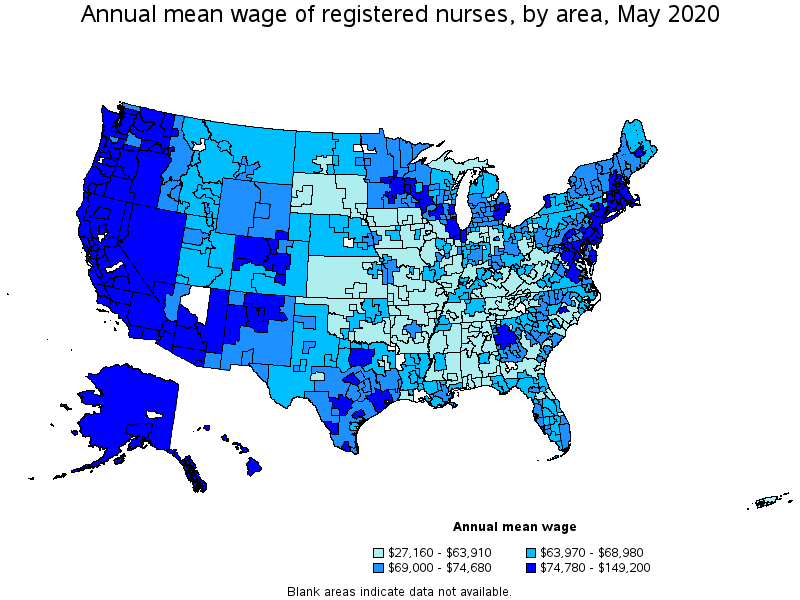
| San Francisco-Oakland-Hayward, CA | 40,600 | 17.42 | 0.81 | $ 71.73 | $ 149,200 |
| San Jose-Sunnyvale-Santa Clara, CA | 17,750 | 16.10 | 0.75 | $ 70.61 | $ 146,870 |
| Vallejo-Fairfield, CA | 3,690 | 27.76 | 1.29 | $ 68.34 | $ 142,140 |
| Sacramento--Roseville--Arden-Arcade, CA | 21,920 | 22.63 | 1.05 | $ 64.59 | $ 134,350 |
| Salinas, CA | 2,910 | 16.96 | 0.79 | $ 63.54 | $ 132,160 |
| Santa Rosa, CA | 3,640 | 18.78 | 0.87 | $ 60.02 | $ 124,840 |
| Modesto, CA | 4,720 | 26.30 | 1.23 | $ 58.21 | $ 121,090 |
| Stockton-Lodi, CA | 4,780 | 19.29 | 0.90 | $ 55.70 | $ 115,860 |
| Los Angeles-Long Beach-Anaheim, CA | 109,790 | 18.86 | 0.88 | $ 54.38 | $ 113,120 |
| Redding, CA | 1,650 | 25.66 | 1.20 | $ 53.78 | $ 111,860 |
| Nonmetropolitan area | Employment (1) | Employment per thousand jobs | Location quotient (9) | Hourly mean wage | Annual mean wage (2) |
|---|---|---|---|---|---|
| Kansas nonmetropolitan area | 7,840 | 20.73 | 0.97 | $ 28.39 | $ 59,050 |
| Piedmont North Carolina nonmetropolitan area | 5,460 | 22.22 | 1.03 | $ 31.52 | $ 65,550 |
| Northeast Mississippi nonmetropolitan area | 5,340 | 23.83 | 1.11 | $ 27.47 | $ 57,130 |
| North Northeastern Ohio nonmetropolitan area (noncontiguous) | 5,210 | 16.70 | 0.78 | $ 31.11 | $ 64,700 |
| Southwest Maine nonmetropolitan area | 4,470 | 24.48 | 1.14 | $ 33.22 | $ 69,100 |
| Nonmetropolitan area | Employment (1) | Employment per thousand jobs | Location quotient (9) | Hourly mean wage | Annual mean wage (2) |
|---|---|---|---|---|---|
| East Kentucky nonmetropolitan area | 3,080 | 32.25 | 1.50 | $ 28.40 | $ 59,080 |
| West Central-Southwest New Hampshire nonmetropolitan area | 3,010 | 30.47 | 1.42 | $ 36.21 | $ 75,310 |
| Southern Ohio nonmetropolitan area | 4,390 | 29.32 | 1.37 | $ 31.03 | $ 64,540 |
| Northwest Nebraska nonmetropolitan area | 1,090 | 29.08 | 1.35 | $ 31.65 | $ 65,830 |
| South Illinois nonmetropolitan area | 2,310 | 27.43 | 1.28 | $ 29.25 | $ 60,840 |
| Nonmetropolitan area | Employment (1) | Employment per thousand jobs | Location quotient (9) | Hourly mean wage | Annual mean wage (2) |
|---|---|---|---|---|---|
| North Valley-Northern Mountains Region of California nonmetropolitan area | 1,290 | 13.29 | 0.62 | $ 49.95 | $ 103,890 |
| Alaska nonmetropolitan area | (8) | (8) | (8) | $ 49.23 | $ 102,390 |
| Eastern Sierra-Mother Lode Region of California nonmetropolitan area | 960 | 17.50 | 0.81 | $ 48.56 | $ 101,000 |
| Hawaii / Kauai nonmetropolitan area | 1,730 | 18.66 | 0.87 | $ 47.09 | $ 97,950 |
| North Coast Region of California nonmetropolitan area | 1,830 | 18.63 | 0.87 | $ 44.60 | $ 92,760 |
These estimates are calculated with data collected from employers in all industry sectors, all metropolitan and nonmetropolitan areas, and all states and the District of Columbia. The top employment and wage figures are provided above. The complete list is available in the downloadable XLS files.
The percentile wage estimate is the value of a wage below which a certain percent of workers fall. The median wage is the 50th percentile wage estimate—50 percent of workers earn less than the median and 50 percent of workers earn more than the median. More about percentile wages.
(1) Estimates for detailed occupations do not sum to the totals because the totals include occupations not shown separately. Estimates do not include self-employed workers.
(2) Annual wages have been calculated by multiplying the hourly mean wage by a "year-round, full-time" hours figure of 2,080 hours; for those occupations where there is not an hourly wage published, the annual wage has been directly calculated from the reported survey data.
(3) The relative standard error (RSE) is a measure of the reliability of a survey statistic. The smaller the relative standard error, the more precise the estimate.
(9) The location quotient is the ratio of the area concentration of occupational employment to the national average concentration. A location quotient greater than one indicates the occupation has a higher share of employment than average, and a location quotient less than one indicates the occupation is less prevalent in the area than average.
Last Modified Date: March 31, 2021