
An official website of the United States government
An official website of the United States government
The .gov means it's official.
Federal government websites often end in .gov or .mil. Before sharing sensitive information,
make sure you're on a federal government site.
The site is secure.
The
https:// ensures that you are connecting to the official website and that any
information you provide is encrypted and transmitted securely.
This occupation includes the 2018 SOC occupations 27-4015 Lighting Technicians and 27-4099 Media and Communication Equipment Workers, All Other and the 2010 SOC occupation 27-4099 Media and Communication Equipment Workers, All Other.
Employment estimate and mean wage estimates for Lighting Technicians and Media and Communication Equipment Workers, All Other:
| Employment (1) | Employment RSE (3) |
Mean hourly wage |
Mean annual wage (2) |
Wage RSE (3) |
|---|---|---|---|---|
| 21,860 | 8.8 % | $ 36.00 | $ 74,880 | 1.6 % |
Percentile wage estimates for Lighting Technicians and Media and Communication Equipment Workers, All Other:
| Percentile | 10% | 25% | 50% (Median) |
75% | 90% |
|---|---|---|---|---|---|
| Hourly Wage | $ 14.98 | $ 21.75 | $ 34.12 | $ 47.27 | $ 59.46 |
| Annual Wage (2) | $ 31,150 | $ 45,240 | $ 70,980 | $ 98,330 | $ 123,670 |
Industries with the highest published employment and wages for Lighting Technicians and Media and Communication Equipment Workers, All Other are provided. For a list of all industries with employment in Lighting Technicians and Media and Communication Equipment Workers, All Other, see the Create Customized Tables function.
Industries with the highest levels of employment in Lighting Technicians and Media and Communication Equipment Workers, All Other:
| Industry | Employment (1) | Percent of industry employment | Hourly mean wage | Annual mean wage (2) |
|---|---|---|---|---|
| Radio and Television Broadcasting | 5,040 | 2.48 | (8) | (8) |
| Motion Picture and Video Industries | 4,290 | 1.30 | $ 40.46 | $ 84,150 |
| Federal Executive Branch (OEWS Designation) | 4,140 | 0.20 | $ 46.74 | $ 97,220 |
| Colleges, Universities, and Professional Schools | 1,310 | 0.04 | $ 31.61 | $ 65,750 |
| Rental and leasing services (5322, 5323, and 5324 only) | 460 | 0.15 | $ 25.86 | $ 53,780 |
Industries with the highest concentration of employment in Lighting Technicians and Media and Communication Equipment Workers, All Other:
| Industry | Employment (1) | Percent of industry employment | Hourly mean wage | Annual mean wage (2) |
|---|---|---|---|---|
| Radio and Television Broadcasting | 5,040 | 2.48 | (8) | (8) |
| Motion Picture and Video Industries | 4,290 | 1.30 | $ 40.46 | $ 84,150 |
| Promoters of Performing Arts, Sports, and Similar Events | 420 | 0.37 | $ 27.75 | $ 57,720 |
| Manufacturing and Reproducing Magnetic and Optical Media | 40 | 0.33 | $ 28.58 | $ 59,450 |
| Performing Arts Companies | 290 | 0.28 | $ 28.02 | $ 58,270 |
Top paying industries for Lighting Technicians and Media and Communication Equipment Workers, All Other:
| Industry | Employment (1) | Percent of industry employment | Hourly mean wage | Annual mean wage (2) |
|---|---|---|---|---|
| Federal Executive Branch (OEWS Designation) | 4,140 | 0.20 | $ 46.74 | $ 97,220 |
| Motion Picture and Video Industries | 4,290 | 1.30 | $ 40.46 | $ 84,150 |
| Scientific Research and Development Services | 40 | 0.01 | $ 37.05 | $ 77,070 |
| Management of Companies and Enterprises | 140 | 0.01 | $ 33.64 | $ 69,980 |
| Traveler Accommodation | 130 | 0.01 | $ 33.32 | $ 69,300 |
States and areas with the highest published employment, location quotients, and wages for Lighting Technicians and Media and Communication Equipment Workers, All Other are provided. For a list of all areas with employment in Lighting Technicians and Media and Communication Equipment Workers, All Other, see the Create Customized Tables function.

States with the highest employment level in Lighting Technicians and Media and Communication Equipment Workers, All Other:
| State | Employment (1) | Employment per thousand jobs | Location quotient (9) | Hourly mean wage | Annual mean wage (2) |
|---|---|---|---|---|---|
| California | 9,210 | 0.56 | 3.57 | $ 36.41 | $ 75,730 |
| Florida | 870 | 0.10 | 0.65 | $ 39.07 | $ 81,260 |
| Texas | 730 | 0.06 | 0.38 | $ 36.53 | $ 75,990 |
| Georgia | 660 | 0.15 | 0.98 | $ 31.67 | $ 65,870 |
| Maryland | 630 | 0.25 | 1.60 | $ 45.80 | $ 95,260 |

States with the highest concentration of jobs and location quotients in Lighting Technicians and Media and Communication Equipment Workers, All Other:
| State | Employment (1) | Employment per thousand jobs | Location quotient (9) | Hourly mean wage | Annual mean wage (2) |
|---|---|---|---|---|---|
| Hawaii | 330 | 0.57 | 3.62 | $ 34.91 | $ 72,620 |
| California | 9,210 | 0.56 | 3.57 | $ 36.41 | $ 75,730 |
| District of Columbia | 340 | 0.49 | 3.14 | $ 52.08 | $ 108,340 |
| Maryland | 630 | 0.25 | 1.60 | $ 45.80 | $ 95,260 |
| Nevada | 280 | 0.22 | 1.41 | $ 34.77 | $ 72,330 |

Top paying states for Lighting Technicians and Media and Communication Equipment Workers, All Other:
| State | Employment (1) | Employment per thousand jobs | Location quotient (9) | Hourly mean wage | Annual mean wage (2) |
|---|---|---|---|---|---|
| District of Columbia | 340 | 0.49 | 3.14 | $ 52.08 | $ 108,340 |
| Virginia | 470 | 0.13 | 0.81 | $ 45.91 | $ 95,500 |
| Maryland | 630 | 0.25 | 1.60 | $ 45.80 | $ 95,260 |
| Pennsylvania | (8) | (8) | (8) | $ 41.49 | $ 86,300 |
| Massachusetts | 140 | 0.04 | 0.27 | $ 40.57 | $ 84,380 |
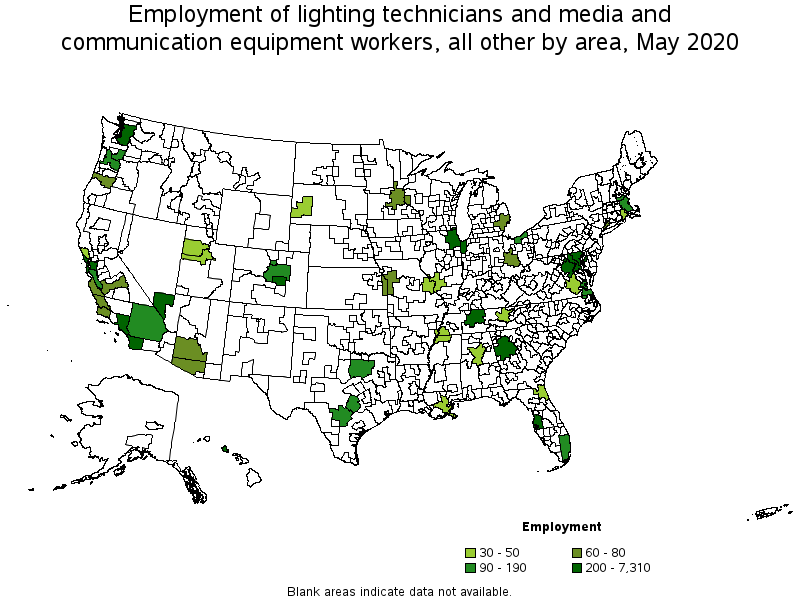
Metropolitan areas with the highest employment level in Lighting Technicians and Media and Communication Equipment Workers, All Other:
| Metropolitan area | Employment (1) | Employment per thousand jobs | Location quotient (9) | Hourly mean wage | Annual mean wage (2) |
|---|---|---|---|---|---|
| Los Angeles-Long Beach-Anaheim, CA | 7,310 | 1.26 | 7.99 | $ 37.16 | $ 77,290 |
| Washington-Arlington-Alexandria, DC-VA-MD-WV | 740 | 0.24 | 1.55 | $ 50.67 | $ 105,390 |
| Atlanta-Sandy Springs-Roswell, GA | 500 | 0.19 | 1.20 | $ 30.56 | $ 63,560 |
| San Francisco-Oakland-Hayward, CA | 450 | 0.19 | 1.23 | $ 33.84 | $ 70,380 |
| Baltimore-Columbia-Towson, MD | 390 | 0.30 | 1.92 | $ 45.54 | $ 94,720 |
| San Diego-Carlsbad, CA | 360 | 0.25 | 1.61 | $ 31.35 | $ 65,200 |
| Nashville-Davidson--Murfreesboro--Franklin, TN | 330 | 0.34 | 2.15 | $ 29.08 | $ 60,490 |
| Urban Honolulu, HI | 300 | 0.73 | 4.65 | $ 35.83 | $ 74,530 |
| Las Vegas-Henderson-Paradise, NV | 250 | 0.27 | 1.73 | $ 35.74 | $ 74,340 |
| Colorado Springs, CO | 220 | 0.79 | 5.05 | $ 44.30 | $ 92,140 |

Metropolitan areas with the highest concentration of jobs and location quotients in Lighting Technicians and Media and Communication Equipment Workers, All Other:
| Metropolitan area | Employment (1) | Employment per thousand jobs | Location quotient (9) | Hourly mean wage | Annual mean wage (2) |
|---|---|---|---|---|---|
| Los Angeles-Long Beach-Anaheim, CA | 7,310 | 1.26 | 7.99 | $ 37.16 | $ 77,290 |
| Colorado Springs, CO | 220 | 0.79 | 5.05 | $ 44.30 | $ 92,140 |
| Urban Honolulu, HI | 300 | 0.73 | 4.65 | $ 35.83 | $ 74,530 |
| San Luis Obispo-Paso Robles-Arroyo Grande, CA | 80 | 0.69 | 4.41 | $ 36.50 | $ 75,930 |
| Rapid City, SD | 30 | 0.54 | 3.46 | $ 20.77 | $ 43,200 |
| Boulder, CO | 90 | 0.49 | 3.09 | $ 24.96 | $ 51,920 |
| Santa Maria-Santa Barbara, CA | 80 | 0.46 | 2.94 | $ 40.24 | $ 83,700 |
| Eugene, OR | 60 | 0.38 | 2.40 | $ 20.51 | $ 42,650 |
| Salinas, CA | 60 | 0.36 | 2.26 | $ 46.89 | $ 97,530 |
| Nashville-Davidson--Murfreesboro--Franklin, TN | 330 | 0.34 | 2.15 | $ 29.08 | $ 60,490 |

Top paying metropolitan areas for Lighting Technicians and Media and Communication Equipment Workers, All Other:
| Metropolitan area | Employment (1) | Employment per thousand jobs | Location quotient (9) | Hourly mean wage | Annual mean wage (2) |
|---|---|---|---|---|---|
| Washington-Arlington-Alexandria, DC-VA-MD-WV | 740 | 0.24 | 1.55 | $ 50.67 | $ 105,390 |
| Salinas, CA | 60 | 0.36 | 2.26 | $ 46.89 | $ 97,530 |
| Baltimore-Columbia-Towson, MD | 390 | 0.30 | 1.92 | $ 45.54 | $ 94,720 |
| St. Louis, MO-IL | 50 | 0.04 | 0.26 | $ 45.32 | $ 94,260 |
| Colorado Springs, CO | 220 | 0.79 | 5.05 | $ 44.30 | $ 92,140 |
| Orlando-Kissimmee-Sanford, FL | (8) | (8) | (8) | $ 43.32 | $ 90,110 |
| Houston-The Woodlands-Sugar Land, TX | (8) | (8) | (8) | $ 42.82 | $ 89,060 |
| Bakersfield, CA | (8) | (8) | (8) | $ 41.94 | $ 87,240 |
| Philadelphia-Camden-Wilmington, PA-NJ-DE-MD | (8) | (8) | (8) | $ 41.59 | $ 86,500 |
| New Haven, CT | (8) | (8) | (8) | $ 40.99 | $ 85,260 |
These estimates are calculated with data collected from employers in all industry sectors, all metropolitan and nonmetropolitan areas, and all states and the District of Columbia. The top employment and wage figures are provided above. The complete list is available in the downloadable XLS files.
The percentile wage estimate is the value of a wage below which a certain percent of workers fall. The median wage is the 50th percentile wage estimate—50 percent of workers earn less than the median and 50 percent of workers earn more than the median. More about percentile wages.
(1) Estimates for detailed occupations do not sum to the totals because the totals include occupations not shown separately. Estimates do not include self-employed workers.
(2) Annual wages have been calculated by multiplying the hourly mean wage by a "year-round, full-time" hours figure of 2,080 hours; for those occupations where there is not an hourly wage published, the annual wage has been directly calculated from the reported survey data.
(3) The relative standard error (RSE) is a measure of the reliability of a survey statistic. The smaller the relative standard error, the more precise the estimate.
(8) Estimate not released.
(9) The location quotient is the ratio of the area concentration of occupational employment to the national average concentration. A location quotient greater than one indicates the occupation has a higher share of employment than average, and a location quotient less than one indicates the occupation is less prevalent in the area than average.
Other OEWS estimates and related information:
May 2020 National Occupational Employment and Wage Estimates
May 2020 State Occupational Employment and Wage Estimates
May 2020 Metropolitan and Nonmetropolitan Area Occupational Employment and Wage Estimates
May 2020 National Industry-Specific Occupational Employment and Wage Estimates
Last Modified Date: March 31, 2021