
An official website of the United States government
An official website of the United States government
The .gov means it's official.
Federal government websites often end in .gov or .mil. Before sharing sensitive information,
make sure you're on a federal government site.
The site is secure.
The
https:// ensures that you are connecting to the official website and that any
information you provide is encrypted and transmitted securely.
Prepare tax returns for individuals or small businesses. Excludes "Accountants and Auditors" (13-2011).
Employment estimate and mean wage estimates for Tax Preparers:
| Employment (1) | Employment RSE (3) |
Mean hourly wage |
Mean annual wage (2) |
Wage RSE (3) |
|---|---|---|---|---|
| 62,600 | 2.9 % | $ 25.34 | $ 52,710 | 2.2 % |
Percentile wage estimates for Tax Preparers:
| Percentile | 10% | 25% | 50% (Median) |
75% | 90% |
|---|---|---|---|---|---|
| Hourly Wage | $ 10.62 | $ 14.09 | $ 21.30 | $ 31.71 | $ 44.97 |
| Annual Wage (2) | $ 22,090 | $ 29,310 | $ 44,300 | $ 65,960 | $ 93,540 |
Industries with the highest published employment and wages for Tax Preparers are provided. For a list of all industries with employment in Tax Preparers, see the Create Customized Tables function.
Industries with the highest levels of employment in Tax Preparers:
| Industry | Employment (1) | Percent of industry employment | Hourly mean wage | Annual mean wage (2) |
|---|---|---|---|---|
| Accounting, Tax Preparation, Bookkeeping, and Payroll Services | 59,950 | 6.12 | $ 25.12 | $ 52,240 |
| Management, Scientific, and Technical Consulting Services | 730 | 0.05 | $ 27.08 | $ 56,320 |
| Securities, Commodity Contracts, and Other Financial Investments and Related Activities | 470 | 0.05 | (8) | (8) |
| Management of Companies and Enterprises | 110 | 0.00 | $ 30.86 | $ 64,200 |
| Employment Services | 110 | 0.00 | $ 29.99 | $ 62,370 |
Industries with the highest concentration of employment in Tax Preparers:
| Industry | Employment (1) | Percent of industry employment | Hourly mean wage | Annual mean wage (2) |
|---|---|---|---|---|
| Accounting, Tax Preparation, Bookkeeping, and Payroll Services | 59,950 | 6.12 | $ 25.12 | $ 52,240 |
| Securities, Commodity Contracts, and Other Financial Investments and Related Activities | 470 | 0.05 | (8) | (8) |
| Management, Scientific, and Technical Consulting Services | 730 | 0.05 | $ 27.08 | $ 56,320 |
| Office Administrative Services | 80 | 0.02 | $ 30.69 | $ 63,830 |
| Professional and Commercial Equipment and Supplies Merchant Wholesalers | 50 | 0.01 | $ 25.31 | $ 52,650 |
Top paying industries for Tax Preparers:
| Industry | Employment (1) | Percent of industry employment | Hourly mean wage | Annual mean wage (2) |
|---|---|---|---|---|
| Legal Services | (8) | (8) | $ 38.03 | $ 79,100 |
| Management of Companies and Enterprises | 110 | (7) | $ 30.86 | $ 64,200 |
| Office Administrative Services | 80 | 0.02 | $ 30.69 | $ 63,830 |
| Employment Services | 110 | (7) | $ 29.99 | $ 62,370 |
| Computer Systems Design and Related Services | 60 | (7) | $ 27.36 | $ 56,900 |
States and areas with the highest published employment, location quotients, and wages for Tax Preparers are provided. For a list of all areas with employment in Tax Preparers, see the Create Customized Tables function.
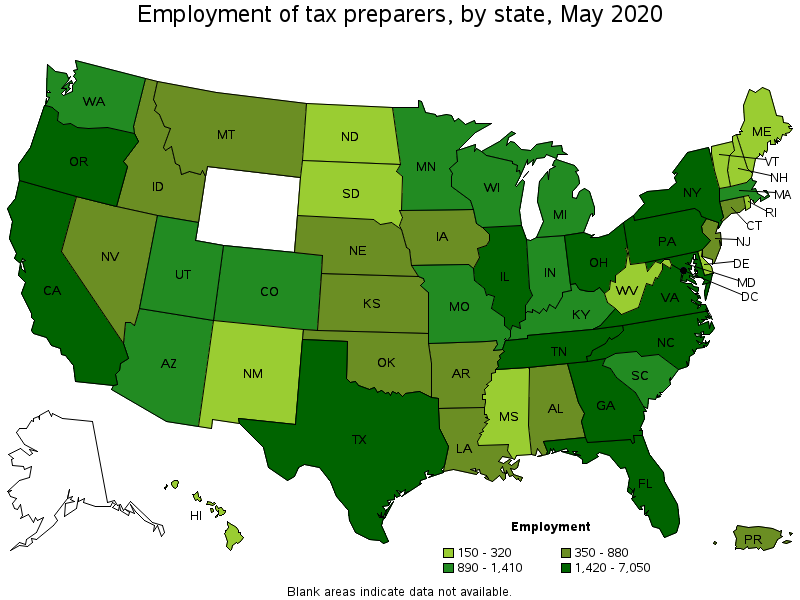
States with the highest employment level in Tax Preparers:
| State | Employment (1) | Employment per thousand jobs | Location quotient (9) | Hourly mean wage | Annual mean wage (2) |
|---|---|---|---|---|---|
| California | 7,050 | 0.43 | 0.95 | $ 30.18 | $ 62,770 |
| Florida | 5,250 | 0.62 | 1.38 | $ 22.65 | $ 47,100 |
| Texas | 5,070 | 0.42 | 0.93 | $ 35.33 | $ 73,480 |
| New York | 3,940 | 0.45 | 1.01 | $ 33.31 | $ 69,280 |
| Illinois | 2,720 | 0.48 | 1.08 | $ 21.99 | $ 45,750 |

States with the highest concentration of jobs and location quotients in Tax Preparers:
| State | Employment (1) | Employment per thousand jobs | Location quotient (9) | Hourly mean wage | Annual mean wage (2) |
|---|---|---|---|---|---|
| Tennessee | 2,660 | 0.92 | 2.04 | $ 23.12 | $ 48,100 |
| Montana | 380 | 0.83 | 1.85 | $ 19.46 | $ 40,470 |
| Oregon | 1,420 | 0.78 | 1.74 | $ 25.14 | $ 52,290 |
| South Dakota | 320 | 0.78 | 1.74 | $ 18.56 | $ 38,610 |
| Maryland | 1,760 | 0.70 | 1.55 | $ 22.99 | $ 47,810 |

Top paying states for Tax Preparers:
| State | Employment (1) | Employment per thousand jobs | Location quotient (9) | Hourly mean wage | Annual mean wage (2) |
|---|---|---|---|---|---|
| Texas | 5,070 | 0.42 | 0.93 | $ 35.33 | $ 73,480 |
| Alaska | (8) | (8) | (8) | $ 34.35 | $ 71,450 |
| New York | 3,940 | 0.45 | 1.01 | $ 33.31 | $ 69,280 |
| Rhode Island | 260 | 0.59 | 1.31 | $ 32.65 | $ 67,910 |
| Massachusetts | 990 | 0.29 | 0.66 | $ 30.83 | $ 64,120 |

Metropolitan areas with the highest employment level in Tax Preparers:
| Metropolitan area | Employment (1) | Employment per thousand jobs | Location quotient (9) | Hourly mean wage | Annual mean wage (2) |
|---|---|---|---|---|---|
| New York-Newark-Jersey City, NY-NJ-PA | 4,010 | 0.45 | 1.01 | $ 33.30 | $ 69,270 |
| Los Angeles-Long Beach-Anaheim, CA | 2,670 | 0.46 | 1.02 | $ 30.78 | $ 64,030 |
| Chicago-Naperville-Elgin, IL-IN-WI | 2,100 | 0.48 | 1.07 | $ 21.55 | $ 44,820 |
| Miami-Fort Lauderdale-West Palm Beach, FL | 2,080 | 0.83 | 1.84 | $ 21.21 | $ 44,110 |
| Washington-Arlington-Alexandria, DC-VA-MD-WV | 2,020 | 0.67 | 1.49 | $ 24.50 | $ 50,950 |
| Dallas-Fort Worth-Arlington, TX | 1,750 | 0.49 | 1.08 | (8) | (8) |
| Nashville-Davidson--Murfreesboro--Franklin, TN | 1,400 | 1.45 | 3.22 | $ 26.56 | $ 55,240 |
| Atlanta-Sandy Springs-Roswell, GA | 1,070 | 0.41 | 0.90 | $ 26.95 | $ 56,060 |
| Minneapolis-St. Paul-Bloomington, MN-WI | 1,060 | 0.57 | 1.28 | $ 26.54 | $ 55,190 |
| Phoenix-Mesa-Scottsdale, AZ | 1,000 | 0.47 | 1.05 | $ 26.72 | $ 55,580 |

Metropolitan areas with the highest concentration of jobs and location quotients in Tax Preparers:
| Metropolitan area | Employment (1) | Employment per thousand jobs | Location quotient (9) | Hourly mean wage | Annual mean wage (2) |
|---|---|---|---|---|---|
| Grants Pass, OR | 40 | 1.65 | 3.66 | $ 17.18 | $ 35,730 |
| Rapid City, SD | 100 | 1.62 | 3.59 | $ 18.67 | $ 38,840 |
| Salisbury, MD-DE | 230 | 1.58 | 3.50 | $ 19.34 | $ 40,220 |
| Nashville-Davidson--Murfreesboro--Franklin, TN | 1,400 | 1.45 | 3.22 | $ 26.56 | $ 55,240 |
| Eugene, OR | 210 | 1.40 | 3.11 | $ 24.80 | $ 51,580 |
| San Angelo, TX | 60 | 1.35 | 3.00 | $ 26.11 | $ 54,310 |
| Racine, WI | 100 | 1.34 | 2.98 | $ 18.68 | $ 38,850 |
| Jacksonville, NC | 60 | 1.31 | 2.91 | $ 13.72 | $ 28,530 |
| El Centro, CA | 70 | 1.30 | 2.89 | $ 14.83 | $ 30,850 |
| Twin Falls, ID | 60 | 1.30 | 2.89 | $ 20.68 | $ 43,010 |

Top paying metropolitan areas for Tax Preparers:
| Metropolitan area | Employment (1) | Employment per thousand jobs | Location quotient (9) | Hourly mean wage | Annual mean wage (2) |
|---|---|---|---|---|---|
| San Jose-Sunnyvale-Santa Clara, CA | 510 | 0.46 | 1.03 | $ 47.67 | $ 99,160 |
| College Station-Bryan, TX | (8) | (8) | (8) | $ 38.74 | $ 80,580 |
| Anchorage, AK | (8) | (8) | (8) | $ 37.73 | $ 78,470 |
| Denver-Aurora-Lakewood, CO | 560 | 0.38 | 0.85 | $ 34.61 | $ 71,990 |
| Hartford-West Hartford-East Hartford, CT | 100 | 0.17 | 0.39 | $ 34.61 | $ 71,990 |
| Albany, OR | (8) | (8) | (8) | $ 33.99 | $ 70,690 |
| New York-Newark-Jersey City, NY-NJ-PA | 4,010 | 0.45 | 1.01 | $ 33.30 | $ 69,270 |
| Stockton-Lodi, CA | 50 | 0.20 | 0.45 | $ 33.30 | $ 69,260 |
| Santa Cruz-Watsonville, CA | 60 | 0.70 | 1.56 | $ 33.16 | $ 68,970 |
| San Antonio-New Braunfels, TX | 240 | 0.24 | 0.53 | $ 32.74 | $ 68,090 |
Nonmetropolitan areas with the highest employment in Tax Preparers:
| Nonmetropolitan area | Employment (1) | Employment per thousand jobs | Location quotient (9) | Hourly mean wage | Annual mean wage (2) |
|---|---|---|---|---|---|
| South Central Kentucky nonmetropolitan area | 190 | 1.17 | 2.59 | (8) | (8) |
| Piedmont North Carolina nonmetropolitan area | 190 | 0.75 | 1.67 | $ 14.75 | $ 30,680 |
| Southwest Montana nonmetropolitan area | 180 | 1.31 | 2.90 | $ 16.65 | $ 34,630 |
| Southeast Oklahoma nonmetropolitan area | 170 | 1.05 | 2.33 | $ 15.10 | $ 31,410 |
| South Nebraska nonmetropolitan area | 160 | 1.08 | 2.40 | $ 16.21 | $ 33,720 |
Nonmetropolitan areas with the highest concentration of jobs and location quotients in Tax Preparers:
| Nonmetropolitan area | Employment (1) | Employment per thousand jobs | Location quotient (9) | Hourly mean wage | Annual mean wage (2) |
|---|---|---|---|---|---|
| East Kentucky nonmetropolitan area | 140 | 1.47 | 3.27 | $ 9.77 | $ 20,320 |
| East Arkansas nonmetropolitan area | 90 | 1.43 | 3.18 | $ 15.24 | $ 31,700 |
| Coast Oregon nonmetropolitan area | 150 | 1.37 | 3.05 | $ 19.09 | $ 39,700 |
| Southwest Montana nonmetropolitan area | 180 | 1.31 | 2.90 | $ 16.65 | $ 34,630 |
| Eastern Utah nonmetropolitan area | 90 | 1.23 | 2.72 | $ 16.89 | $ 35,130 |
Top paying nonmetropolitan areas for Tax Preparers:
| Nonmetropolitan area | Employment (1) | Employment per thousand jobs | Location quotient (9) | Hourly mean wage | Annual mean wage (2) |
|---|---|---|---|---|---|
| West North Dakota nonmetropolitan area | 80 | 0.67 | 1.49 | $ 34.45 | $ 71,660 |
| Northwest Colorado nonmetropolitan area | 40 | 0.39 | 0.86 | $ 31.58 | $ 65,690 |
| South Central Wisconsin nonmetropolitan area | 50 | 0.27 | 0.59 | $ 28.32 | $ 58,900 |
| East Georgia nonmetropolitan area | (8) | (8) | (8) | $ 27.87 | $ 57,970 |
| North Valley-Northern Mountains Region of California nonmetropolitan area | (8) | (8) | (8) | $ 27.25 | $ 56,690 |
These estimates are calculated with data collected from employers in all industry sectors, all metropolitan and nonmetropolitan areas, and all states and the District of Columbia. The top employment and wage figures are provided above. The complete list is available in the downloadable XLS files.
The percentile wage estimate is the value of a wage below which a certain percent of workers fall. The median wage is the 50th percentile wage estimate—50 percent of workers earn less than the median and 50 percent of workers earn more than the median. More about percentile wages.
(1) Estimates for detailed occupations do not sum to the totals because the totals include occupations not shown separately. Estimates do not include self-employed workers.
(2) Annual wages have been calculated by multiplying the hourly mean wage by a "year-round, full-time" hours figure of 2,080 hours; for those occupations where there is not an hourly wage published, the annual wage has been directly calculated from the reported survey data.
(3) The relative standard error (RSE) is a measure of the reliability of a survey statistic. The smaller the relative standard error, the more precise the estimate.
(7) The value is less than .005 percent of industry employment.
(8) Estimate not released.
(9) The location quotient is the ratio of the area concentration of occupational employment to the national average concentration. A location quotient greater than one indicates the occupation has a higher share of employment than average, and a location quotient less than one indicates the occupation is less prevalent in the area than average.
Other OEWS estimates and related information:
May 2020 National Occupational Employment and Wage Estimates
May 2020 State Occupational Employment and Wage Estimates
May 2020 Metropolitan and Nonmetropolitan Area Occupational Employment and Wage Estimates
May 2020 National Industry-Specific Occupational Employment and Wage Estimates
Last Modified Date: March 31, 2021