
An official website of the United States government
An official website of the United States government
The .gov means it's official.
Federal government websites often end in .gov or .mil. Before sharing sensitive information,
make sure you're on a federal government site.
The site is secure.
The
https:// ensures that you are connecting to the official website and that any
information you provide is encrypted and transmitted securely.
Perform engineering duties in designing, constructing, and testing aircraft, missiles, and spacecraft. May conduct basic and applied research to evaluate adaptability of materials and equipment to aircraft design and manufacture. May recommend improvements in testing equipment and techniques.
Employment estimate and mean wage estimates for this occupation:
| Employment (1) | Employment RSE (3) |
Mean hourly wage |
Mean annual wage (2) |
Wage RSE (3) |
|---|---|---|---|---|
| 63,200 | 3.4 % | $57.32 | $119,220 | 0.8 % |
Percentile wage estimates for this occupation:
| Percentile | 10% | 25% | 50% (Median) |
75% | 90% |
|---|---|---|---|---|---|
| Hourly Wage | $34.83 | $43.86 | $56.01 | $69.97 | $80.11 |
| Annual Wage (2) | $72,450 | $91,240 | $116,500 | $145,530 | $166,620 |
Industries with the highest published employment and wages for this occupation are provided. For a list of all industries with employment in this occupation, see the Create Customized Tables function.
Industries with the highest levels of employment in this occupation:
| Industry | Employment (1) | Percent of industry employment | Hourly mean wage | Annual mean wage (2) |
|---|---|---|---|---|
| Aerospace Product and Parts Manufacturing | 22,980 | 4.41 | $56.86 | $118,260 |
| Architectural, Engineering, and Related Services | 10,340 | 0.69 | $58.44 | $121,560 |
| Federal Executive Branch (OES Designation) | 9,390 | 0.47 | $57.23 | $119,040 |
| Navigational, Measuring, Electromedical, and Control Instruments Manufacturing | 6,300 | 1.55 | $60.08 | $124,960 |
| Scientific Research and Development Services | 4,840 | 0.68 | $61.44 | $127,800 |
Industries with the highest concentration of employment in this occupation:
| Industry | Employment (1) | Percent of industry employment | Hourly mean wage | Annual mean wage (2) |
|---|---|---|---|---|
| Aerospace Product and Parts Manufacturing | 22,980 | 4.41 | $56.86 | $118,260 |
| Navigational, Measuring, Electromedical, and Control Instruments Manufacturing | 6,300 | 1.55 | $60.08 | $124,960 |
| Architectural, Engineering, and Related Services | 10,340 | 0.69 | $58.44 | $121,560 |
| Scientific Research and Development Services | 4,840 | 0.68 | $61.44 | $127,800 |
| Support Activities for Air Transportation | 1,510 | 0.66 | $48.46 | $100,800 |
Top paying industries for this occupation:
| Industry | Employment (1) | Percent of industry employment | Hourly mean wage | Annual mean wage (2) |
|---|---|---|---|---|
| Technical and Trade Schools | 170 | 0.13 | $62.89 | $130,810 |
| Scientific Research and Development Services | 4,840 | 0.68 | $61.44 | $127,800 |
| Fabricated Metal Product Manufacturing (3321, 3322, 3325, 3326, and 3329 only) | 130 | 0.03 | $60.14 | $125,100 |
| Navigational, Measuring, Electromedical, and Control Instruments Manufacturing | 6,300 | 1.55 | $60.08 | $124,960 |
| Management of Companies and Enterprises | 1,440 | 0.06 | $58.51 | $121,690 |
States and areas with the highest published employment, location quotients, and wages for this occupation are provided. For a list of all areas with employment in this occupation, see the Create Customized Tables function.
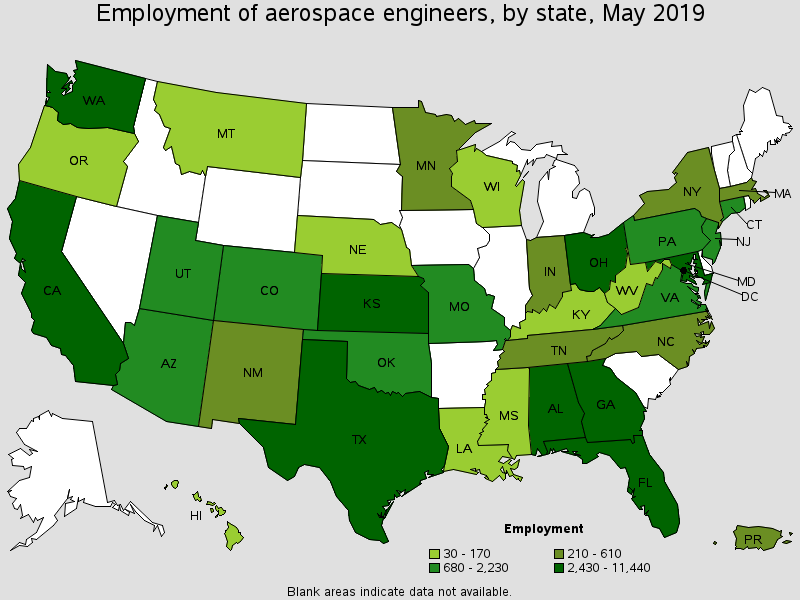
States with the highest employment level in this occupation:
| State | Employment (1) | Employment per thousand jobs | Location quotient (9) | Hourly mean wage | Annual mean wage (2) |
|---|---|---|---|---|---|
| California | 11,440 | 0.66 | 1.53 | $60.09 | $125,000 |
| Washington | 6,680 | 2.01 | 4.68 | (8) | (8) |
| Texas | 6,140 | 0.49 | 1.15 | $60.93 | $126,740 |
| Alabama | 4,070 | 2.06 | 4.79 | $57.64 | $119,890 |
| Ohio | 3,810 | 0.70 | 1.63 | $56.03 | $116,540 |

States with the highest concentration of jobs and location quotients in this occupation:
| State | Employment (1) | Employment per thousand jobs | Location quotient (9) | Hourly mean wage | Annual mean wage (2) |
|---|---|---|---|---|---|
| Alabama | 4,070 | 2.06 | 4.79 | $57.64 | $119,890 |
| Washington | 6,680 | 2.01 | 4.68 | (8) | (8) |
| Kansas | 2,450 | 1.76 | 4.08 | $51.11 | $106,300 |
| Maryland | 2,810 | 1.04 | 2.41 | $65.10 | $135,400 |
| Oklahoma | 1,660 | 1.03 | 2.38 | $47.33 | $98,450 |
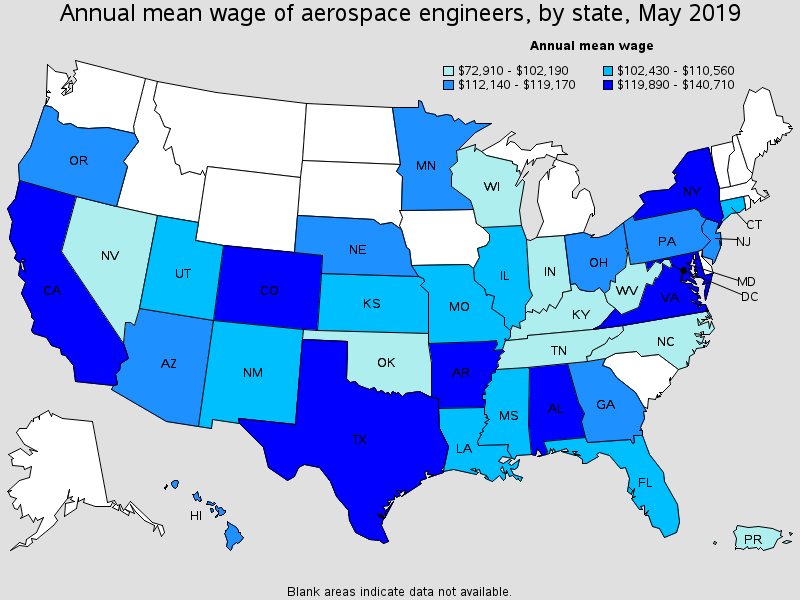
Top paying States for this occupation:
| State | Employment (1) | Employment per thousand jobs | Location quotient (9) | Hourly mean wage | Annual mean wage (2) |
|---|---|---|---|---|---|
| District of Columbia | 330 | 0.46 | 1.07 | $67.65 | $140,710 |
| Maryland | 2,810 | 1.04 | 2.41 | $65.10 | $135,400 |
| Texas | 6,140 | 0.49 | 1.15 | $60.93 | $126,740 |
| Colorado | 2,230 | 0.83 | 1.94 | $60.13 | $125,070 |
| California | 11,440 | 0.66 | 1.53 | $60.09 | $125,000 |

Metropolitan areas with the highest employment level in this occupation:
| Metropolitan area | Employment (1) | Employment per thousand jobs | Location quotient (9) | Hourly mean wage | Annual mean wage (2) |
|---|---|---|---|---|---|
| Los Angeles-Long Beach-Anaheim, CA | 4,620 | 0.74 | 1.72 | $62.81 | $130,640 |
| Huntsville, AL | 3,300 | 14.17 | 32.94 | $56.74 | $118,020 |
| Dallas-Fort Worth-Arlington, TX | 3,150 | 0.86 | 2.00 | $61.88 | $128,710 |
| Philadelphia-Camden-Wilmington, PA-NJ-DE-MD | 3,040 | 1.06 | 2.45 | $56.21 | $116,920 |
| Washington-Arlington-Alexandria, DC-VA-MD-WV | 2,270 | 0.72 | 1.66 | $69.27 | $144,090 |
| San Diego-Carlsbad, CA | 1,990 | 1.33 | 3.09 | $50.83 | $105,730 |
| Wichita, KS | 1,980 | 6.52 | 15.14 | $51.48 | $107,080 |
| Houston-The Woodlands-Sugar Land, TX | 1,770 | 0.58 | 1.34 | $61.77 | $128,480 |
| Cincinnati, OH-KY-IN | 1,410 | 1.30 | 3.03 | $55.54 | $115,520 |
| Phoenix-Mesa-Scottsdale, AZ | 1,400 | 0.66 | 1.54 | $54.66 | $113,700 |

Metropolitan areas with the highest concentration of jobs and location quotients in this occupation:
| Metropolitan area | Employment (1) | Employment per thousand jobs | Location quotient (9) | Hourly mean wage | Annual mean wage (2) |
|---|---|---|---|---|---|
| California-Lexington Park, MD | 940 | 19.71 | 45.79 | $55.62 | $115,700 |
| Huntsville, AL | 3,300 | 14.17 | 32.94 | $56.74 | $118,020 |
| Wichita, KS | 1,980 | 6.52 | 15.14 | $51.48 | $107,080 |
| Palm Bay-Melbourne-Titusville, FL | 990 | 4.42 | 10.27 | $59.24 | $123,220 |
| Boulder, CO | 760 | 4.11 | 9.55 | $62.93 | $130,890 |
| Dayton, OH | 1,200 | 3.15 | 7.33 | $55.42 | $115,270 |
| Santa Maria-Santa Barbara, CA | 560 | 2.90 | 6.74 | $57.74 | $120,100 |
| Crestview-Fort Walton Beach-Destin, FL | 290 | 2.59 | 6.03 | $47.36 | $98,510 |
| Bakersfield, CA | 620 | 1.97 | 4.57 | $53.27 | $110,810 |
| Hartford-West Hartford-East Hartford, CT | 1,080 | 1.85 | 4.29 | (8) | (8) |
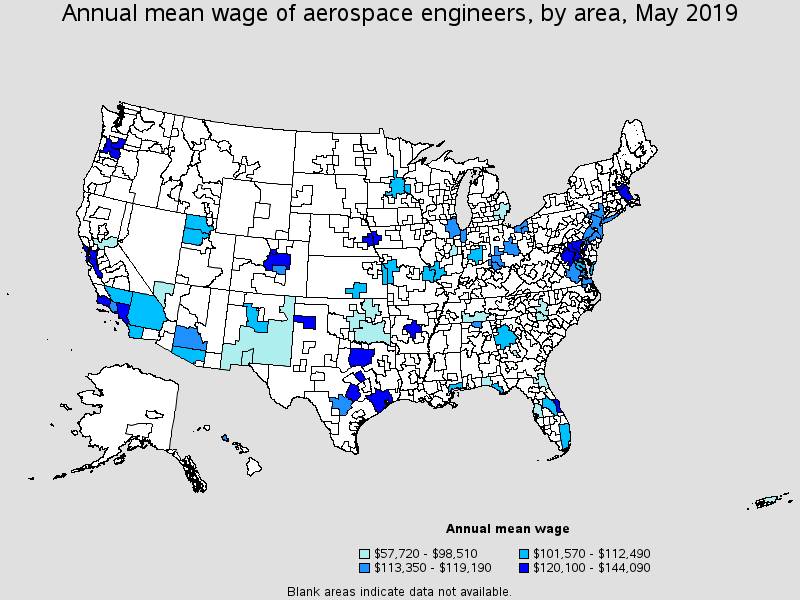
Top paying metropolitan areas for this occupation:
| Metropolitan area | Employment (1) | Employment per thousand jobs | Location quotient (9) | Hourly mean wage | Annual mean wage (2) |
|---|---|---|---|---|---|
| Washington-Arlington-Alexandria, DC-VA-MD-WV | 2,270 | 0.72 | 1.66 | $69.27 | $144,090 |
| San Jose-Sunnyvale-Santa Clara, CA | 780 | 0.68 | 1.59 | $67.10 | $139,560 |
| San Francisco-Oakland-Hayward, CA | (8) | (8) | (8) | $65.01 | $135,230 |
| Omaha-Council Bluffs, NE-IA | 60 | 0.11 | 0.26 | $64.64 | $134,460 |
| Baltimore-Columbia-Towson, MD | 600 | 0.44 | 1.02 | $64.27 | $133,690 |
| Boulder, CO | 760 | 4.11 | 9.55 | $62.93 | $130,890 |
| Los Angeles-Long Beach-Anaheim, CA | 4,620 | 0.74 | 1.72 | $62.81 | $130,640 |
| Amarillo, TX | (8) | (8) | (8) | $61.93 | $128,810 |
| Dallas-Fort Worth-Arlington, TX | 3,150 | 0.86 | 2.00 | $61.88 | $128,710 |
| Houston-The Woodlands-Sugar Land, TX | 1,770 | 0.58 | 1.34 | $61.77 | $128,480 |
Nonmetropolitan areas with the highest employment in this occupation:
| Nonmetropolitan area | Employment (1) | Employment per thousand jobs | Location quotient (9) | Hourly mean wage | Annual mean wage (2) |
|---|---|---|---|---|---|
| South Central Tennessee nonmetropolitan area | 290 | 2.69 | 6.25 | $46.41 | $96,540 |
| Northeast Virginia nonmetropolitan area | 190 | 3.84 | 8.93 | $54.08 | $112,490 |
| Southern Ohio non-metropolitan area | 90 | 0.57 | 1.33 | (8) | (8) |
| Northwestern Idaho nonmetropolitan area | 40 | 0.58 | 1.35 | (8) | (8) |
Nonmetropolitan areas with the highest concentration of jobs and location quotients in this occupation:
| Nonmetropolitan area | Employment (1) | Employment per thousand jobs | Location quotient (9) | Hourly mean wage | Annual mean wage (2) |
|---|---|---|---|---|---|
| Northeast Virginia nonmetropolitan area | 190 | 3.84 | 8.93 | $54.08 | $112,490 |
| South Central Tennessee nonmetropolitan area | 290 | 2.69 | 6.25 | $46.41 | $96,540 |
| Northwestern Idaho nonmetropolitan area | 40 | 0.58 | 1.35 | (8) | (8) |
| Southern Ohio non-metropolitan area | 90 | 0.57 | 1.33 | (8) | (8) |
Top paying nonmetropolitan areas for this occupation:
| Nonmetropolitan area | Employment (1) | Employment per thousand jobs | Location quotient (9) | Hourly mean wage | Annual mean wage (2) |
|---|---|---|---|---|---|
| Northeast Virginia nonmetropolitan area | 190 | 3.84 | 8.93 | $54.08 | $112,490 |
| Southeast Oklahoma nonmetropolitan area | (8) | (8) | (8) | $47.26 | $98,290 |
| South Central Tennessee nonmetropolitan area | 290 | 2.69 | 6.25 | $46.41 | $96,540 |
| Eastern New Mexico nonmetropolitan area | (8) | (8) | (8) | $37.62 | $78,240 |
These estimates are calculated with data collected from employers in all industry sectors, all metropolitan and nonmetropolitan areas, and all states and the District of Columbia. The top employment and wage figures are provided above. The complete list is available in the downloadable XLS files.
The percentile wage estimate is the value of a wage below which a certain percent of workers fall. The median wage is the 50th percentile wage estimate--50 percent of workers earn less than the median and 50 percent of workers earn more than the median. More about percentile wages.
(1) Estimates for detailed occupations do not sum to the totals because the totals include occupations not shown separately. Estimates do not include self-employed workers.
(2) Annual wages have been calculated by multiplying the hourly mean wage by a "year-round, full-time" hours figure of 2,080 hours; for those occupations where there is not an hourly wage published, the annual wage has been directly calculated from the reported survey data.
(3) The relative standard error (RSE) is a measure of the reliability of a survey statistic. The smaller the relative standard error, the more precise the estimate.
(8) Estimate not released.
(9) The location quotient is the ratio of the area concentration of occupational employment to the national average concentration. A location quotient greater than one indicates the occupation has a higher share of employment than average, and a location quotient less than one indicates the occupation is less prevalent in the area than average.
Other OES estimates and related information:
May 2019 National Occupational Employment and Wage Estimates
May 2019 State Occupational Employment and Wage Estimates
May 2019 Metropolitan and Nonmetropolitan Area Occupational Employment and Wage Estimates
May 2019 National Industry-Specific Occupational Employment and Wage Estimates
Last Modified Date: July 6, 2020