
During the summer months, young people (ages 16 to 24) may head to work, many for the first time. Maybe it’s babysitting or lawn mowing. Or perhaps you’re a lifeguard or working at the local fast food joint. With many students out of school and looking for opportunities in the workforce, just how safe are these new workers? In what types of jobs do workplace fatalities most commonly occur for these young workers and why?
From 2011 to 2016, 2,176 young workers were killed while on the job. One-third of these fatal injuries occurred during the summertime; 20 percent of the workers killed were ages 16–19, while the remaining 80 percent were ages 20–24.
Where do young worker fatalities occur?
While there are restrictions on the types of work that certain younger workers can do and the number of hours they can work, young workers still often have hazardous jobs. Construction and extraction occupations accounted for 22 percent of fatalities to young workers during the summer months, followed by transportation and material moving (17 percent) and farming, fishing, and forestry (11 percent). Farming, fishing, and forestry occupations accounted for 25 percent of all fatalities for workers ages 16–19, compared with only 8 percent for workers ages 20–24.
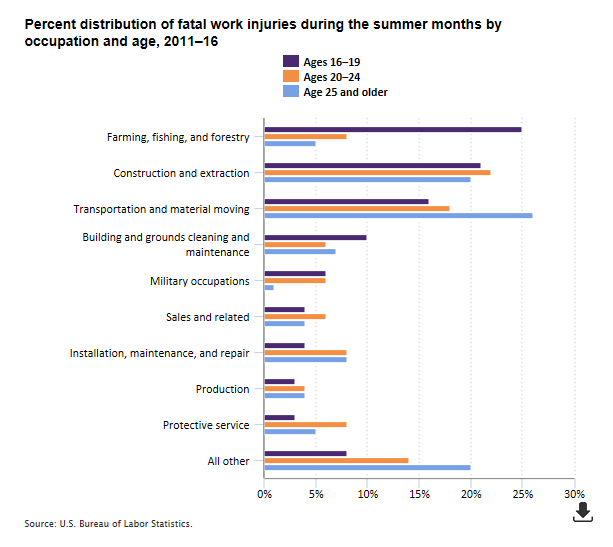
Editor’s note: Data for this chart are available in the table below.
Over the 6-year period, construction laborers experienced the most fatal injuries of any individual occupation for both 16–19 year-old workers (36 fatal injuries) and 20–24 year-old workers (126 fatal injuries).
Are young workers more or less likely to have workplace fatalities?
Young workers have lower fatality rates than middle age and older workers. In 2016, workers ages 16–17, 18–19, and 20–24 all had lower fatal injury rates than the total fatality rate of 3.6 workers per 100,000 full-time equivalent workers.
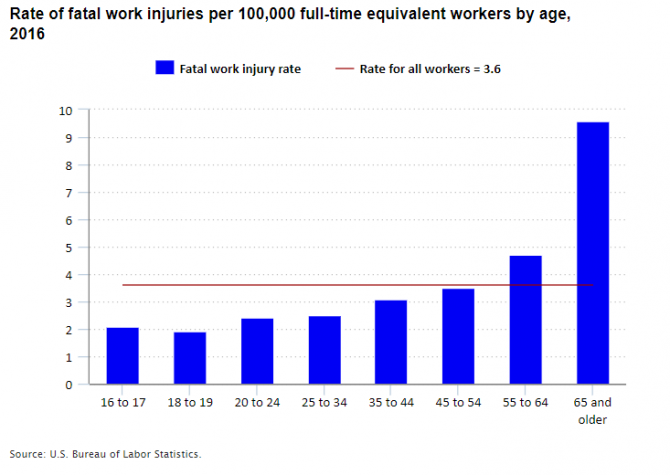
Editor’s note: Data for this chart are available in the table below.
What kinds of fatal incidents occur to young workers?
Transportation incidents accounted for the greatest proportion of workplace fatalities to both 16–19 year-old and 20–24 year-old workers. Transportation incidents include those involving airplanes, trains, water vehicles, or pedestrians struck by vehicles. The most prevalent are “roadway” incidents, where the person killed was in a vehicle. Typical roadway incidents include collisions between vehicles, collisions between a vehicle and something other than a vehicle, and noncollision incidents, such as a vehicle that jackknifes or overturns.
Roadway incidents alone accounted for more than one-quarter of fatal injuries to workers ages 16–19 and 20–24, which is similar to all workers.
| Event or exposure | Ages 16–19 | Ages 20–24 |
|---|---|---|
| Violence and other injuries by persons or animals | 9% | 18% |
Homicides | 6 | 8 |
Suicides | 3 | 9 |
| Transportation incidents | 51 | 42 |
Roadway incidents | 27 | 26 |
| Fall, slip, trip | 6 | 7 |
Fall to lower level | 6 | 7 |
| Exposure to harmful substances or environments | 13 | 17 |
Exposure to electricity | 5 | 8 |
| Contact with objects and equipment | 19 | 11 |
Struck by object or equipment | 13 | 8 |
| Note: Totals do not add to 100 percent because some fatal injuries did not fall into any of these categories. | ||
Workers ages 16–19 experienced a higher proportion of fatalities due to contact with objects and equipment, such as being struck by an object or equipment. Workers ages 20–24 experienced a higher proportion of fatal injuries due to workplace violence—both homicides and suicides.
What resources are available to increase young worker safety?
Before you apply for that next summer job, or before you tell your kids to get out from behind the video games and get a job, you might want to learn more about hazards in the workplace. Both the Occupational Safety and Health Administration and the Centers for Disease Control and Prevention have online resources to help prevent workplace injuries and fatalities to young workers.
Want to know more about fatalities in the workplace?
- See our Injuries, Illnesses, and Fatalities homepage.
- Check out our interactive charts and state data.
- Contact the workplace injuries, illnesses and fatalities information folks at (202) 691-6170 or by email.
- Read these blogs:
| Occupation | Ages 16–19 | Ages 20–24 | Age 25 and older |
|---|---|---|---|
| Farming, fishing, and forestry | 25% | 8% | 5% |
| Construction and extraction | 21 | 22 | 20 |
| Transportation and material moving | 16 | 18 | 26 |
| Building and grounds cleaning and maintenance | 10 | 6 | 7 |
| Military occupations | 6 | 6 | 1 |
| Sales and related | 4 | 6 | 4 |
| Installation, maintenance, and repair | 4 | 8 | 8 |
| Production | 3 | 4 | 4 |
| Protective service | 3 | 8 | 5 |
| All other | 8 | 14 | 20 |
| Age | Fatal work injury rate |
|---|---|
| 16 to 17 | 2.1 |
| 18 to 19 | 1.9 |
| 20 to 24 | 2.4 |
| 25 to 34 | 2.5 |
| 35 to 44 | 3.1 |
| 45 to 54 | 3.5 |
| 55 to 64 | 4.7 |
| 65 and older | 9.6 |