
The U.S. Bureau of Labor Statistics has reported on workplace safety for much of its 134-year history. Current data have their origins in the Occupational Safety and Health Act of 1970 and program revisions made in the early 1990s. In the past year, BLS has revamped the way it releases workplace safety information, streamlining the approach to reduce confusion and make information available sooner.
Each year BLS publishes information on fatal work injuries from the Census of Fatal Occupational Injuries and nonfatal work injuries and illnesses from the Survey of Occupational Injuries and Illnesses. BLS recently modernized the data release for both programs.
Before 2016, BLS released two sets of fatal injury data—preliminary and final. Preliminary data were typically available in August or September following the reference year; final data were available as many as 8 months later. This two-step release made it difficult to understand changes from year to year. Widespread publicity surrounded the preliminary release. Some users compared newly released preliminary information with the previous year’s final information. The release cautioned readers not to compare final and preliminary figures, but that was what readers wanted to do. By the final release, the publicity surrounding the data largely had faded.
Our review of the fatal injury program revealed that much of the updated information was available within a few months of the preliminary release. We decided to eliminate the preliminary data release and instead provide a single, final set of data each year in December. While this delayed the information for a few months, it lessened confusion and made final data available many months earlier than in the past. We released fatal work injury information for 2015 in December 2016 and 2016 information in December 2017.
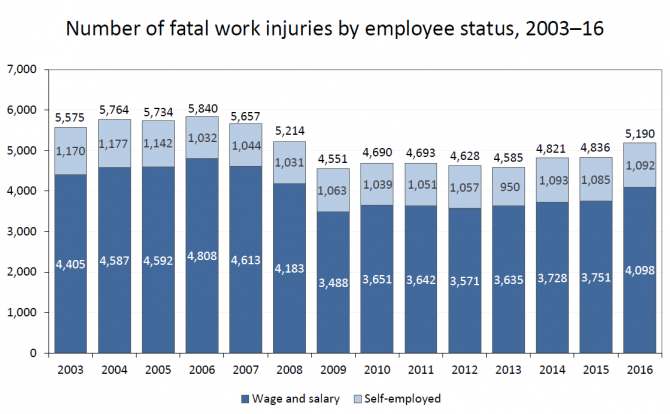
Editor’s note: Data for this chart are available in the table below.
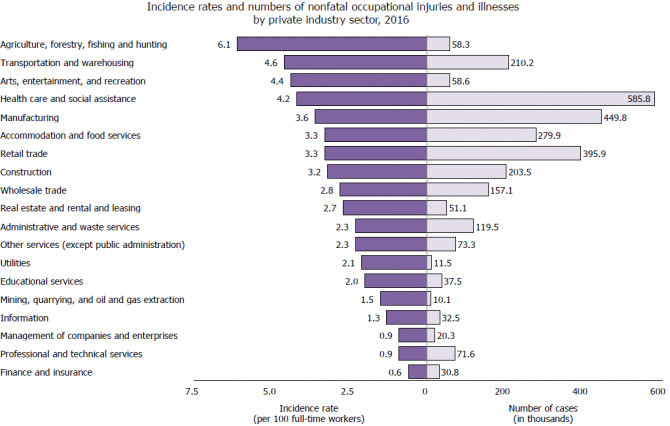
Before 2017, BLS released two sets of nonfatal data from the Survey of Occupational Injuries and Illnesses. We first released summary information highlighting the number and rate of nonfatal injuries by industry. We later released detailed data about a subset of workplace injuries that resulted in days away from work. Summary information has been available from the survey since the early 1970s. When BLS added the detailed data in the early 1990s, we released them separately from the summary information because we could not complete the estimation until several months after the summary data came out.
In recent years, we have been able to complete the detailed case estimates within a few weeks of the summary information. The closeness of the two releases often confused people about which data were available when. Further, the two sets of information complement each other. As you learn about the number or rate of injuries by industry, you are naturally curious about the details. Which occupations? What was the nature of the injury or event that resulted in the injury? How long is the injured employee away from work?
Beginning with 2016 data, we combined all information on nonfatal injuries and illnesses into a single release published on November 9, 2017. From the information available that day, you learn there were roughly a half-million recorded injuries and illnesses in the manufacturing industry. About one in four of them resulted in days away from work. Further, about 35,000 days-away-from-work cases in manufacturing resulted in sprains, strains, or tears, and 15,000 resulted in cuts or lacerations. The median number of days an injured manufacturing worker spent away from work was 9 days.
By combining information in this way, BLS and data users can develop stories about the circumstances surrounding worker injuries and identify opportunities for prevention.
Editor’s note: Data for this chart are available in the table below.
To learn more, see our Injuries, Illnesses, and Fatalities homepage.
| Year | Wage and salary | Self-employed | Total |
|---|---|---|---|
| 2003 | 4,405 | 1,170 | 5,575 |
| 2004 | 4,587 | 1,177 | 5,764 |
| 2005 | 4,592 | 1,142 | 5,734 |
| 2006 | 4,808 | 1,032 | 5,840 |
| 2007 | 4,613 | 1,044 | 5,657 |
| 2008 | 4,183 | 1,031 | 5,214 |
| 2009 | 3,488 | 1,063 | 4,551 |
| 2010 | 3,651 | 1,039 | 4,690 |
| 2011 | 3,642 | 1,051 | 4,693 |
| 2012 | 3,571 | 1,057 | 4,628 |
| 2013 | 3,635 | 950 | 4,585 |
| 2014 | 3,728 | 1,093 | 4,821 |
| 2015 | 3,751 | 1,085 | 4,836 |
| 2016 | 4,098 | 1,092 | 5,190 |
| Private industry sector | Incidence rate | Number of cases |
|---|---|---|
| Agriculture, forestry, fishing and hunting | 6.1 | 58,300 |
| Transportation and warehousing | 4.6 | 210,200 |
| Arts, entertainment, and recreation | 4.4 | 58,600 |
| Health care and social assistance | 4.2 | 585,800 |
| Manufacturing | 3.6 | 449,800 |
| Accommodation and food services | 3.3 | 279,900 |
| Retail trade | 3.3 | 395,900 |
| Construction | 3.2 | 203,500 |
| Wholesale trade | 2.8 | 157,100 |
| Real estate and rental and leasing | 2.7 | 51,100 |
| Administrative and waste services | 2.3 | 119,500 |
| Other services (except public administration) | 2.3 | 73,300 |
| Utilities | 2.1 | 11,500 |
| Educational services | 2.0 | 37,500 |
| Mining, quarrying, and oil and gas extraction | 1.5 | 10,100 |
| Information | 1.3 | 32,500 |
| Management of companies and enterprises | 0.9 | 20,300 |
| Professional and technical services | 0.9 | 71,600 |
| Finance and insurance | 0.6 | 30,800 |
| Note: The incidence rate is the number of injuries and illnesses per 100 full-time equivalent workers. | ||