An official website of the United States government
An official website of the United States government
The .gov means it's official.
Federal government websites often end in .gov or .mil. Before sharing sensitive information,
make sure you're on a federal government site.
The site is secure.
The
https:// ensures that you are connecting to the official website and that any
information you provide is encrypted and transmitted securely.
19-191-ATL
Tuesday, March 05, 2019
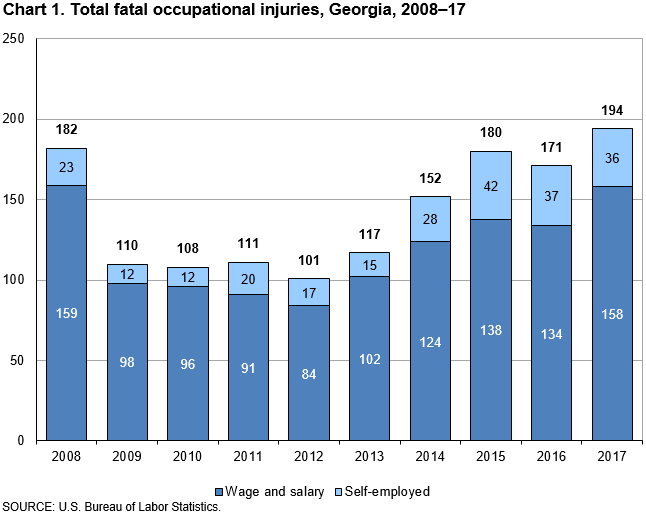
Fatal work injuries totaled 194 in 2017 for Georgia, the U.S. Bureau of Labor Statistics reported today. Regional Commissioner Janet S. Rankin noted that the number of work-related fatalities in Georgia was up from 171 in the previous year. Fatal occupational injuries in the state have ranged from a high of 249 in 1994 to a low of 101 in 2012. (See chart 1.)
Nationwide, a total of 5,147 fatal work injuries were recorded in 2017, down slightly from the 5,190 fatal injuries reported in 2016, according to results from the Census of Fatal Occupational Injuries (CFOI) program.
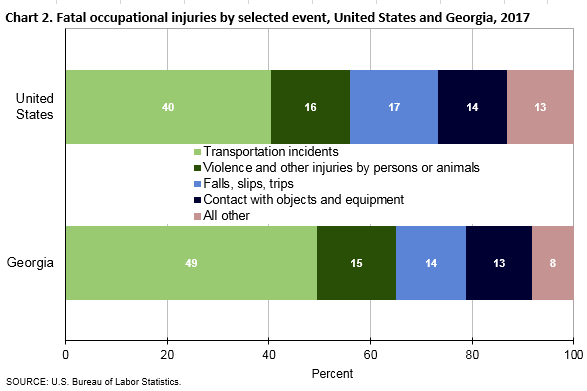
Type of incidentIn Georgia, transportation incidents resulted in 96 fatal work injuries, up from 76 in 2016, and accounted for about half (49 percent) of all workplace fatalities. (See table 1.) Violence and other injuries by persons or animals was the second-most frequent fatal event in Georgia with 30 fatalities, followed by falls, slips, or trips (27).
Nationally, transportation incidents were the most frequent fatal workplace event in 2017, accounting for 40 percent of fatal work injuries. (See chart 2.) Falls, slips, or trips was the second-most common fatal event (17 percent), followed by violence and other injuries by persons or animals (16 percent).
IndustryThe private transportation and warehousing sector had the largest number of fatalities in Georgia with 39, little changed from the previous year. (See table 2.) General freight trucking accounted for 18, or 46 percent, of the fatal injuries in this industry.
The private construction sector had 34 workplace fatalities, similar to the count in the previous year. Twenty-two, or 65 percent, of those fatally injured in this industry worked in the specialty trade contractors subsector.
OccupationTransportation and material moving occupations and construction and extraction occupations had the highest number of workplace fatalities with 67 and 33, respectively. (See table 3.) The majority of the fatalities within the transportation and material moving group were heavy and tractor-trailer truck drivers (37). Construction laborers accounted for 12 of the 33 fatalities among construction and extraction workers.
Additional highlightsBackground of the program. The Census of Fatal Occupational Injuries (CFOI), part of the Bureau of Labor Statistics (BLS) Occupational Safety and Health Statistics (OSHS) program, compiles a count of all fatal work injuries occurring in the U.S. during the calendar year. The CFOI program uses diverse state, federal, and independent data sources to identify, verify, and describe fatal work injuries. This ensures counts are as complete and accurate as possible. For the 2017 national data, over 23,400 unique source documents were reviewed as part of the data collection process. For the Georgia 2017 data, 921 unique source documents were reviewed. For technical information and definitions for CFOI, please go to the BLS Handbook of Methods on the BLS website at www.bls.gov/opub/hom/cfoi/home.htm.
Federal/State agency coverage. The CFOI includes data for all fatal work injuries, even those that may be outside the scope of other agencies or regulatory coverage. Thus, any comparison between the BLS fatality census counts and those released by other agencies should take into account the different coverage requirements and definitions being used by each agency. More on the scope of CFOI can be found at www.bls.gov/iif/cfoiscope.htm and www.bls.gov/opub/hom/cfoi/concepts.htm.
Acknowledgments. BLS thanks the Georgia Department of Health for their efforts in collecting accurate, comprehensive, and useful data on fatal work injuries. BLS also appreciates the efforts of all federal, state, local, and private sector entities that provided source documents used to identify fatal work injuries. Among these agencies are the Occupational Safety and Health Administration; the National Transportation Safety Board; the U.S. Coast Guard; the Mine Safety and Health Administration; the Office of Workers’ Compensation Programs (Federal Employees' Compensation and Longshore and Harbor Workers' Compensation divisions); the Federal Railroad Administration; the National Highway Traffic Safety Administration; state vital statistics registrars, coroners, and medical examiners; state departments of health, labor, and industrial relations and workers' compensation agencies; state and local police departments; and state farm bureaus.
Information in this release will be made available to sensory impaired individuals upon request. Voice phone: (202) 691-5200; Federal Relay Service: (800) 877-8339.
| Event or exposure (1) | 2016 | 2017 | |
|---|---|---|---|
| Number | Number | Percent | |
Total | 171 | 194 | 100 |
Violence and other injuries by persons or animals | 37 | 30 | 15 |
Intentional injury by person | 37 | 27 | 14 |
Homicides (Intentional injury by other person) | 31 | 19 | 10 |
Suicides (Self-inflicted injury--intentional) | 5 | 8 | 4 |
Injury by person--unintentional or intent unknown | -- | 2 | 1 |
Transportation incidents | 76 | 96 | 49 |
Aircraft incidents | 5 | 6 | 3 |
Rail vehicle incidents | 3 | 1 | 1 |
Pedestrian vehicular incident | 9 | 14 | 7 |
Roadway incidents involving motorized land vehicle | 55 | 70 | 36 |
Roadway collision with other vehicle | 26 | 47 | 24 |
Roadway collision--moving in same direction | 6 | 16 | 8 |
Roadway collision--moving in opposite directions, oncoming | 8 | 17 | 9 |
Roadway collision--moving perpendicularly | 7 | 11 | 6 |
Roadway collision--moving and standing vehicle in roadway | 2 | 2 | 1 |
Roadway collision--moving and standing vehicle on side of roadway | 3 | 1 | 1 |
Roadway collision with object other than vehicle | 19 | 13 | 7 |
Vehicle struck object or animal in roadway | -- | 1 | 1 |
Vehicle struck object or animal on side of roadway | 19 | 11 | 6 |
Vehicle struck by falling or flying object--roadway | -- | 1 | 1 |
Roadway noncollision incident | 10 | 10 | 5 |
Fires and explosions | 2 | -- | -- |
Falls, slips, trips | 29 | 27 | 14 |
Falls to lower level | 26 | 25 | 13 |
Fall through surface or existing opening | 5 | 5 | 3 |
Other fall to lower level | 18 | 19 | 10 |
Exposure to harmful substances or environments | 14 | 13 | 7 |
Exposure to electricity | 6 | 3 | 2 |
Exposure to other harmful substances | 4 | 8 | 4 |
Exposure to oxygen deficiency, n.e.c. | -- | 1 | 1 |
Contact with objects and equipment | 13 | 25 | 13 |
Struck by object or equipment | 8 | 16 | 8 |
Caught in or compressed by equipment or objects | 1 | 6 | 3 |
Footnotes: | |||
NOTE: Data for all years are final. Totals for major categories may include subcategories not shown separately. Percentages may not add to totals because of rounding. CFOI fatality counts exclude illness-related deaths unless precipitated by an injury event. Dashes indicate no data reported or data that do not meet publication criteria. | |||
| Industry (1) | 2016 | 2017 | |
|---|---|---|---|
| Number | Number | Percent | |
Total | 171 | 194 | 100 |
Private industry | 151 | 169 | 87 |
Natural resources and mining | 8 | 15 | 8 |
Agriculture, forestry, fishing and hunting | 7 | 14 | 7 |
Mining, quarrying, and oil and gas extraction (2) | 1 | 1 | 1 |
Construction | 35 | 34 | 18 |
Construction | 35 | 34 | 18 |
Construction of buildings | 4 | 9 | 5 |
Heavy and civil engineering construction | 5 | 3 | 2 |
Specialty trade contractors | 26 | 22 | 11 |
Manufacturing | 12 | 14 | 7 |
Trade, transportation, and utilities | 55 | 57 | 29 |
Wholesale trade | 5 | 7 | 4 |
Retail trade | 11 | 11 | 6 |
Transportation and warehousing | 37 | 39 | 20 |
Air transportation | 2 | 2 | 1 |
Truck transportation | 21 | 25 | 13 |
General freight trucking | 11 | 18 | 9 |
General freight trucking, local | -- | 5 | 3 |
General freight trucking, long-distance | 8 | 13 | 7 |
Specialized freight trucking | 10 | 7 | 4 |
Transit and ground passenger transportation | 6 | 3 | 2 |
Support activities for transportation | 4 | 4 | 2 |
Information | 1 | 4 | 2 |
Financial activities | -- | 6 | 3 |
Real estate and rental and leasing | -- | 4 | 2 |
Professional and business services | 16 | 21 | 11 |
Professional and technical services | -- | 6 | 3 |
Administrative and waste services | 14 | 15 | 8 |
Administrative and support services | 12 | 12 | 6 |
Services to buildings and dwellings | 9 | 9 | 5 |
Educational and health services | 3 | 3 | 2 |
Educational services | 3 | 2 | 1 |
Health care and social assistance | -- | 1 | 1 |
Leisure and hospitality | 11 | 9 | 5 |
Arts, entertainment, and recreation | -- | 1 | 1 |
Accommodation and food services | 11 | 8 | 4 |
Other services, except public administration | 8 | 6 | 3 |
Government (3) | 20 | 25 | 13 |
Federal government | 6 | 9 | 5 |
State government | 2 | 3 | 2 |
Local government | 12 | 13 | 7 |
Footnotes: | |||
NOTE: Data for all years are final. Totals for major categories may include subcategories not shown separately. Percentages may not add to totals because of rounding. CFOI fatality counts exclude illness-related deaths unless precipitated by an injury event. Dashes indicate no data reported or data that do not meet publication criteria. | |||
| Occupation (1) | 2016 | 2017 | |
|---|---|---|---|
| Number | Number | Percent | |
Total | 171 | 194 | 100 |
Management occupations | 6 | 9 | 5 |
Advertising, marketing, promotions, public relations, and sales managers | -- | 1 | 1 |
Other management occupations | 6 | 7 | 4 |
Business and financial operations occupations | -- | -- | -- |
Computer and mathematical occupations | -- | -- | -- |
Architecture and engineering occupations | -- | 3 | 2 |
Life, physical, and social science occupations | -- | -- | -- |
Community and social service occupations | -- | -- | -- |
Legal occupations | 1 | -- | -- |
Education, training, and library occupations | 1 | 1 | 1 |
Arts, design, entertainment, sports, and media occupations | -- | 3 | 2 |
Healthcare practitioners and technical occupations | -- | 2 | 1 |
Healthcare support occupations | -- | -- | -- |
Protective service occupations | 13 | 13 | 7 |
Supervisors of protective service workers | 4 | 2 | 1 |
Fire fighting and prevention workers | -- | 2 | 1 |
Law enforcement workers | 6 | 7 | 4 |
Food preparation and serving related occupations | -- | 5 | 3 |
Supervisors of food preparation and serving workers | -- | 3 | 2 |
Cooks and food preparation workers | 1 | 2 | 1 |
Building and grounds cleaning and maintenance occupations | 15 | 11 | 6 |
Supervisors of building and grounds cleaning and maintenance workers | 1 | 1 | 1 |
Building cleaning and pest control workers | 4 | 4 | 2 |
Grounds maintenance workers | 10 | 6 | 3 |
Personal care and service occupations | -- | 1 | 1 |
Sales and related occupations | 10 | 11 | 6 |
Supervisors of sales workers | 4 | 4 | 2 |
Retail sales workers | 4 | 5 | 3 |
Office and administrative support occupations | 8 | 4 | 2 |
Material recording, scheduling, dispatching, and distributing workers | 6 | 3 | 2 |
Farming, fishing, and forestry occupations | -- | 4 | 2 |
Agricultural workers | -- | 4 | 2 |
Construction and extraction occupations | 32 | 33 | 17 |
Supervisors of construction and extraction workers | -- | 4 | 2 |
Construction trades workers | 30 | 24 | 12 |
Carpenters | 5 | 1 | 1 |
Construction laborers | 12 | 12 | 6 |
Pipelayers, plumbers, pipefitters, and steamfitters | -- | 3 | 2 |
Roofers | 4 | 1 | 1 |
Installation, maintenance, and repair occupations | 17 | 11 | 6 |
Vehicle and mobile equipment mechanics, installers, and repairers | 7 | 3 | 2 |
Other installation, maintenance, and repair occupations | 10 | 8 | 4 |
Production occupations | 5 | 8 | 4 |
Transportation and material moving occupations | 55 | 67 | 35 |
Air transportation workers | 4 | 3 | 2 |
Motor vehicle operators | 43 | 52 | 27 |
Driver/sales workers and truck drivers | 36 | 46 | 24 |
Driver/sales workers | 5 | 5 | 3 |
Heavy and tractor-trailer truck drivers | 29 | 37 | 19 |
Light truck or delivery services drivers | -- | 4 | 2 |
Taxi drivers and chauffeurs | 4 | 4 | 2 |
Material moving workers | 6 | 10 | 5 |
Military specific occupations (2) | 1 | 5 | 3 |
Footnotes: | |||
NOTE: Data for all years are final. Totals for major categories may include subcategories not shown separately. Percentages may not add to totals because of rounding. CFOI fatality counts exclude illness-related deaths unless precipitated by an injury event. Dashes indicate no data reported or data that do not meet publication criteria. | |||
| Worker characteristics | 2016 | 2017 | |
|---|---|---|---|
| Number | Number | Percent | |
Total | 171 | 194 | 100 |
Employee status | |||
Wage and salary workers (1) | 134 | 158 | 81 |
Self-employed (2) | 37 | 36 | 19 |
Gender | |||
Men | 161 | 173 | 89 |
Women | 10 | 21 | 11 |
Age (3) | |||
18 to 19 years | 2 | 2 | 1 |
20 to 24 years | 8 | 14 | 7 |
25 to 34 years | 31 | 30 | 15 |
35 to 44 years | 27 | 41 | 21 |
45 to 54 years | 52 | 33 | 17 |
55 to 64 years | 41 | 50 | 26 |
65 years and over | 10 | 23 | 12 |
Race or ethnic origin (4) | |||
White, non-Hispanic | 95 | 118 | 61 |
Black or African-American, non-Hispanic | 50 | 43 | 22 |
Hispanic or Latino | 16 | 24 | 12 |
Asian, non-Hispanic | 10 | 9 | 5 |
Footnotes: | |||
NOTE: Data for all years are final. Totals for major categories may include subcategories not shown separately. Percentages may not add to totals because of rounding. CFOI fatality counts exclude illness-related deaths unless precipitated by an injury event. Dashes indicate no data reported or data that do not meet publication criteria. | |||
Last Modified Date: Tuesday, March 05, 2019