An official website of the United States government
An official website of the United States government
The .gov means it's official.
Federal government websites often end in .gov or .mil. Before sharing sensitive information,
make sure you're on a federal government site.
The site is secure.
The
https:// ensures that you are connecting to the official website and that any
information you provide is encrypted and transmitted securely.
18-261-ATL
Wednesday, February 21, 2018
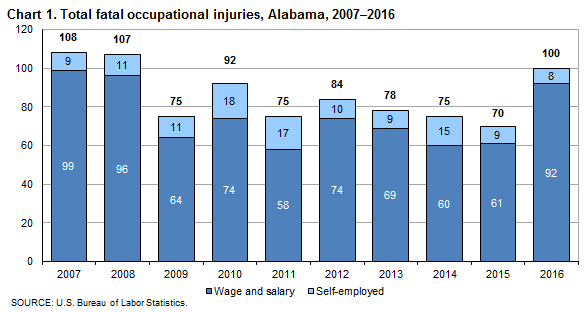
Fatal work injuries totaled 100 in 2016 for Alabama, the U.S. Bureau of Labor Statistics reported today. Regional Commissioner Janet S. Rankin noted that the number of work-related fatalities in Alabama increased from 70 in the previous year. Fatal occupational injuries in the state have ranged from a high of 155 in 1996 to a low of 70 in 2015. (See chart 1.)
Nationwide, a total of 5,190 fatal work injuries were recorded in 2016, a 7-percent increase from the 4,836 fatal injuries in 2015, according to the results from the Census of Fatal Occupational Injuries (CFOI) program. This was the third consecutive increase in annual workplace fatalities and the first time more than 5,000 fatalities have been recorded since 2008.
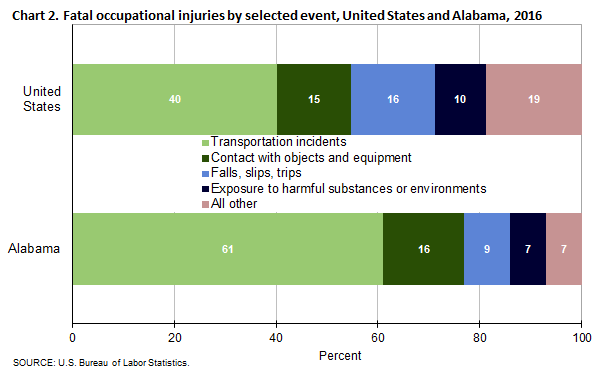
Type of incidentIn Alabama, transportation incidents resulted in 61 fatal work injuries and contact with objects and equipment accounted for 16 fatalities. These two major categories accounted for 77 percent of all workplace fatalities in Alabama. (See table 1.) The number of worker deaths from transportation incidents increased from 37 over the year and worker fatalities due to contact with objects and equipment increased from 9. Falls, slips, or trips was the third-most frequent fatal work event with 9 fatalities, little changed from 2015.
Nationally, transportation incidents were the most frequent fatal workplace event in 2016, accounting for 40 percent of fatal work injuries. (See chart 2.) Violence and other injuries by persons or animals was the second-most common fatal event (17 percent), followed by falls, slips, or trips (16 percent).
IndustryThe private transportation and warehousing sector had the largest number of fatalities in Alabama with 25, up from 16 in the previous year. (See table 2.) Transportation incidents were the most frequent fatal event in the transportation and warehousing sector with 24 worker deaths. General freight trucking accounted for 11, or 44 percent, of the fatal injuries in this industry.
The private construction sector had 20 workplace fatalities, up from 14 in the previous year. Ten, or half of those fatally injured in this sector worked in heavy and civil engineering construction.
OccupationTransportation and material moving occupations and construction and extraction occupations had the highest number of workplace fatalities with 42 and 16, respectively. (See table 3.) The majority of the fatalities within the transportation and material moving group were driver/sales workers and truck drivers (35). Construction trade workers accounted for 12 of the 16 fatalities among construction and extraction workers.
Additional highlightsBackground of the program. The Census of Fatal Occupational Injuries (CFOI), part of the BLS Occupational Safety and Health Statistics (OSHS) program, compiles a count of all fatal work injuries occurring in the U.S. during the calendar year. The CFOI program uses diverse state, federal, and independent data sources to identify, verify, and describe fatal work injuries. This ensures counts are as complete and accurate as possible. For the national 2016 data, over 23,300 unique source documents were reviewed as part of the data collection process. For the Alabama 2016 data, 435 unique source documents were reviewed. For technical information and definitions for CFOI, please go to the BLS Handbook of Methods on the BLS web site at www.bls.gov/opub/hom/cfoi/home.htm.
Federal/State agency coverage. The Census of Fatal Occupational Injuries includes data for all fatal work injuries, whether the decedent was working in a job covered by the Occupational Safety and Health Administration (OSHA) or other federal or state agencies or was outside the scope of regulatory coverage. Thus, any comparison between the BLS fatality census counts and those released by other agencies should take into account the different coverage requirements and definitions being used by each agency.
Acknowledgments. BLS thanks the Alabama Department of Health for their efforts in collecting accurate, comprehensive, and useful data on fatal work injuries. BLS also appreciates the efforts of all federal, state, local, and private sector entities that provided source documents used to identify fatal work injuries. Among these agencies are the Occupational Safety and Health Administration; the National Transportation Safety Board; the U.S. Coast Guard; the Mine Safety and Health Administration; the Office of Workers’ Compensation Programs (Federal Employees' Compensation and Longshore and Harbor Workers' Compensation divisions); the Federal Railroad Administration; the National Highway Traffic Safety Administration; state vital statistics registrars, coroners, and medical examiners; state departments of health, labor, and industrial relations and workers' compensation agencies; state and local police departments; and state farm bureaus.
Information in this release will be made available to sensory impaired individuals upon request. Voice phone: (202) 691-5200; Federal Relay Service: (800) 877-8339.
| Event or exposure (1) | 2015 | 2016 | |
|---|---|---|---|
| Number | Number | Percent | |
Total | 70 | 100 | 100 |
Violence and other injuries by persons or animals | 5 | 5 | 5 |
Intentional injury by person | 5 | 5 | 5 |
Homicides (Intentional injury by other person) | -- | 5 | 5 |
Shooting by other person--intentional | -- | 4 | 4 |
Stabbing, cutting, slashing, piercing | -- | 1 | 1 |
Transportation incidents | 37 | 61 | 61 |
Aircraft incidents | 1 | 3 | 3 |
Aircraft crash during takeoff or landing | -- | 3 | 3 |
Aircraft crash during takeoff or landing--into structure, object, or ground | -- | 3 | 3 |
Rail vehicle incidents | -- | 1 | 1 |
Collision between rail vehicle and another vehicle | -- | 1 | 1 |
Collision between rail and roadway vehicles | -- | 1 | 1 |
Pedestrian vehicular incident | 8 | 6 | 6 |
Pedestrian struck by vehicle in work zone | -- | 3 | 3 |
Pedestrian struck by forward-moving vehicle in work zone | -- | 3 | 3 |
Pedestrian struck by vehicle on side of road | 2 | -- | -- |
Pedestrian struck by forward-moving vehicle on side of road | 2 | 1 | 1 |
Pedestrian struck by vehicle in nonroadway area | -- | 1 | 1 |
Pedestrian struck by forward-moving vehicle in nonroadway area | -- | 1 | 1 |
Roadway incidents involving motorized land vehicle | 24 | 47 | 47 |
Roadway collision with other vehicle | 15 | 21 | 21 |
Roadway collision--moving in same direction | 2 | 11 | 11 |
Roadway collision--moving in opposite directions, oncoming | 5 | 3 | 3 |
Roadway collision--moving and standing vehicle on side of roadway | -- | 3 | 3 |
Roadway collision with object other than vehicle | 8 | 18 | 18 |
Vehicle struck object or animal on side of roadway | 8 | 16 | 16 |
Roadway noncollision incident | -- | 8 | 8 |
Jack-knifed or overturned, roadway | -- | 6 | 6 |
Nonroadway incident involving motorized land vehicles | -- | 4 | 4 |
Nonroadway noncollision incident | -- | 3 | 3 |
Jack-knifed or overturned, nonroadway | -- | 3 | 3 |
Fires and explosions | 5 | 2 | 2 |
Explosions | 4 | 2 | 2 |
Explosion of pressure vessel, piping, or tire | -- | 2 | 2 |
Falls, slips, trips | 10 | 9 | 9 |
Falls to lower level | 10 | 7 | 7 |
Other fall to lower level | 5 | 5 | 5 |
Exposure to harmful substances or environments | 4 | 7 | 7 |
Exposure to electricity | 3 | 4 | 4 |
Direct exposure to electricity | 1 | 3 | 3 |
Contact with objects and equipment | 9 | 16 | 16 |
Struck by object or equipment | 8 | 9 | 9 |
Struck by powered vehicle--nontransport | -- | 4 | 4 |
Struck by falling object or equipment--other than powered vehicle | 6 | 5 | 5 |
Struck by object falling from vehicle or machinery--other than vehicle part | 4 | 2 | 2 |
Caught in or compressed by equipment or objects | -- | 4 | 4 |
Caught in running equipment or machinery | -- | -- | -- |
Caught in running equipment or machinery during regular operation | -- | 1 | 1 |
Struck, caught, or crushed in collapsing structure, equipment, or material | -- | 3 | 3 |
Footnotes: | |||
NOTE: Data for all years are final. Totals for major categories may include subcategories not shown separately. Percentages may not add to totals because of rounding. CFOI fatality counts exclude illness-related deaths unless precipitated by an injury event. Dashes indicate no data reported or data that do not meet publication criteria. | |||
| Industry (1) | 2015 | 2016 | |
|---|---|---|---|
| Number | Number | Percent | |
Total | 70 | 100 | 100 |
Private industry | 61 | 91 | 91 |
Natural resources and mining | 6 | 11 | 11 |
Agriculture, forestry, fishing and hunting | 5 | 11 | 11 |
Forestry and logging | -- | 8 | 8 |
Logging | -- | 8 | 8 |
Construction | 14 | 20 | 20 |
Construction of buildings | -- | 3 | 3 |
Heavy and civil engineering construction | 4 | 10 | 10 |
Utility system construction | 2 | 4 | 4 |
Water and sewer line and related structures construction | 1 | 1 | 1 |
Highway, street, and bridge construction | 1 | 6 | 6 |
Highway, street, and bridge construction | 1 | 6 | 6 |
Specialty trade contractors | 9 | 7 | 7 |
Building equipment contractors | -- | 4 | 4 |
Electrical contractors | -- | 3 | 3 |
Manufacturing | 10 | 7 | 7 |
Wood product manufacturing | -- | 3 | 3 |
Transportation equipment manufacturing | -- | 3 | 3 |
Motor vehicle parts manufacturing | -- | 1 | 1 |
Motor vehicle metal stamping | -- | 1 | 1 |
Ship and boat building | -- | 1 | 1 |
Ship building and repairing | -- | 1 | 1 |
Trade, transportation, and utilities | 23 | 33 | 33 |
Utilities | 1 | 1 | 1 |
Electric power generation, transmission and distribution | -- | 1 | 1 |
Electric power transmission, control, and distribution | -- | 1 | 1 |
Electric power distribution | -- | 1 | 1 |
Wholesale trade | 3 | 3 | 3 |
Merchant wholesalers, nondurable goods | -- | 3 | 3 |
Grocery and related product wholesalers | -- | 1 | 1 |
Dairy product (except dried or canned) merchant wholesalers | -- | 1 | 1 |
Retail trade | 3 | 4 | 4 |
Gasoline stations | -- | 1 | 1 |
Gasoline stations with convenience stores | -- | 1 | 1 |
General merchandise stores | -- | 1 | 1 |
Other general merchandise stores | -- | 1 | 1 |
Transportation and warehousing | 16 | 25 | 25 |
Truck transportation | 15 | 20 | 20 |
General freight trucking | 7 | 11 | 11 |
General freight trucking, long-distance | 4 | 10 | 10 |
General freight trucking, long-distance, truckload | -- | 4 | 4 |
Specialized freight trucking | 8 | 9 | 9 |
Specialized freight (except used goods) trucking, long-distance | 5 | 7 | 7 |
Support activities for transportation | 1 | 4 | 4 |
Support activities for road transportation | -- | 4 | 4 |
Motor vehicle towing | -- | 4 | 4 |
Financial activities | 1 | 1 | 1 |
Real estate and rental and leasing | 1 | 1 | 1 |
Real estate | -- | 1 | 1 |
Lessors of real estate | -- | 1 | 1 |
Lessors of residential buildings and dwellings | -- | 1 | 1 |
Professional and business services | 3 | 11 | 11 |
Administrative and waste services | 3 | 9 | 9 |
Administrative and support services | 3 | 8 | 8 |
Services to buildings and dwellings | 2 | 6 | 6 |
Landscaping services | 1 | 4 | 4 |
Waste management and remediation services | -- | 1 | 1 |
Waste collection | -- | 1 | 1 |
Solid waste collection | -- | 1 | 1 |
Educational and health services | -- | 3 | 3 |
Educational services | 1 | 1 | 1 |
Elementary and secondary schools | 1 | 1 | 1 |
Colleges, universities, and professional schools | -- | 1 | 1 |
Health care and social assistance | -- | 3 | 3 |
Ambulatory health care services | 2 | 3 | 3 |
Other ambulatory health care services | 1 | 3 | 3 |
Ambulance services | 1 | 3 | 3 |
Other services, except public administration | 2 | 3 | 3 |
Repair and maintenance | 1 | 2 | 2 |
Automotive repair and maintenance | 1 | 2 | 2 |
Automotive body, paint, interior, and glass repair | -- | 2 | 2 |
Automotive body, paint, and interior repair and maintenance | -- | 2 | 2 |
Government (2) | 9 | 9 | 9 |
State government | 1 | 3 | 3 |
Local government | 8 | 5 | 5 |
Footnotes: | |||
NOTE: Data for all years are final. Totals for major categories may include subcategories not shown separately. Percentages may not add to totals because of rounding. CFOI fatality counts exclude illness-related deaths unless precipitated by an injury event. Dashes indicate no data reported or data that do not meet publication criteria. | |||
| Occupation (1) | 2015 | 2016 | |
|---|---|---|---|
| Number | Number | Percent | |
Total | 70 | 100 | 100 |
Management occupations | -- | 1 | 1 |
Other management occupations | -- | 1 | 1 |
Property, real estate, and community association managers | -- | 1 | 1 |
Architecture and engineering occupations | -- | -- | -- |
Drafters, engineering technicians, and mapping technicians | -- | 1 | 1 |
Engineering technicians, except drafters | -- | 1 | 1 |
Education, training, and library occupations | 1 | 1 | 1 |
Postsecondary teachers | -- | 1 | 1 |
Miscellaneous postsecondary teachers | -- | 1 | 1 |
Healthcare practitioners and technical occupations | -- | 2 | 2 |
Health diagnosing and treating practitioners | -- | 1 | 1 |
Registered nurses | -- | 1 | 1 |
Health technologists and technicians | -- | 1 | 1 |
Emergency medical technicians and paramedics | -- | 1 | 1 |
Protective service occupations | 5 | 1 | 1 |
Law enforcement workers | 1 | 1 | 1 |
Bailiffs, correctional officers, and jailers | -- | 1 | 1 |
Correctional officers and jailers | -- | 1 | 1 |
Building and grounds cleaning and maintenance occupations | 3 | 8 | 8 |
Building cleaning and pest control workers | 1 | 3 | 3 |
Grounds maintenance workers | -- | 5 | 5 |
Tree trimmers and pruners | 1 | 3 | 3 |
Sales and related occupations | 3 | 3 | 3 |
Supervisors of sales workers | -- | 1 | 1 |
First-line supervisors of sales workers | -- | 1 | 1 |
Retail sales workers | -- | 2 | 2 |
Cashiers | -- | 1 | 1 |
Retail salespersons | -- | 1 | 1 |
Farming, fishing, and forestry occupations | 4 | 7 | 7 |
Agricultural workers | 1 | -- | -- |
Miscellaneous agricultural workers | 1 | -- | -- |
Farmworkers and laborers, crop, nursery, and greenhouse | 1 | 1 | 1 |
Forest, conservation, and logging workers | -- | 5 | 5 |
Logging workers | -- | 5 | 5 |
Logging equipment operators | -- | 4 | 4 |
Construction and extraction occupations | 13 | 16 | 16 |
Supervisors of construction and extraction workers | -- | 4 | 4 |
First-line supervisors of construction trades and extraction workers | -- | 4 | 4 |
Construction trades workers | 9 | 12 | 12 |
Construction laborers | -- | 3 | 3 |
Roofers | -- | 3 | 3 |
Installation, maintenance, and repair occupations | 5 | 6 | 6 |
Vehicle and mobile equipment mechanics, installers, and repairers | -- | 1 | 1 |
Automotive technicians and repairers | 1 | 1 | 1 |
Automotive body and related repairers | -- | 1 | 1 |
Other installation, maintenance, and repair occupations | -- | 3 | 3 |
Line installers and repairers | 1 | 1 | 1 |
Telecommunications line installers and repairers | -- | 1 | 1 |
Production occupations | 8 | 8 | 8 |
Metal workers and plastic workers | -- | 4 | 4 |
Machine tool cutting setters, operators, and tenders, metal and plastic | -- | 1 | 1 |
Cutting, punching, and press machine setters, operators, and tenders, metal and plastic | -- | 1 | 1 |
Woodworkers | -- | 1 | 1 |
Woodworking machine setters, operators, and tenders | -- | 1 | 1 |
Sawing machine setters, operators, and tenders, wood | -- | 1 | 1 |
Plant and system operators | -- | 1 | 1 |
Power plant operators, distributors, and dispatchers | -- | 1 | 1 |
Power plant operators | -- | 1 | 1 |
Transportation and material moving occupations | 26 | 42 | 42 |
Air transportation workers | 1 | 1 | 1 |
Aircraft pilots and flight engineers | 1 | 1 | 1 |
Commercial pilots | 1 | 1 | 1 |
Motor vehicle operators | 24 | 36 | 36 |
Driver/sales workers and truck drivers | 23 | 35 | 35 |
Heavy and tractor-trailer truck drivers | 22 | 31 | 31 |
Light truck or delivery services drivers | -- | 4 | 4 |
Material moving workers | -- | 5 | 5 |
Refuse and recyclable material collectors | -- | 1 | 1 |
Footnotes: | |||
NOTE: Totals for major categories may include subcategories not shown separately. Percentages may not add to totals because of rounding. CFOI fatality counts exclude illness-related deaths unless precipitated by an injury event. Dashes indicate no data reported or data that do not meet publication criteria. | |||
| Worker characteristics | 2015 | 2016 | |
|---|---|---|---|
| Number | Number | Percent | |
Total | 70 | 100 | 100 |
Employee status | |||
Wage and salary workers (1) | 61 | 92 | 92 |
Self-employed (2) | 9 | 8 | 8 |
Gender | |||
Men | 63 | 92 | 92 |
Women | 7 | 8 | 8 |
Age (3) | |||
20 to 24 years | 6 | 3 | 3 |
25 to 34 years | 11 | 16 | 16 |
35 to 44 years | 12 | 18 | 18 |
45 to 54 years | 19 | 29 | 29 |
55 to 64 years | 13 | 23 | 23 |
65 years and over | 8 | 10 | 10 |
Race or ethnic origin (4) | |||
White, non-Hispanic | 47 | 62 | 62 |
Black or African-American, non-Hispanic | 18 | 32 | 32 |
Hispanic or Latino | 3 | 5 | 5 |
Footnotes: | |||
NOTE: Data for all years are final. Totals for major categories may include subcategories not shown separately. Percentages may not add to totals because of rounding. CFOI fatality counts exclude illness-related deaths unless precipitated by an injury event. Dashes indicate no data reported or data that do not meet publication criteria. | |||
Last Modified Date: Wednesday, February 21, 2018