
When BLS released The Employment Situation for January 2022 on February 4, we reported larger-than-normal revisions to the seasonally adjusted monthly nonfarm employment estimates from the Current Employment Statistics survey. Let’s take a closer look at the seasonal adjustment process and explain why the revisions were unusually large.
BLS seasonally adjusts data to account for recurring seasonal patterns in a time series. It allows our data users to analyze the underlying trends without the influence of seasonal movements. Seasonal movements might entail hiring extra retail trade workers around the December holidays. Seasonal movements also may entail workers leaving payrolls, such as school bus drivers when the schoolyear ends. These types of movements happen around the same time every year and affect about the same number of workers each year. Because the seasonal movements in nonfarm employment typically don’t change by much year to year, revisions to over-the-month changes from seasonal adjustment are typically small. However, data users may have a hard time seeing seasonal patterns when large events like strikes, hurricanes, or recessions occur. The unprecedented changes brought on by the COVID-19 pandemic make it even more difficult to determine the seasonal patterns.
Every year, during the employment benchmarking process, BLS staff takes a more comprehensive look back at the seasonal adjustment of time series to account for changes in seasonal patterns of nonfarm employment. Months in which large, irregular events occur are treated as outliers, which means that the abnormal change will not be treated as a new seasonal pattern. When we seasonally adjusted the data for 2020 after 2020 had ended, we treated several months individually as outliers. That works well for short-lived events, like strikes or a weather-related event. At that time, with very few observations after the start of the pandemic, that type of individual outlier detection was appropriate.
For example, the economy lost a massive number of jobs in March and April 2020 at the start of the pandemic. If we had not treated those months as outliers, or irregular events, the seasonal adjustment model would have expected massive employment losses as a new seasonal pattern for March and April 2021. That would not have been appropriate because those huge losses in March and April 2020 were not likely to recur. If the model had included the large March and April 2020 employment losses, when large job losses did not occur in March and April 2021, the model would have shown large job gains for those months on a seasonally adjusted basis. That would have distorted the underlying employment trend.
We now have more data observations after the start of the pandemic, and we benefit from the hindsight of our normal annual review of the data, which encompasses the last 5 years of data. We incorporated two additional outlier types that better isolated the initial losses in employment from the pandemic, while simultaneously accounting for new seasonal patterns that we have detected. One new type of outlier accounts for a temporary change in the level of the series. For example, drinking places that serve alcoholic beverages experienced a significant employment decline in April 2020 but have gained jobs since then, even if in fits and starts. In this case, we treated April 2020 as a temporary change outlier, which will adjust the months from April 2020 forward to account for both the large drop and subsequent recovery in employment this industry has experienced. This will better account for this temporary period of readjustment as employment levels recover towards what they were before the pandemic.
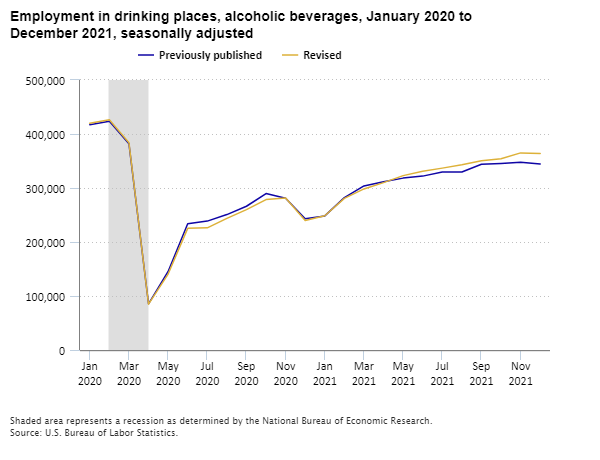
Editor’s note: Data for this chart are available in the table below.
The other new type of outlier accounts for a permanent shift in the level of a series. An example of this is nursing care facilities, which continued to experience employment declines after April 2020. In this case, April 2020 was treated as a level shift outlier, which resulted in subsequent months being adjusted to better reflect the continued lower level of employment.
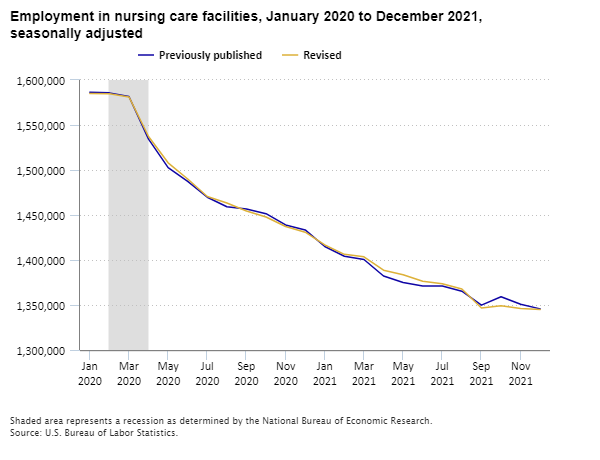
Editor’s note: Data for this chart are available in the table below.
Incorporating these additional types of outliers stabilized the normal seasonal patterns and smoothed out the initial large swings in the seasonally adjusted data. These changes resulted in a more accurate payroll employment series and will allow users to better differentiate longer-term trends from seasonal movements.
These changes resulted in some large revisions to our monthly seasonally adjusted data for 2021, although the revisions partly offset each other. For example, total nonfarm employment in November and December 2021 combined is 709,000 higher than previously reported, while employment in June and July 2021 combined is 807,000 lower. The change for all of 2021 is just 217,000 higher than previously reported. Although these revisions are larger than usual, trends in the data emerge more clearly.
Want to really dig into the details of seasonal adjustment for the nonfarm employment data? See our specification files and technical documentation.
| Month | Previously published | Revised |
|---|---|---|
Jan 2020 | 417,200 | 419,800 |
Feb 2020 | 423,700 | 426,400 |
Mar 2020 | 381,800 | 383,600 |
Apr 2020 | 85,600 | 84,800 |
May 2020 | 145,400 | 140,600 |
Jun 2020 | 233,800 | 225,300 |
Jul 2020 | 238,700 | 226,200 |
Aug 2020 | 250,800 | 243,800 |
Sep 2020 | 266,200 | 260,000 |
Oct 2020 | 289,700 | 278,500 |
Nov 2020 | 280,900 | 281,300 |
Dec 2020 | 243,000 | 239,700 |
Jan 2021 | 248,300 | 248,700 |
Feb 2021 | 282,200 | 280,700 |
Mar 2021 | 303,900 | 298,300 |
Apr 2021 | 311,700 | 309,900 |
May 2021 | 318,300 | 322,900 |
Jun 2021 | 322,000 | 331,200 |
Jul 2021 | 329,700 | 336,800 |
Aug 2021 | 329,500 | 342,900 |
Sep 2021 | 343,900 | 350,600 |
Oct 2021 | 345,500 | 354,200 |
Nov 2021 | 347,900 | 365,000 |
Dec 2021 | 344,500 | 363,800 |
| Month | Previously published | Revised |
|---|---|---|
Jan 2020 | 1,586,500 | 1,585,100 |
Feb 2020 | 1,585,700 | 1,584,800 |
Mar 2020 | 1,581,600 | 1,581,200 |
Apr 2020 | 1,534,300 | 1,537,200 |
May 2020 | 1,502,600 | 1,508,000 |
Jun 2020 | 1,487,300 | 1,490,000 |
Jul 2020 | 1,469,700 | 1,470,600 |
Aug 2020 | 1,459,200 | 1,463,300 |
Sep 2020 | 1,456,600 | 1,454,500 |
Oct 2020 | 1,451,500 | 1,447,800 |
Nov 2020 | 1,439,000 | 1,437,200 |
Dec 2020 | 1,433,400 | 1,430,900 |
Jan 2021 | 1,415,000 | 1,416,700 |
Feb 2021 | 1,404,200 | 1,406,300 |
Mar 2021 | 1,400,500 | 1,403,600 |
Apr 2021 | 1,382,200 | 1,388,700 |
May 2021 | 1,375,000 | 1,383,700 |
Jun 2021 | 1,371,100 | 1,376,300 |
Jul 2021 | 1,371,000 | 1,373,700 |
Aug 2021 | 1,365,300 | 1,367,700 |
Sep 2021 | 1,349,800 | 1,346,700 |
Oct 2021 | 1,359,100 | 1,349,200 |
Nov 2021 | 1,350,900 | 1,346,000 |
Dec 2021 | 1,345,700 | 1,345,100 |