
Inflation has been in the news—and on all of our minds—in recent months. Indeed, BLS price indexes have been prominent in nearly every inflation story. You may be familiar with the Consumer Price Index, which measures changes in the prices consumers pay for goods and services. You may be less familiar with the Producer Price Indexes (PPI), which measure price changes from the perspective of businesses.
The headline PPIs are the Final Demand-Intermediate Demand (FD-ID) Indexes. These indexes measure changes in the prices businesses receive for goods, services, and construction sold to end users (final demand) and to other businesses as inputs to production (intermediate demand). From July 2021 to July 2022, the Producer Price Index for Final Demand rose 9.8 percent.
BLS recently introduced two special grouping indexes that break government purchases into defense and nondefense purchases. I’ll say more below about these new groupings, but let’s first look at the variety of PPI data we publish.
PPI Basics
The PPI measures price change for more than 10,000 products and groups of products. We organize these items in many ways to show price change for categories of interest. We group the FD-ID indexes by the type of product sold. Within final demand, the three main indexes are final demand goods, final demand services, and final demand construction. These indexes measure price changes for products intended for personal consumption, capital investment, government, and export.
The main intermediate demand indexes are processed goods for intermediate demand, unprocessed goods for intermediate demand, and services for intermediate demand. These indexes measure price changes for business-to-business sales of fabricated goods, unfabricated goods, and services used as inputs to production.
In addition to the breakouts highlighted in the PPI news release, BLS also publishes special grouping indexes that further divide final demand and intermediate demand in useful ways.
The most popular special indexes are often called “core” indexes. These indexes remove historically volatile components, which may make it easier to understand the underlying rate of inflation. For example, you may have seen news stories that mention the special index for final demand less foods, energy, and trade services.
Indexes for Type of Buyer
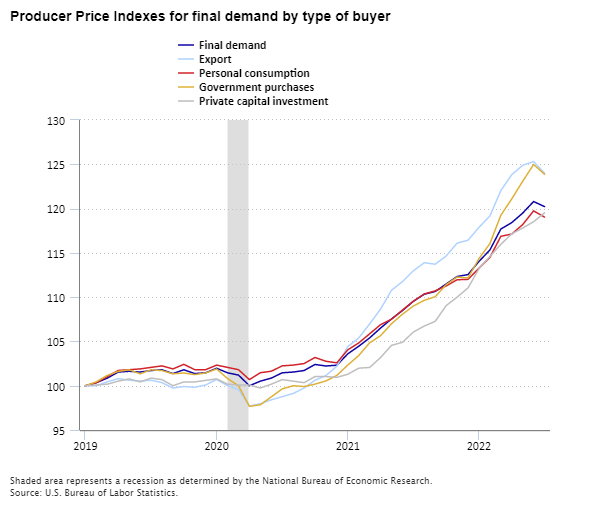
A second set of special grouping final demand indexes organizes PPI data by type of buyer, based on Gross Domestic Product categories. These categories include personal consumption, private capital investment, government purchases, and exports. (The PPI measures price changes for domestic producers and thus excludes import prices.) Organizing final demand by type of buyer, rather than type of product, helps us identify when different categories of buyers experience differing rates of inflation.
The chart below shows the special grouping indexes for final demand by buyer type from January 2019 through July 2022. (For comparison purposes, these indexes are rebased to 100 in January 2019.) The chart highlights how different end-use buyers can experience different rates of inflation.
Editor’s note: Data for this chart are available in the table below.
At the beginning of the COVID-19 pandemic, prices for exports and government purchases initially dropped more than prices for personal consumption and capital investment. From January 2020 through April 2020, prices for exports decreased 3.0 percent and prices for government purchases fell 4.1 percent. At the same time, prices declined 1.6 percent for personal consumption and 0.7 percent for private capital investment. From April 2020 through July 2022, prices jumped 26.9 percent for exports and 26.8 percent for government purchases, compared with increases of 18.1 percent for personal consumption and 19.5 percent for private capital investment.
Indexes for Government Purchases of Goods and Services
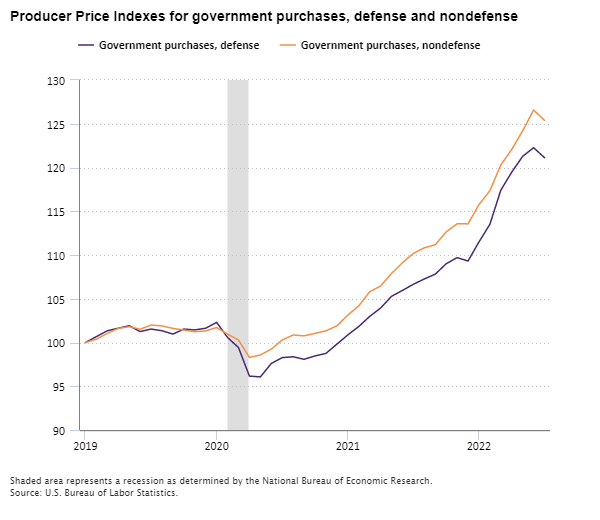
Now let’s examine the new special grouping indexes for government defense and nondefense purchases. The most highly weighted items in the defense index include military aircraft; engineering services; jet fuel; search detection, navigation and guidance systems and equipment; and machinery and equipment wholesaling. The most highly weighted items in the nondefense index consist of new school building construction, portfolio management, commercial electric power, diesel fuel, and property and casualty insurance.
The chart below presents the new government purchases indexes from January 2019 through July 2022. (Again, for comparison purposes these indexes are rebased to 100 in January 2019.) Although the two indexes move similarly, there is one notable difference. Prices for defense purchases fell more sharply than prices for nondefense purchases at the start of the COVID-19 pandemic. Both indexes moved higher beginning in mid-2020, but prices for government defense purchases have increased more slowly than for nondefense purchases.
Editor’s note: Data for this chart are available in the table below.
Indexes for Distributive Services
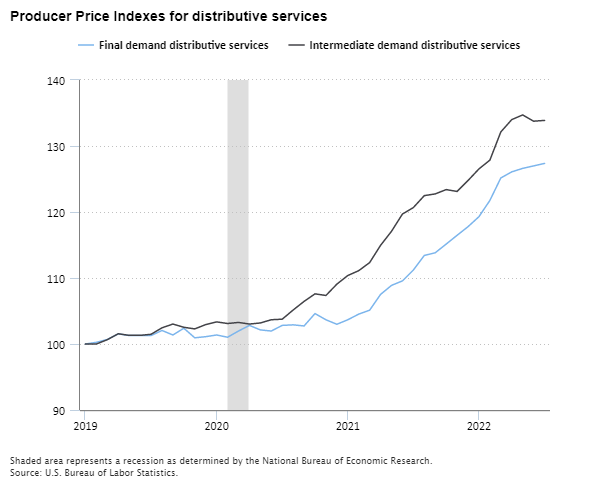
A third set of special grouping indexes are for distributive services. These indexes are particularly relevant now, given recent issues in U.S. and global supply chains. These indexes measure price changes for services associated with distributing goods sold to final demand and intermediate demand. Distributive services include transporting, storing, and reselling goods.
The chart below presents the indexes for final demand distributive services and intermediate demand distributive services from January 2019 through July 2022. The final demand distributive services index measures price changes for distributing goods sold to final demand (personal consumption, capital investment, government purchases, and exports). The intermediate demand distributive services index measures price changes for services associated with distributing goods sold to other businesses as inputs to production.
Editor’s note: Data for this chart are available in the table below.
Both distributive services indexes rose sharply from 2019 through 2022. Notably, neither index showed the dip at the beginning of the COVID-19 pandemic that happened with many other BLS price indexes. The intermediate demand distributive services index rose nearly 30 percent since March 2020, compared with approximately 25 percent for final demand distributive services. The larger increase in prices for business-to-business distributive services potentially highlights supply chain issues early in the production pipeline.
These are just some of the special groupings available for the PPI. You can see the full list of special grouping final demand and intermediate demand indexes in table 1 of the PPI news release.
| Month | Final demand | Export | Personal consumption | Government purchases | Private capital investment |
|---|---|---|---|---|---|
Jan 2019 | 100.000 | 100.000 | 100.000 | 100.000 | 100.000 |
Feb 2019 | 100.343 | 100.000 | 100.345 | 100.448 | 100.086 |
Mar 2019 | 100.857 | 100.442 | 101.034 | 101.166 | 100.172 |
Apr 2019 | 101.542 | 100.795 | 101.724 | 101.614 | 100.516 |
May 2019 | 101.628 | 100.618 | 101.810 | 101.794 | 100.774 |
Jun 2019 | 101.542 | 100.530 | 101.897 | 101.345 | 100.430 |
Jul 2019 | 101.714 | 100.618 | 102.069 | 101.794 | 100.860 |
Aug 2019 | 101.799 | 100.353 | 102.241 | 101.704 | 100.688 |
Sep 2019 | 101.371 | 99.735 | 101.897 | 101.345 | 100.000 |
Oct 2019 | 101.799 | 99.912 | 102.414 | 101.435 | 100.430 |
Nov 2019 | 101.371 | 99.823 | 101.810 | 101.256 | 100.430 |
Dec 2019 | 101.457 | 100.088 | 101.810 | 101.435 | 100.602 |
Jan 2020 | 101.971 | 100.707 | 102.328 | 101.883 | 100.774 |
Feb 2020 | 101.457 | 100.000 | 102.069 | 100.807 | 100.172 |
Mar 2020 | 101.200 | 99.558 | 101.810 | 100.000 | 100.086 |
Apr 2020 | 100.000 | 97.703 | 100.690 | 97.668 | 100.086 |
May 2020 | 100.514 | 97.968 | 101.466 | 97.848 | 99.742 |
Jun 2020 | 100.857 | 98.410 | 101.638 | 98.744 | 100.172 |
Jul 2020 | 101.457 | 98.763 | 102.241 | 99.641 | 100.688 |
Aug 2020 | 101.542 | 99.117 | 102.328 | 100.000 | 100.516 |
Sep 2020 | 101.714 | 99.735 | 102.500 | 99.910 | 100.344 |
Oct 2020 | 102.399 | 100.618 | 103.190 | 100.179 | 101.032 |
Nov 2020 | 102.228 | 101.148 | 102.759 | 100.538 | 101.032 |
Dec 2020 | 102.314 | 102.208 | 102.586 | 101.166 | 100.946 |
Jan 2021 | 103.599 | 104.417 | 104.052 | 102.332 | 101.290 |
Feb 2021 | 104.456 | 105.389 | 104.828 | 103.408 | 101.978 |
Mar 2021 | 105.398 | 106.979 | 105.862 | 104.843 | 102.064 |
Apr 2021 | 106.512 | 108.657 | 106.897 | 105.650 | 103.181 |
May 2021 | 107.541 | 110.777 | 107.500 | 106.996 | 104.557 |
Jun 2021 | 108.483 | 111.749 | 108.534 | 108.072 | 104.901 |
Jul 2021 | 109.532 | 112.973 | 109.543 | 108.996 | 106.063 |
Aug 2021 | 110.330 | 113.887 | 110.360 | 109.641 | 106.740 |
Sep 2021 | 110.639 | 113.716 | 110.711 | 110.048 | 107.269 |
Oct 2021 | 111.480 | 114.644 | 111.262 | 111.408 | 109.044 |
Nov 2021 | 112.331 | 116.096 | 111.962 | 112.271 | 109.996 |
Dec 2021 | 112.548 | 116.431 | 112.008 | 112.168 | 111.042 |
Jan 2022 | 114.031 | 117.875 | 113.262 | 114.346 | 113.212 |
Feb 2022 | 115.322 | 119.163 | 114.484 | 116.048 | 114.586 |
Mar 2022 | 117.687 | 122.023 | 116.866 | 119.236 | 115.960 |
Apr 2022 | 118.414 | 123.824 | 117.125 | 121.090 | 117.153 |
May 2022 | 119.489 | 124.885 | 118.190 | 123.078 | 117.801 |
Jun 2022 | 120.793 | 125.305 | 119.741 | 124.975 | 118.516 |
Jul 2022 | 120.223 | 124.008 | 119.038 | 123.879 | 119.514 |
| Month | Government purchases, defense | Government purchases, nondefense |
|---|---|---|
Jan 2019 | 100.000 | 100.000 |
Feb 2019 | 100.672 | 100.380 |
Mar 2019 | 101.344 | 101.045 |
Apr 2019 | 101.631 | 101.614 |
May 2019 | 101.919 | 101.804 |
Jun 2019 | 101.248 | 101.519 |
Jul 2019 | 101.536 | 101.994 |
Aug 2019 | 101.344 | 101.899 |
Sep 2019 | 100.960 | 101.614 |
Oct 2019 | 101.536 | 101.425 |
Nov 2019 | 101.440 | 101.235 |
Dec 2019 | 101.631 | 101.330 |
Jan 2020 | 102.303 | 101.709 |
Feb 2020 | 100.576 | 100.950 |
Mar 2020 | 99.424 | 100.285 |
Apr 2020 | 96.161 | 98.291 |
May 2020 | 96.065 | 98.575 |
Jun 2020 | 97.601 | 99.240 |
Jul 2020 | 98.273 | 100.285 |
Aug 2020 | 98.369 | 100.855 |
Sep 2020 | 98.081 | 100.760 |
Oct 2020 | 98.464 | 101.045 |
Nov 2020 | 98.752 | 101.330 |
Dec 2020 | 99.808 | 101.899 |
Jan 2021 | 100.864 | 103.134 |
Feb 2021 | 101.823 | 104.179 |
Mar 2021 | 102.975 | 105.793 |
Apr 2021 | 103.935 | 106.458 |
May 2021 | 105.278 | 107.882 |
Jun 2021 | 105.950 | 109.117 |
Jul 2021 | 106.656 | 110.179 |
Aug 2021 | 107.261 | 110.821 |
Sep 2021 | 107.808 | 111.176 |
Oct 2021 | 108.995 | 112.638 |
Nov 2021 | 109.702 | 113.563 |
Dec 2021 | 109.312 | 113.556 |
Jan 2022 | 111.486 | 115.760 |
Feb 2022 | 113.509 | 117.346 |
Mar 2022 | 117.406 | 120.283 |
Apr 2022 | 119.475 | 122.065 |
May 2022 | 121.279 | 124.189 |
Jun 2022 | 122.261 | 126.568 |
Jul 2022 | 121.121 | 125.379 |
| Month | Final demand distributive services | Intermediate demand distributive services |
|---|---|---|
Jan 2019 | 100.000 | 100.000 |
Feb 2019 | 100.256 | 100.000 |
Mar 2019 | 100.683 | 100.654 |
Apr 2019 | 101.537 | 101.552 |
May 2019 | 101.281 | 101.307 |
Jun 2019 | 101.281 | 101.307 |
Jul 2019 | 101.281 | 101.471 |
Aug 2019 | 102.050 | 102.451 |
Sep 2019 | 101.366 | 103.023 |
Oct 2019 | 102.391 | 102.533 |
Nov 2019 | 100.939 | 102.288 |
Dec 2019 | 101.110 | 102.941 |
Jan 2020 | 101.366 | 103.350 |
Feb 2020 | 101.025 | 103.105 |
Mar 2020 | 101.964 | 103.268 |
Apr 2020 | 102.818 | 103.023 |
May 2020 | 102.135 | 103.186 |
Jun 2020 | 101.964 | 103.676 |
Jul 2020 | 102.818 | 103.758 |
Aug 2020 | 102.904 | 105.147 |
Sep 2020 | 102.733 | 106.454 |
Oct 2020 | 104.611 | 107.598 |
Nov 2020 | 103.672 | 107.353 |
Dec 2020 | 102.989 | 109.069 |
Jan 2021 | 103.672 | 110.376 |
Feb 2021 | 104.526 | 111.111 |
Mar 2021 | 105.124 | 112.337 |
Apr 2021 | 107.515 | 114.951 |
May 2021 | 108.881 | 117.075 |
Jun 2021 | 109.564 | 119.690 |
Jul 2021 | 111.207 | 120.672 |
Aug 2021 | 113.412 | 122.481 |
Sep 2021 | 113.825 | 122.740 |
Oct 2021 | 115.137 | 123.395 |
Nov 2021 | 116.470 | 123.114 |
Dec 2021 | 117.774 | 124.770 |
Jan 2022 | 119.292 | 126.529 |
Feb 2022 | 121.753 | 127.859 |
Mar 2022 | 125.159 | 132.128 |
Apr 2022 | 126.081 | 133.998 |
May 2022 | 126.610 | 134.707 |
Jun 2022 | 126.983 | 133.757 |
Jul 2022 | 127.362 | 133.879 |