
This time of year, it is common to see news stories that track the price of your Thanksgiving dinner. And with the Consumer Price Index (CPI) reaching 40-year highs in recent months, such stories are likely to get some attention. More on current price data below. But first, a look at the BLS archives from 1947. My, have times changed!
We learned from our records from the late 1940s and early 1950s that BLS conducted a special collection of “typical Thanksgiving dinner” prices in selected cities the week before the holiday. A copy of the Washington, DC, area release for 1947 is below.
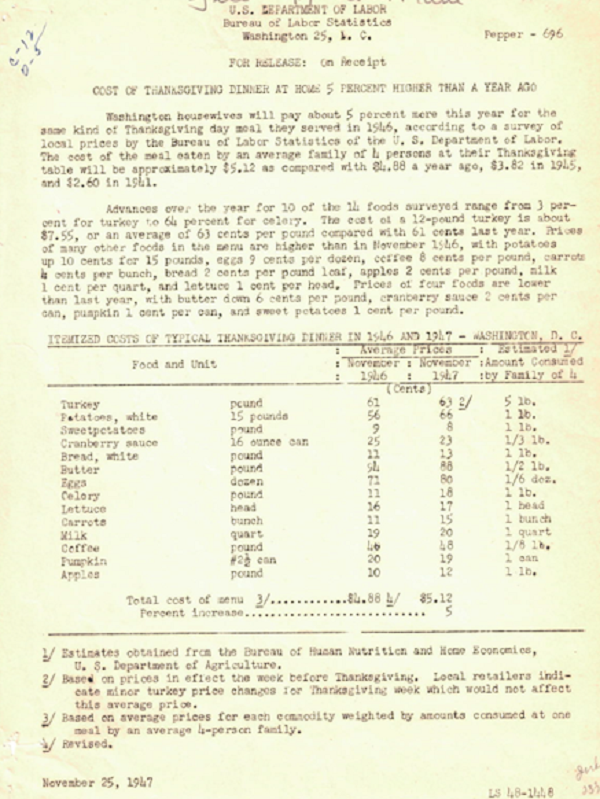
Some things that stand out:
- Apparently only “housewives” handled the Thanksgiving shopping and cooking 75 years ago!
- If you add up the numbers in the table, you don’t get the total. Why? The calculation was designed to estimate what a family of four would consume at Thanksgiving dinner, rather than what was actually purchased. So, while the turkey cost 63 cents per pound and, as the text indicates, a 12-pound turkey cost about $7.55, the family of four only consumed 5 pounds at dinner, adding $3.15 to the total cost of the menu. Likewise, they only consumed “1/6 doz” eggs (I think that means 2 eggs), so at 80 cents a dozen, the eggs amounted to 13.3 cents toward the total.
- As indicated in the footnotes, estimates of food consumed came from the U.S. Department of Agriculture.
Confused? So was BLS. Among our archives, we found memos suggesting that, while the year-over-year increase was easy to explain, the methodology was not. And at least one senior BLS official got tongue-tied trying to explain the numbers in a radio interview, which ultimately led to the discontinuation of this news release after about 5 years.
More 1940s data
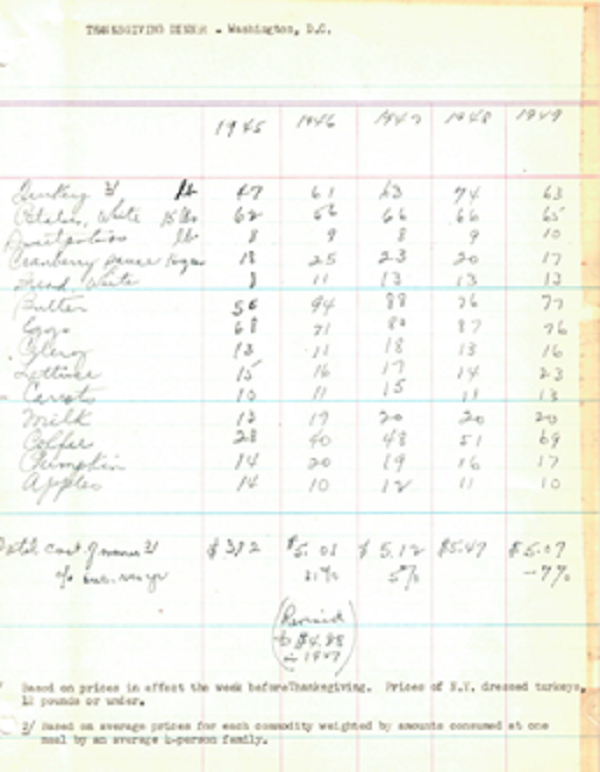
But not before BLS constructed a time series—in the only way we knew how in the 1940s, as the following image illustrates. And in keeping with the best BLS traditions, there was even a revision to the 1946 data. Back then, we went out of our way to get things right, and we do the same today.
Fast forward 75 years
If you want to track the cost of your holiday meal today, you need look no further than the BLS Consumer Price Index. Most of the items listed in the 1947 Thanksgiving release are available in the monthly CPI release, covering all urban consumers. The following chart provides the 12-month percent change for these items in 2022.
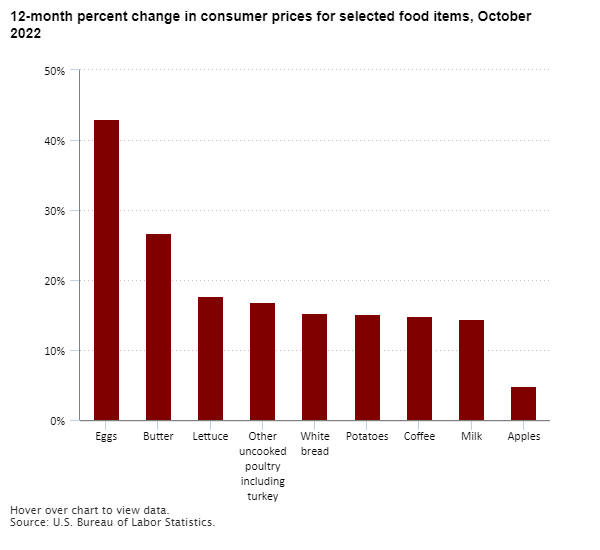
Editor’s note: Data for this chart are available in the table below.
The BLS archives are a treasure trove of stories, some that track the economic details of the day, and some that shed light on BLS people and processes. As we uncover more gems, we’ll be sure to share.
| Food item | Percent change |
|---|---|
Eggs | 43.0% |
Butter | 26.7 |
Lettuce | 17.7 |
Other uncooked poultry including turkey | 16.9 |
White bread | 15.3 |
Potatoes | 15.2 |
Coffee | 14.8 |
Milk | 14.5 |
Apples | 4.8 |