
Thanksgiving is right around the corner. As we start to think about how we will celebrate, it might be hard to imagine the ties between BLS statistics and celebrating Thanksgiving. So, here’s a short tour of a typical Thanksgiving Day as seen through a few BLS statistics. Enjoy!
9:00 a.m. Put the turkey in the oven
All good chefs know the key to a successful Thanksgiving feast is to get the turkey in the oven bright and early. Whether you are roasting your turkey or firing up a deep fryer in the driveway, you will have to pay more for the fuel. The Consumer Price Index for household energy was pretty stable through 2019 and the first half of 2020 but then started a steady rise in September 2020.
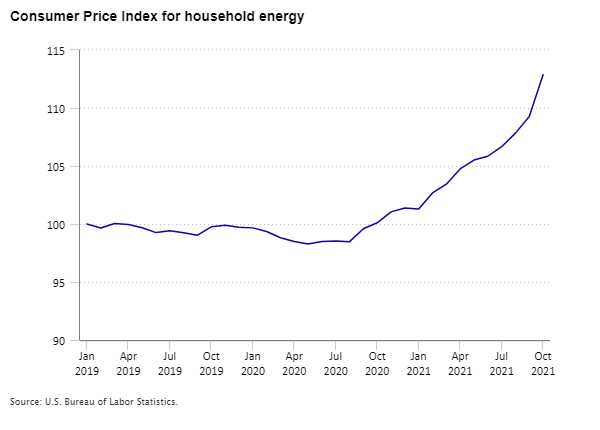
Editor’s note: Data for this chart are available in the table below.
10:00 a.m. Watch the Macy’s Thanksgiving Day parade
The COVID-19 pandemic has caused ups and downs in the labor market, much like the impact of a windy day for the famous balloons in Macy’s Thanksgiving Day Parade. Keeping with the department store theme, employment in department stores plunged 25.3 percent in April 2020 but then rose 14.1 percent June 2020. These gyrations were more dramatic than the broader retail trade sector.
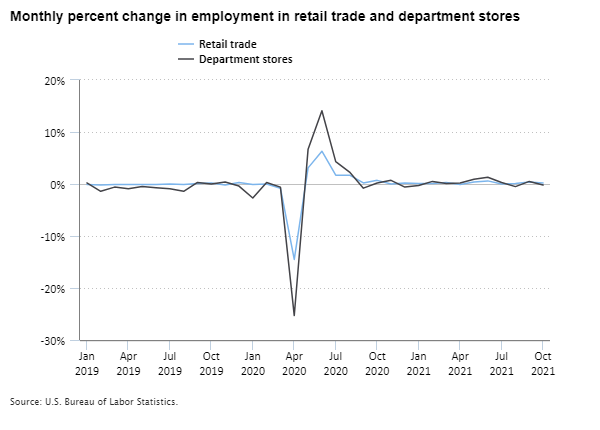
Editor’s note: Data for this chart are available in the table below.
2:00 p.m. Scope out Black Friday deals
After watching the parade, it’s time to plan our Black Friday shopping! As consumers, we are always trying to get more for less. In the retail trade industry, it turns out they are doing just that. The industry has produced more output with steady or decreasing hours worked. The result is a corresponding increase in labor productivity. Now, only if we could prepare a bigger Thanksgiving feast in less time!
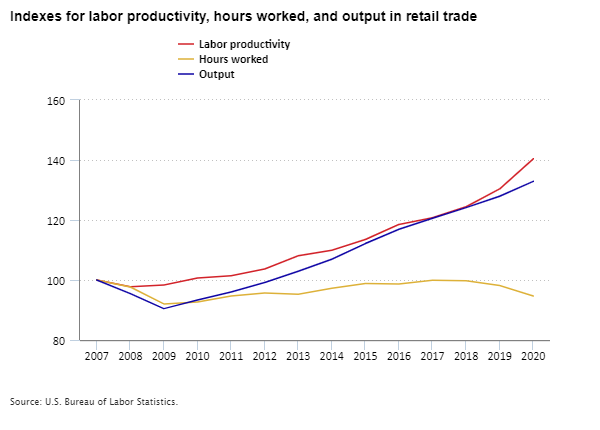
Editor’s note: Data for this chart are available in the table below.
4:00 p.m. Play touch football
We need to make some room of the feast we are about to enjoy, so we assemble willing participants and play some touch football in the yard. The American Time Use Survey is the best source of information on how Americans spend their time each day. In this case, let’s compare how much time people spend playing sports versus how much time they spend watching sports on TV. We’ll look only at time spent in these activities on weekend days and holidays. The survey does not have details on what people watch on TV, but we can assume some time reported here is spent watching sports.
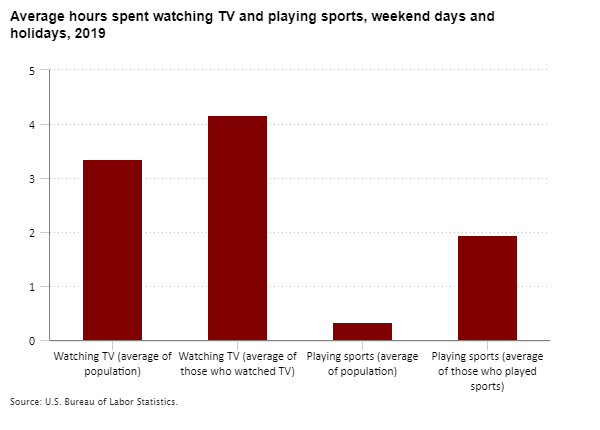
Editor’s note: Data for this chart are available in the table below.
We can see that Americans, on average, easily spend more time watching TV—3.36 hours—than playing sports—0.34 hours. But what is more interesting is that, on average, those who watch TV watch about 24 percent more than the overall population. However, those who play sports play, on average, nearly 6 times as many hours as the average for the population.
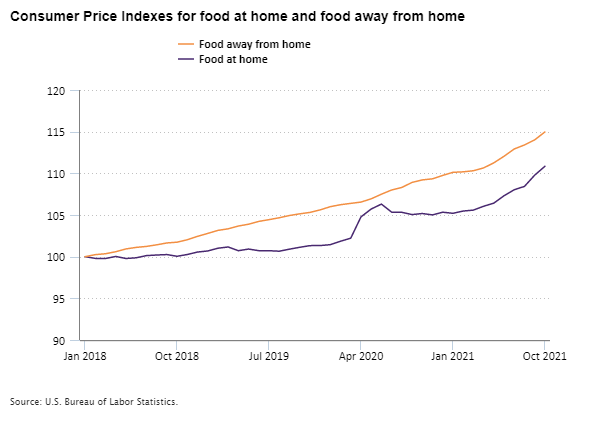
6:00 p.m. Thanksgiving feast
No matter what is on your dinner table this Thanksgiving, chances are it will cost more than previous years. All six major grocery store food groups in the Consumer Price Index for food at home continued to rise sharply in October 2021. Even if you decide to order out, it will set you back a bit more this year. Both full-service meals and limited services meals rose nearly 1 percent in October 2021.
Editor’s note: Data for this chart are available in the table below.
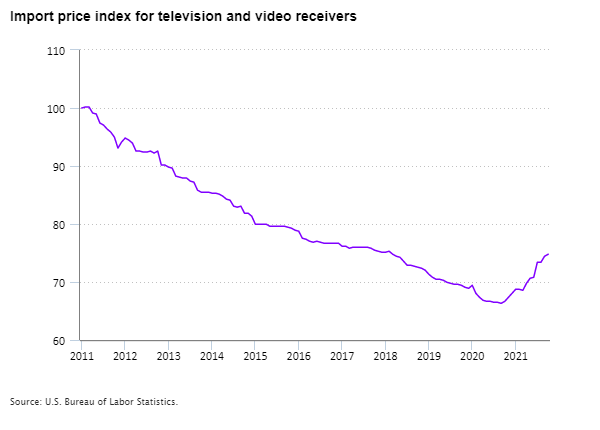
7:00 p.m. Watch football
Now that we’ve finished our delicious feast, it’s a time-honored tradition to watch a bit of football on TV. If you are buying a new TV for this holiday, you can expect to pay a bit more. After years of steady declines, import prices for television and video receivers have reversed trend in 2021, much like a wide receiver changing direction to find an opening and catch a game-winning touchdown pass!
Editor’s note: Data for this chart are available in the table below.
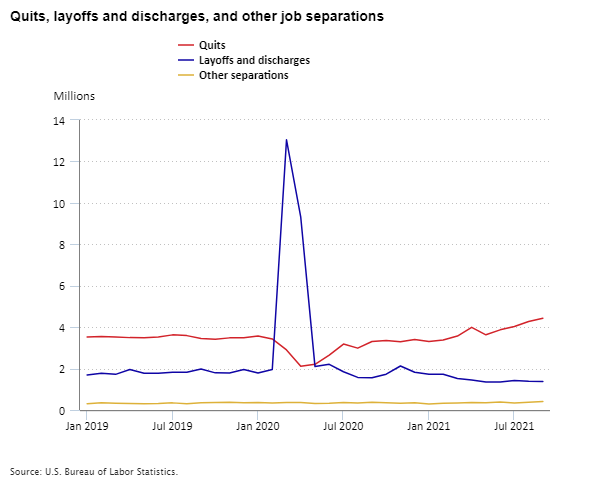
9:00 p.m. Say goodbye
It’s hard to say goodbye to your friends and family. In the United States, however, the Job Openings and Labor Turnover Survey is showing that workers are saying goodbye to their employers more often these days. The number of quits has been rising steadily since the shock of the pandemic affected layoffs and discharges in early 2020. (It’s only a coincidence that the layoffs line in the chart below looks like the outline of a pilgrim’s hat.)
Editor’s note: Data for this chart are available in the table below.
Now we’ve come to the end of our Thanksgiving feast of BLS data. Our hunger for the premier statistics on the U.S. labor force, prices, and productivity, has been satisfied, and we can rest easily knowing there’s a stat for that!
| Month | Index |
|---|---|
Jan 2019 | 100.000 |
Feb 2019 | 99.662 |
Mar 2019 | 100.046 |
Apr 2019 | 99.952 |
May 2019 | 99.679 |
Jun 2019 | 99.258 |
Jul 2019 | 99.415 |
Aug 2019 | 99.253 |
Sep 2019 | 99.033 |
Oct 2019 | 99.756 |
Nov 2019 | 99.890 |
Dec 2019 | 99.716 |
Jan 2020 | 99.666 |
Feb 2020 | 99.355 |
Mar 2020 | 98.812 |
Apr 2020 | 98.492 |
May 2020 | 98.278 |
Jun 2020 | 98.501 |
Jul 2020 | 98.542 |
Aug 2020 | 98.478 |
Sep 2020 | 99.590 |
Oct 2020 | 100.103 |
Nov 2020 | 101.043 |
Dec 2020 | 101.377 |
Jan 2021 | 101.299 |
Feb 2021 | 102.681 |
Mar 2021 | 103.436 |
Apr 2021 | 104.748 |
May 2021 | 105.512 |
Jun 2021 | 105.840 |
Jul 2021 | 106.664 |
Aug 2021 | 107.833 |
Sep 2021 | 109.273 |
Oct 2021 | 112.872 |
| Month | Retail trade | Department stores |
|---|---|---|
Jan 2019 | -0.1% | 0.2% |
Feb 2019 | -0.2 | -1.4 |
Mar 2019 | -0.1 | -0.6 |
Apr 2019 | -0.1 | -0.9 |
May 2019 | -0.1 | -0.5 |
Jun 2019 | -0.1 | -0.7 |
Jul 2019 | 0.0 | -0.9 |
Aug 2019 | -0.1 | -1.4 |
Sep 2019 | 0.1 | 0.3 |
Oct 2019 | 0.2 | 0.0 |
Nov 2019 | -0.2 | 0.4 |
Dec 2019 | 0.3 | -0.4 |
Jan 2020 | -0.1 | -2.7 |
Feb 2020 | 0.0 | 0.3 |
Mar 2020 | -0.8 | -0.6 |
Apr 2020 | -14.5 | -25.3 |
May 2020 | 3.1 | 6.7 |
Jun 2020 | 6.3 | 14.1 |
Jul 2020 | 1.7 | 4.3 |
Aug 2020 | 1.7 | 2.3 |
Sep 2020 | 0.2 | -0.8 |
Oct 2020 | 0.7 | 0.2 |
Nov 2020 | 0.0 | 0.7 |
Dec 2020 | 0.2 | -0.6 |
Jan 2021 | 0.1 | -0.3 |
Feb 2021 | 0.1 | 0.5 |
Mar 2021 | 0.3 | 0.1 |
Apr 2021 | -0.1 | 0.2 |
May 2021 | 0.4 | 0.9 |
Jun 2021 | 0.6 | 1.3 |
Jul 2021 | 0.0 | 0.3 |
Aug 2021 | 0.1 | -0.5 |
Sep 2021 | 0.4 | 0.5 |
Oct 2021 | 0.2 | -0.2 |
| Year | Labor productivity | Hours worked | Output |
|---|---|---|---|
2007 | 100.000 | 100.000 | 100.000 |
2008 | 97.765 | 97.658 | 95.475 |
2009 | 98.294 | 92.032 | 90.461 |
2010 | 100.694 | 92.667 | 93.310 |
2011 | 101.397 | 94.686 | 96.008 |
2012 | 103.655 | 95.673 | 99.170 |
2013 | 108.080 | 95.212 | 102.905 |
2014 | 109.919 | 97.268 | 106.916 |
2015 | 113.486 | 98.821 | 112.148 |
2016 | 118.525 | 98.636 | 116.908 |
2017 | 120.719 | 99.896 | 120.593 |
2018 | 124.393 | 99.783 | 124.123 |
2019 | 130.360 | 98.139 | 127.934 |
2020 | 140.392 | 94.650 | 132.880 |
| Activity | Hours |
|---|---|
Watching TV (average of population) | 3.36 |
Watching TV (average of those who watched TV) | 4.17 |
Playing sports (average of population) | 0.34 |
Playing sports (average of those who played sports) | 1.94 |
| Month | Food at home | Food away from home |
|---|---|---|
Jan 2018 | 100.000 | 100.000 |
Feb 2018 | 99.793 | 100.243 |
Mar 2018 | 99.780 | 100.352 |
Apr 2018 | 100.026 | 100.594 |
May 2018 | 99.779 | 100.929 |
Jun 2018 | 99.865 | 101.113 |
Jul 2018 | 100.127 | 101.229 |
Aug 2018 | 100.198 | 101.421 |
Sep 2018 | 100.252 | 101.645 |
Oct 2018 | 100.046 | 101.738 |
Nov 2018 | 100.259 | 102.029 |
Dec 2018 | 100.554 | 102.437 |
Jan 2019 | 100.683 | 102.789 |
Feb 2019 | 101.014 | 103.153 |
Mar 2019 | 101.163 | 103.342 |
Apr 2019 | 100.716 | 103.676 |
May 2019 | 100.913 | 103.894 |
Jun 2019 | 100.718 | 104.232 |
Jul 2019 | 100.716 | 104.443 |
Aug 2019 | 100.654 | 104.669 |
Sep 2019 | 100.902 | 104.940 |
Oct 2019 | 101.124 | 105.139 |
Nov 2019 | 101.324 | 105.310 |
Dec 2019 | 101.331 | 105.611 |
Jan 2020 | 101.440 | 106.000 |
Feb 2020 | 101.851 | 106.236 |
Mar 2020 | 102.220 | 106.395 |
Apr 2020 | 104.775 | 106.550 |
May 2020 | 105.718 | 106.942 |
Jun 2020 | 106.309 | 107.496 |
Jul 2020 | 105.343 | 108.002 |
Aug 2020 | 105.322 | 108.309 |
Sep 2020 | 105.051 | 108.911 |
Oct 2020 | 105.177 | 109.210 |
Nov 2020 | 105.012 | 109.342 |
Dec 2020 | 105.335 | 109.751 |
Jan 2021 | 105.203 | 110.122 |
Feb 2021 | 105.474 | 110.180 |
Mar 2021 | 105.587 | 110.311 |
Apr 2021 | 106.047 | 110.649 |
May 2021 | 106.423 | 111.258 |
Jun 2021 | 107.309 | 112.047 |
Jul 2021 | 108.031 | 112.923 |
Aug 2021 | 108.431 | 113.405 |
Sep 2021 | 109.779 | 114.013 |
Oct 2021 | 110.841 | 114.965 |
| Month | Index |
|---|---|
Jan 2011 | 100.000 |
Feb 2011 | 100.173 |
Mar 2011 | 100.173 |
Apr 2011 | 99.136 |
May 2011 | 98.964 |
Jun 2011 | 97.409 |
Jul 2011 | 97.064 |
Aug 2011 | 96.373 |
Sep 2011 | 95.855 |
Oct 2011 | 94.991 |
Nov 2011 | 93.092 |
Dec 2011 | 94.128 |
Jan 2012 | 94.819 |
Feb 2012 | 94.473 |
Mar 2012 | 93.955 |
Apr 2012 | 92.573 |
May 2012 | 92.573 |
Jun 2012 | 92.401 |
Jul 2012 | 92.401 |
Aug 2012 | 92.573 |
Sep 2012 | 92.228 |
Oct 2012 | 92.573 |
Nov 2012 | 90.155 |
Dec 2012 | 90.155 |
Jan 2013 | 89.810 |
Feb 2013 | 89.637 |
Mar 2013 | 88.256 |
Apr 2013 | 88.083 |
May 2013 | 87.910 |
Jun 2013 | 87.910 |
Jul 2013 | 87.392 |
Aug 2013 | 87.219 |
Sep 2013 | 85.838 |
Oct 2013 | 85.492 |
Nov 2013 | 85.492 |
Dec 2013 | 85.492 |
Jan 2014 | 85.320 |
Feb 2014 | 85.320 |
Mar 2014 | 85.147 |
Apr 2014 | 84.801 |
May 2014 | 84.283 |
Jun 2014 | 84.111 |
Jul 2014 | 83.074 |
Aug 2014 | 82.902 |
Sep 2014 | 83.074 |
Oct 2014 | 81.865 |
Nov 2014 | 81.865 |
Dec 2014 | 81.347 |
Jan 2015 | 79.965 |
Feb 2015 | 79.965 |
Mar 2015 | 79.965 |
Apr 2015 | 79.965 |
May 2015 | 79.620 |
Jun 2015 | 79.620 |
Jul 2015 | 79.620 |
Aug 2015 | 79.620 |
Sep 2015 | 79.620 |
Oct 2015 | 79.447 |
Nov 2015 | 79.275 |
Dec 2015 | 78.929 |
Jan 2016 | 78.756 |
Feb 2016 | 77.547 |
Mar 2016 | 77.375 |
Apr 2016 | 77.029 |
May 2016 | 76.857 |
Jun 2016 | 77.029 |
Jul 2016 | 76.857 |
Aug 2016 | 76.684 |
Sep 2016 | 76.684 |
Oct 2016 | 76.684 |
Nov 2016 | 76.684 |
Dec 2016 | 76.684 |
Jan 2017 | 76.166 |
Feb 2017 | 76.166 |
Mar 2017 | 75.820 |
Apr 2017 | 75.993 |
May 2017 | 75.993 |
Jun 2017 | 75.993 |
Jul 2017 | 75.993 |
Aug 2017 | 75.993 |
Sep 2017 | 75.820 |
Oct 2017 | 75.475 |
Nov 2017 | 75.302 |
Dec 2017 | 75.130 |
Jan 2018 | 75.130 |
Feb 2018 | 75.302 |
Mar 2018 | 74.784 |
Apr 2018 | 74.439 |
May 2018 | 74.266 |
Jun 2018 | 73.575 |
Jul 2018 | 72.884 |
Aug 2018 | 72.884 |
Sep 2018 | 72.712 |
Oct 2018 | 72.539 |
Nov 2018 | 72.366 |
Dec 2018 | 72.021 |
Jan 2019 | 71.330 |
Feb 2019 | 70.812 |
Mar 2019 | 70.466 |
Apr 2019 | 70.466 |
May 2019 | 70.294 |
Jun 2019 | 69.948 |
Jul 2019 | 69.775 |
Aug 2019 | 69.603 |
Sep 2019 | 69.603 |
Oct 2019 | 69.430 |
Nov 2019 | 69.085 |
Dec 2019 | 68.912 |
Jan 2020 | 69.430 |
Feb 2020 | 68.048 |
Mar 2020 | 67.358 |
Apr 2020 | 66.839 |
May 2020 | 66.667 |
Jun 2020 | 66.667 |
Jul 2020 | 66.494 |
Aug 2020 | 66.494 |
Sep 2020 | 66.321 |
Oct 2020 | 66.667 |
Nov 2020 | 67.358 |
Dec 2020 | 68.048 |
Jan 2021 | 68.739 |
Feb 2021 | 68.739 |
Mar 2021 | 68.566 |
Apr 2021 | 69.775 |
May 2021 | 70.639 |
Jun 2021 | 70.812 |
Jul 2021 | 73.402 |
Aug 2021 | 73.402 |
Sep 2021 | 74.439 |
Oct 2021 | 74.784 |
| Month | Quits | Layoffs and discharges | Other separations |
|---|---|---|---|
Jan 2019 | 3,521,000 | 1,689,000 | 301,000 |
Feb 2019 | 3,543,000 | 1,769,000 | 353,000 |
Mar 2019 | 3,524,000 | 1,721,000 | 331,000 |
Apr 2019 | 3,494,000 | 1,954,000 | 313,000 |
May 2019 | 3,487,000 | 1,776,000 | 307,000 |
Jun 2019 | 3,527,000 | 1,771,000 | 316,000 |
Jul 2019 | 3,627,000 | 1,826,000 | 344,000 |
Aug 2019 | 3,591,000 | 1,825,000 | 306,000 |
Sep 2019 | 3,449,000 | 1,982,000 | 345,000 |
Oct 2019 | 3,414,000 | 1,793,000 | 359,000 |
Nov 2019 | 3,482,000 | 1,788,000 | 374,000 |
Dec 2019 | 3,487,000 | 1,952,000 | 354,000 |
Jan 2020 | 3,568,000 | 1,788,000 | 358,000 |
Feb 2020 | 3,430,000 | 1,953,000 | 332,000 |
Mar 2020 | 2,902,000 | 13,046,000 | 360,000 |
Apr 2020 | 2,107,000 | 9,307,000 | 368,000 |
May 2020 | 2,206,000 | 2,096,000 | 316,000 |
Jun 2020 | 2,646,000 | 2,204,000 | 331,000 |
Jul 2020 | 3,182,000 | 1,845,000 | 365,000 |
Aug 2020 | 2,987,000 | 1,573,000 | 342,000 |
Sep 2020 | 3,307,000 | 1,555,000 | 373,000 |
Oct 2020 | 3,352,000 | 1,728,000 | 347,000 |
Nov 2020 | 3,296,000 | 2,123,000 | 325,000 |
Dec 2020 | 3,407,000 | 1,823,000 | 352,000 |
Jan 2021 | 3,306,000 | 1,724,000 | 294,000 |
Feb 2021 | 3,383,000 | 1,723,000 | 323,000 |
Mar 2021 | 3,568,000 | 1,525,000 | 343,000 |
Apr 2021 | 3,992,000 | 1,450,000 | 360,000 |
May 2021 | 3,630,000 | 1,353,000 | 347,000 |
Jun 2021 | 3,870,000 | 1,354,000 | 389,000 |
Jul 2021 | 4,028,000 | 1,423,000 | 341,000 |
Aug 2021 | 4,270,000 | 1,385,000 | 378,000 |
Sep 2021 | 4,434,000 | 1,375,000 | 410,000 |