
If you’ve filled your car’s gas tank recently, you may have been surprised at how much more gas costs than it did just a few months ago or in early 2020 after the COVID-19 pandemic took hold. In recent months, gasoline prices have increased sharply and have pushed up overall consumer inflation. We documented the dramatic price declines for petroleum products that occurred in early 2020 in a recent Monthly Labor Review article. The article also documented the partial recovery in prices last summer.
Let’s now look at what has happened with oil and gas prices since we published that article. We’ll see that gasoline prices mostly just recovered from the steep declines experienced early in the pandemic.
The following chart shows the monthly percent change in the Consumer Price Index (CPI) for gasoline and for all items since October 2020.
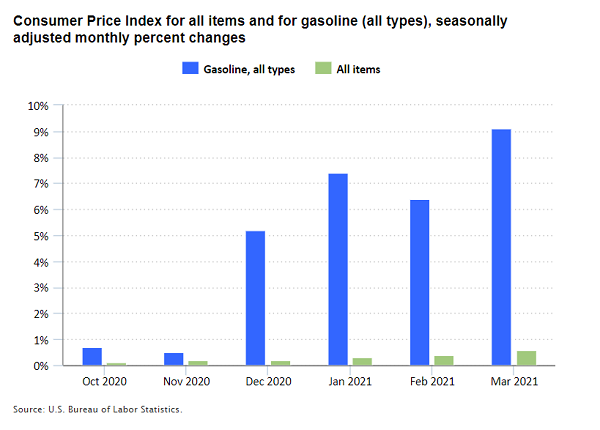
Editor’s note: Data for this chart are available in the table below.
After smaller increases in October and November, the CPI gasoline index rose much more rapidly in December and the first 3 months of 2021. Overall, in the 4 months from November to March, gasoline prices increased about 31 percent. Over the same 4 months, the CPI for all items increased 1.5 percent.
Meanwhile, the increase in gasoline prices as measured by the Producer Price Index (PPI) has been larger than the increase in consumer prices. In the last 4 months, the PPI gasoline index increased about 58 percent.
The following chart shows the change in the CPI and PPI gasoline indexes since January 2020.
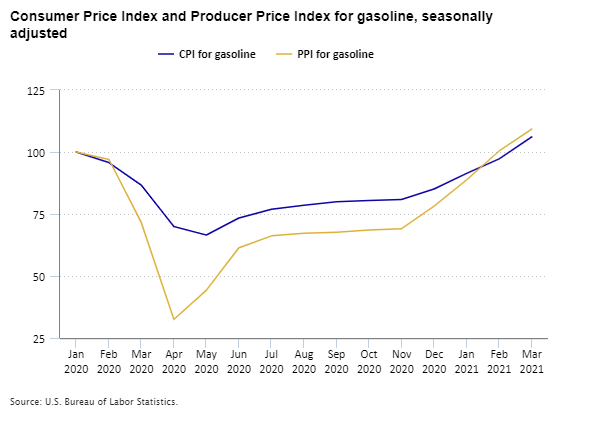
Editor’s note: Data for this chart are available in the table below.
Gasoline prices fell sharply at the start of the pandemic and then partially rebounded through the summer of 2020. The prices that gasoline producers received declined much more at the start of the pandemic than did the prices consumers paid. Producer prices also were slower to recover than consumer prices. The recent increase in gasoline prices continued the recovery from the sharp declines at the start of the pandemic. Through February 2021, consumer prices for gasoline were still down 2.8 percent from January 2020. Producer prices for gasoline had fully recovered the pandemic-related declines by February 2021 and were back to January 2020 levels. In March 2021, consumer and producer prices for gasoline rose sharply and were above their January 2020 levels.
The differences between consumer and producer gasoline prices can be partly explained by larger margins for fuel retailers. Gasoline retailers are often slower to pass increases or decreases in their purchase costs on to consumers because they are uncertain about future costs and because of competition in the retail gasoline market. The PPI for “automotive fuels and lubricants retailing” measures the margin for gasoline retailers. The chart below shows that this margin increased sharply in March and April 2020 when oil prices dropped. The margin then decreased over the summer months as oil prices increased. In March 2021, retail gasoline margins were still 16.6 percent above January 2020 levels, in seasonally unadjusted terms.
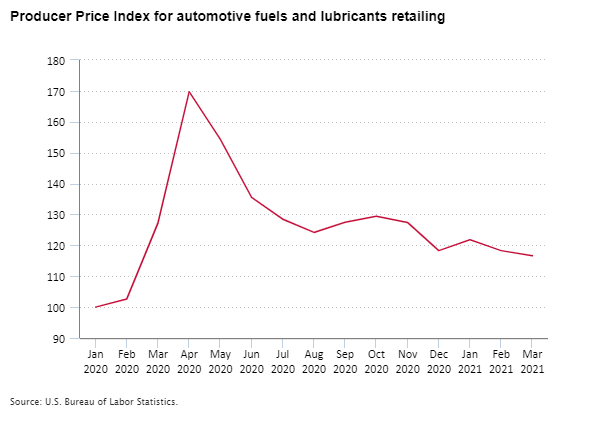
Editor’s note: Data for this chart are available in the table below.
Gasoline prices tend to be volatile, and large moves, such as this winter’s, occur often. Consumer gasoline prices rose 24.7 percent in the first 3 months of 2021. Since 2001, the CPI gasoline index has had six increases that large or larger in 3 months. The most recent instance of a larger increase over 3 months was a 26.4-percent increase from May to August 2009.
Over the past 4 months, the sharp rise in gasoline prices has contributed to increasing overall prices as measured by the CPI for all items. In each of the last 4 months, half or more of the monthly increase in the all-items index was due to the increase in gasoline prices. This means that, if the price of gasoline had been unchanged in each of these months, the overall CPI would have increased by less than half of the 1.5-percent increase over this period.
One way to strip out the effects of gasoline prices on overall prices is to look at prices for all items less energy. The following chart shows the monthly change in the CPI for all item and the CPI for all items less energy.
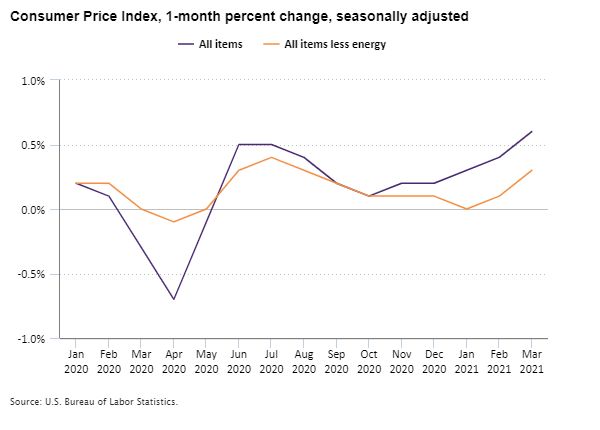
Editor’s note: Data for this chart are available in the table below.
From July through December 2020, the indexes moved similarly each month. That means energy price changes were close to the price changes of other items. The two indexes have diverged in the last 3 months, however, with the index for all items less energy increasing much less than the index for all items.
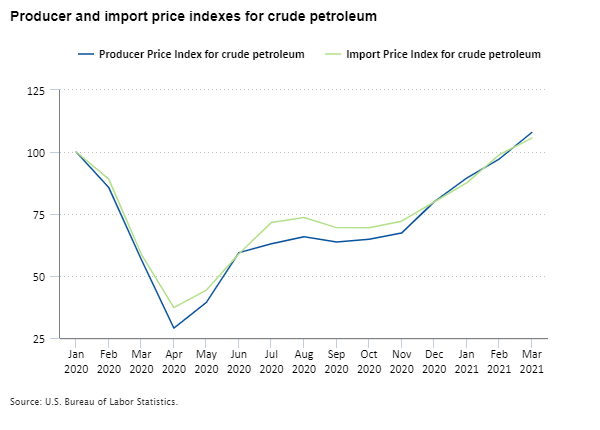
Crude oil prices have a large effect on gasoline prices. The following chart shows the changes in the PPI for crude petroleum and in the Import Price Index for crude petroleum since January 2020. The PPI measures price changes for domestic producers of crude oil, while the Import Price Index tracks price changes for oil purchased from foreign producers.
Editor’s note: Data for this chart are available in the table below.
Overall, producer prices and import prices for crude oil track closely together. Both declined sharply as the COVID-19 pandemic began and partly recovered through the early fall. From November 2020 to March 2021, both had large increases—60.3 percent for the PPI and 46.5 percent for import prices—and now exceed their January 2020 levels.
Market analysis by the Energy Information Administration identifies several contributors to recent oil and gas price increases. One is optimism over the economic recovery from the pandemic and expectations of increased energy demand as more people receive COVID-19 vaccinations. Another is the continued cooperation among members of the Organization of the Petroleum Exporting Countries and other oil-producing countries to limit crude oil production. Finally, in February, weather-related supply disruptions also contributed to price increases.
Although gasoline prices have increased sharply in recent months and have contributed to increases in overall consumer prices, gasoline prices are only just recovering January 2020 levels. Gasoline makes up only about 3 percent of the market basket for the CPI, and its share has been declining. Gasoline still is an important driver of changes in the overall index because of frequent large fluctuations in gas prices. Price changes in gasoline and crude oil can also affect the prices of other items because gas and oil are important for producing many goods and services.
| Month | Gasoline, all types | All items |
|---|---|---|
Oct 2020 | 0.7 | 0.1 |
Nov 2020 | 0.5 | 0.2 |
Dec 2020 | 5.2 | 0.2 |
Jan 2021 | 7.4 | 0.3 |
Feb 2021 | 6.4 | 0.4 |
Mar 2021 | 9.1 | 0.6 |
| Month | CPI for gasoline | PPI for gasoline |
|---|---|---|
Jan 2020 | 100.000 | 100.000 |
Feb 2020 | 95.766 | 97.003 |
Mar 2020 | 86.604 | 71.609 |
Apr 2020 | 69.955 | 32.440 |
May 2020 | 66.518 | 44.322 |
Jun 2020 | 73.410 | 61.409 |
Jul 2020 | 76.928 | 66.193 |
Aug 2020 | 78.576 | 67.192 |
Sep 2020 | 79.891 | 67.613 |
Oct 2020 | 80.482 | 68.559 |
Nov 2020 | 80.866 | 69.085 |
Dec 2020 | 85.066 | 78.181 |
Jan 2021 | 91.364 | 88.801 |
Feb 2021 | 97.221 | 100.421 |
Mar 2021 | 106.070 | 109.253 |
| Month | Index |
|---|---|
Jan 2020 | 100.000 |
Feb 2020 | 102.652 |
Mar 2020 | 127.281 |
Apr 2020 | 169.753 |
May 2020 | 154.292 |
Jun 2020 | 135.506 |
Jul 2020 | 128.449 |
Aug 2020 | 124.180 |
Sep 2020 | 127.506 |
Oct 2020 | 129.438 |
Nov 2020 | 127.416 |
Dec 2020 | 118.292 |
Jan 2021 | 121.798 |
Feb 2021 | 118.292 |
Mar 2021 | 116.629 |
| Month | All items | All items less energy |
|---|---|---|
Jan 2020 | 0.2 | 0.2 |
Feb 2020 | 0.1 | 0.2 |
Mar 2020 | -0.3 | 0.0 |
Apr 2020 | -0.7 | -0.1 |
May 2020 | -0.1 | 0.0 |
Jun 2020 | 0.5 | 0.3 |
Jul 2020 | 0.5 | 0.4 |
Aug 2020 | 0.4 | 0.3 |
Sep 2020 | 0.2 | 0.2 |
Oct 2020 | 0.1 | 0.1 |
Nov 2020 | 0.2 | 0.1 |
Dec 2020 | 0.2 | 0.1 |
Jan 2021 | 0.3 | 0.0 |
Feb 2021 | 0.4 | 0.1 |
Mar 2021 | 0.6 | 0.3 |
| Month | Producer Price Index for crude petroleum | Import Price Index for crude petroleum |
|---|---|---|
Jan 2020 | 100.000 | 100.000 |
Feb 2020 | 85.696 | 89.067 |
Mar 2020 | 56.585 | 58.776 |
Apr 2020 | 28.986 | 37.212 |
May 2020 | 39.382 | 44.333 |
Jun 2020 | 59.420 | 58.977 |
Jul 2020 | 63.012 | 71.615 |
Aug 2020 | 65.784 | 73.621 |
Sep 2020 | 63.705 | 69.509 |
Oct 2020 | 64.776 | 69.408 |
Nov 2020 | 67.297 | 72.116 |
Dec 2020 | 79.899 | 79.840 |
Jan 2021 | 89.477 | 87.563 |
Feb 2021 | 97.164 | 98.897 |
Mar 2021 | 107.876 | 105.617 |