
I know many of us are glad to see 2020 in the rearview mirror and have higher hopes for 2021. The COVID-19 pandemic has caused so much suffering and hardship for people in the United States and around the world. During these challenging times, it remains important to have good, reliable, timely data. Good data are essential for the public health response to the pandemic and for tracking its economic and social effects, as well as the progress toward recovery. Let’s reflect back on some of the historic measures we saw in 2020.
Throughout the pandemic, the BLS staff and our colleagues across the statistical community have remained on the job to meet the growing needs for high-quality data. We are thankful we have been able to keep working; millions of other people haven’t been so fortunate. In part this is due to the way our work life at BLS changed in 2020. Nearly the entire staff has teleworked full time since March. That means we have needed to figure out new ways to collaborate with each other to continue producing essential data about the economy. That change in work life also meant that many staff members faced the challenges of new care arrangements for young children, schooling—often online—for older children, and keeping all their loved ones safe and healthy.
When the pandemic began in March 2020, many consumers began avoiding stores, restaurants, and other public gatherings to reduce the risk of catching or spreading the virus that causes COVID-19. Many businesses and other organizations reduced their operations or closed completely. At the recommendation of public health authorities, many governors and other public leaders issued stay-at-home orders. The economic impact of COVID-19 was breathtaking in its speed and severity.
National employment data. The nation experienced steady employment growth in recent years; BLS recorded average monthly increases in nonfarm employment between about 170,000 and 200,000 from 2016 to 2019. January and February 2020 brought continued job gains before the bottom dropped out in March (down 1.7 million jobs) and especially in April (down 20.7 million). These were the two largest declines in history, dating to 1939. These declines were then followed by the 4 largest increases in history: 2.8 million, 4.8 million, 1.7 million, and 1.5 million. You have to go back to 1983 to find the next highest increase, 1,118,000. Employment in December 2020 was nearly 10 million lower than in February.
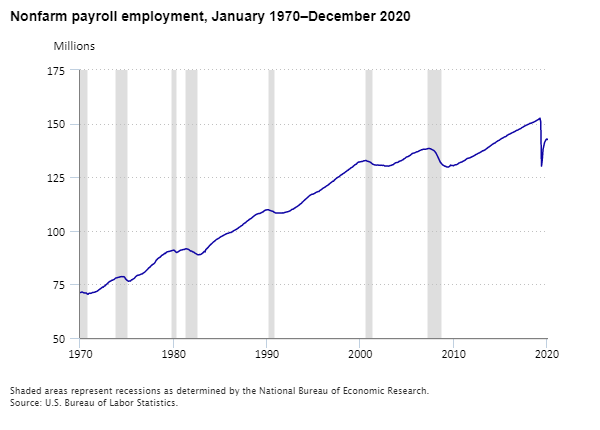
Editor’s note: Data for this chart are available in the table below.
National unemployment data. The year started with some record-low unemployment rates. The 3.5-percent unemployment rate in both January and February 2020 tied for the lowest rate since December 1969 (also 3.5 percent). The unemployment rates for several demographic groups were at or near their record lows. For example, the unemployment rate for African Americans in February 2020, at 6.0 percent, was close to the all-time low of 5.2 percent in August 2019.
Then came the pandemic in March 2020. The unemployment rate that month rose 0.9 percentage point to 4.4 percent. In April, the unemployment rate increased by 10.4 percentage points to 14.8 percent, the highest rate and largest one-month increase in history (dating to January 1948). Nearly all demographic groups experienced record-high unemployment rates in April; for example, the rate for Hispanics was a record 18.9 percent, after a record low of 4.0 percent in September 2019. And for the first time since data became available for both groups in 1973, the unemployment rate for Hispanics in April 2020 exceeded the rate for African Americans.
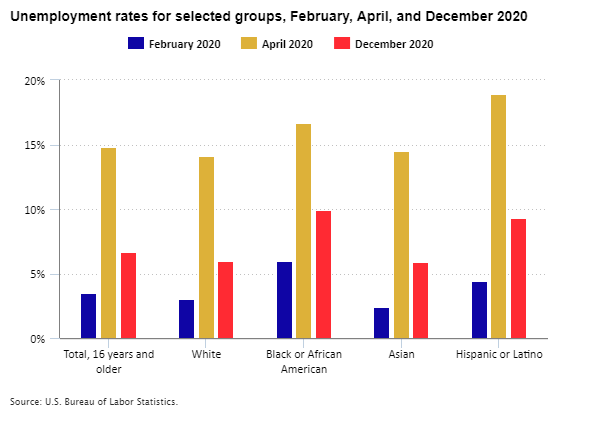
Editor’s note: Data for this chart are available in the table below.
State unemployment data. We see a similar pattern when looking at state unemployment rates, with record-setting lows early in 2020 followed by record-setting highs. In February, state unemployment rates ranged from a low of 2.2 percent in North Dakota to a high of 5.8 percent in Alaska, with 12 states at their historic lows that month. By April, rates had increased in all states, with 40 states and the District of Columbia setting new highs in that month, and another 7 states cresting in subsequent months. (The state data began in 1976.) State unemployment rates in April ranged from 8.3 percent in Connecticut to 30.1 percent in Nevada. Check out our animated map showing the rapid transformation of state unemployment rates.
Consumer price data. Beyond the job market, the pandemic had a big effect on other aspects of everyday life, including consumers’ buying habits. Toilet paper and wipes were disappearing from store shelves, while fewer people were commuting or traveling. Those trends were reflected in rapid changes in consumer prices.
One-month changes in the Consumer Price Index are typically 0.1 or 0.2 percent; the 0.8 percent decrease in April 2020, was the largest monthly decline since December 2008. The overall change included some large movements in both directions. For example, the price of gasoline declined 20.6 percent in April, the largest one-month decline since November 2008. In contrast, prices for food at home rose by 2.6 percent, the largest monthly increase since February 1974. Looking below the surface even further, several items experienced record one-month price changes, with some records going back over 50 years.
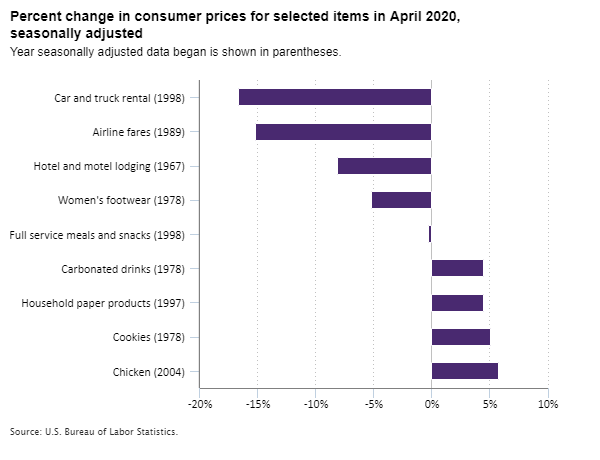
Editor’s note: Data for this chart are available in the table below.
Labor Productivity data. The BLS quarterly measure of labor productivity in the nonfarm business sector compares output to hours worked. If output rises more than hours worked, productivity increases. The pandemic saw large declines in both output and hours starting in mid-March. There was a small decline in labor productivity in the first quarter of 2020, down 0.3 percent, as output declined (-6.4 percent) slightly more than hours worked (-6.1 percent). While we had not experienced declining productivity in nearly 3 years, small increases or decreases in the quarterly change are common. The second quarter saw labor productivity soar by 10.6 percent, the largest increase since 1971, when productivity increased 12.3 percent in the first quarter. The second quarter 2020 increase reflected a greater decline in hours worked (-42.9 percent) than in output (-36.8 percent).
Since its beginnings in 1884, BLS has built consistent data to allow comparisons across the decades. Maintaining this history allows data users to quickly learn “when was the last time.” We also have collected and published new data specifically about the COVID-19 pandemic. Still to come, BLS will release more 2020 data in the coming year. Those new results will add to the unique story of the extraordinary 2020 economy.
| Month | Employment level | Over-the-month change |
|---|---|---|
Jan 1970 | 71,176,000 | -65,000 |
Feb 1970 | 71,305,000 | 129,000 |
Mar 1970 | 71,451,000 | 146,000 |
Apr 1970 | 71,348,000 | -103,000 |
May 1970 | 71,124,000 | -224,000 |
Jun 1970 | 71,029,000 | -95,000 |
Jul 1970 | 71,053,000 | 24,000 |
Aug 1970 | 70,937,000 | -116,000 |
Sep 1970 | 70,944,000 | 7,000 |
Oct 1970 | 70,521,000 | -423,000 |
Nov 1970 | 70,409,000 | -112,000 |
Dec 1970 | 70,792,000 | 383,000 |
Jan 1971 | 70,865,000 | 73,000 |
Feb 1971 | 70,807,000 | -58,000 |
Mar 1971 | 70,860,000 | 53,000 |
Apr 1971 | 71,036,000 | 176,000 |
May 1971 | 71,247,000 | 211,000 |
Jun 1971 | 71,254,000 | 7,000 |
Jul 1971 | 71,315,000 | 61,000 |
Aug 1971 | 71,373,000 | 58,000 |
Sep 1971 | 71,614,000 | 241,000 |
Oct 1971 | 71,642,000 | 28,000 |
Nov 1971 | 71,847,000 | 205,000 |
Dec 1971 | 72,109,000 | 262,000 |
Jan 1972 | 72,441,000 | 332,000 |
Feb 1972 | 72,648,000 | 207,000 |
Mar 1972 | 72,944,000 | 296,000 |
Apr 1972 | 73,162,000 | 218,000 |
May 1972 | 73,469,000 | 307,000 |
Jun 1972 | 73,758,000 | 289,000 |
Jul 1972 | 73,709,000 | -49,000 |
Aug 1972 | 74,141,000 | 432,000 |
Sep 1972 | 74,264,000 | 123,000 |
Oct 1972 | 74,674,000 | 410,000 |
Nov 1972 | 74,973,000 | 299,000 |
Dec 1972 | 75,268,000 | 295,000 |
Jan 1973 | 75,617,000 | 349,000 |
Feb 1973 | 76,014,000 | 397,000 |
Mar 1973 | 76,284,000 | 270,000 |
Apr 1973 | 76,455,000 | 171,000 |
May 1973 | 76,648,000 | 193,000 |
Jun 1973 | 76,887,000 | 239,000 |
Jul 1973 | 76,913,000 | 26,000 |
Aug 1973 | 77,168,000 | 255,000 |
Sep 1973 | 77,276,000 | 108,000 |
Oct 1973 | 77,607,000 | 331,000 |
Nov 1973 | 77,920,000 | 313,000 |
Dec 1973 | 78,031,000 | 111,000 |
Jan 1974 | 78,100,000 | 69,000 |
Feb 1974 | 78,254,000 | 154,000 |
Mar 1974 | 78,296,000 | 42,000 |
Apr 1974 | 78,382,000 | 86,000 |
May 1974 | 78,549,000 | 167,000 |
Jun 1974 | 78,604,000 | 55,000 |
Jul 1974 | 78,636,000 | 32,000 |
Aug 1974 | 78,619,000 | -17,000 |
Sep 1974 | 78,610,000 | -9,000 |
Oct 1974 | 78,630,000 | 20,000 |
Nov 1974 | 78,265,000 | -365,000 |
Dec 1974 | 77,652,000 | -613,000 |
Jan 1975 | 77,293,000 | -359,000 |
Feb 1975 | 76,918,000 | -375,000 |
Mar 1975 | 76,648,000 | -270,000 |
Apr 1975 | 76,460,000 | -188,000 |
May 1975 | 76,624,000 | 164,000 |
Jun 1975 | 76,521,000 | -103,000 |
Jul 1975 | 76,770,000 | 249,000 |
Aug 1975 | 77,153,000 | 383,000 |
Sep 1975 | 77,228,000 | 75,000 |
Oct 1975 | 77,540,000 | 312,000 |
Nov 1975 | 77,685,000 | 145,000 |
Dec 1975 | 78,017,000 | 332,000 |
Jan 1976 | 78,503,000 | 486,000 |
Feb 1976 | 78,816,000 | 313,000 |
Mar 1976 | 79,048,000 | 232,000 |
Apr 1976 | 79,292,000 | 244,000 |
May 1976 | 79,312,000 | 20,000 |
Jun 1976 | 79,376,000 | 64,000 |
Jul 1976 | 79,547,000 | 171,000 |
Aug 1976 | 79,704,000 | 157,000 |
Sep 1976 | 79,892,000 | 188,000 |
Oct 1976 | 79,911,000 | 19,000 |
Nov 1976 | 80,240,000 | 329,000 |
Dec 1976 | 80,448,000 | 208,000 |
Jan 1977 | 80,690,000 | 242,000 |
Feb 1977 | 80,988,000 | 298,000 |
Mar 1977 | 81,391,000 | 403,000 |
Apr 1977 | 81,728,000 | 337,000 |
May 1977 | 82,088,000 | 360,000 |
Jun 1977 | 82,488,000 | 400,000 |
Jul 1977 | 82,834,000 | 346,000 |
Aug 1977 | 83,075,000 | 241,000 |
Sep 1977 | 83,532,000 | 457,000 |
Oct 1977 | 83,800,000 | 268,000 |
Nov 1977 | 84,173,000 | 373,000 |
Dec 1977 | 84,410,000 | 237,000 |
Jan 1978 | 84,594,000 | 184,000 |
Feb 1978 | 84,948,000 | 354,000 |
Mar 1978 | 85,460,000 | 512,000 |
Apr 1978 | 86,162,000 | 702,000 |
May 1978 | 86,509,000 | 347,000 |
Jun 1978 | 86,950,000 | 441,000 |
Jul 1978 | 87,204,000 | 254,000 |
Aug 1978 | 87,483,000 | 279,000 |
Sep 1978 | 87,621,000 | 138,000 |
Oct 1978 | 87,956,000 | 335,000 |
Nov 1978 | 88,391,000 | 435,000 |
Dec 1978 | 88,671,000 | 280,000 |
Jan 1979 | 88,808,000 | 137,000 |
Feb 1979 | 89,055,000 | 247,000 |
Mar 1979 | 89,479,000 | 424,000 |
Apr 1979 | 89,417,000 | -62,000 |
May 1979 | 89,789,000 | 372,000 |
Jun 1979 | 90,108,000 | 319,000 |
Jul 1979 | 90,217,000 | 109,000 |
Aug 1979 | 90,300,000 | 83,000 |
Sep 1979 | 90,327,000 | 27,000 |
Oct 1979 | 90,481,000 | 154,000 |
Nov 1979 | 90,573,000 | 92,000 |
Dec 1979 | 90,672,000 | 99,000 |
Jan 1980 | 90,800,000 | 128,000 |
Feb 1980 | 90,883,000 | 83,000 |
Mar 1980 | 90,994,000 | 111,000 |
Apr 1980 | 90,849,000 | -145,000 |
May 1980 | 90,420,000 | -429,000 |
Jun 1980 | 90,101,000 | -319,000 |
Jul 1980 | 89,840,000 | -261,000 |
Aug 1980 | 90,099,000 | 259,000 |
Sep 1980 | 90,213,000 | 114,000 |
Oct 1980 | 90,490,000 | 277,000 |
Nov 1980 | 90,747,000 | 257,000 |
Dec 1980 | 90,943,000 | 196,000 |
Jan 1981 | 91,033,000 | 90,000 |
Feb 1981 | 91,105,000 | 72,000 |
Mar 1981 | 91,210,000 | 105,000 |
Apr 1981 | 91,283,000 | 73,000 |
May 1981 | 91,296,000 | 13,000 |
Jun 1981 | 91,490,000 | 194,000 |
Jul 1981 | 91,601,000 | 111,000 |
Aug 1981 | 91,565,000 | -36,000 |
Sep 1981 | 91,477,000 | -88,000 |
Oct 1981 | 91,380,000 | -97,000 |
Nov 1981 | 91,171,000 | -209,000 |
Dec 1981 | 90,895,000 | -276,000 |
Jan 1982 | 90,565,000 | -330,000 |
Feb 1982 | 90,563,000 | -2,000 |
Mar 1982 | 90,434,000 | -129,000 |
Apr 1982 | 90,150,000 | -284,000 |
May 1982 | 90,107,000 | -43,000 |
Jun 1982 | 89,865,000 | -242,000 |
Jul 1982 | 89,521,000 | -344,000 |
Aug 1982 | 89,363,000 | -158,000 |
Sep 1982 | 89,183,000 | -180,000 |
Oct 1982 | 88,907,000 | -276,000 |
Nov 1982 | 88,786,000 | -121,000 |
Dec 1982 | 88,771,000 | -15,000 |
Jan 1983 | 88,990,000 | 219,000 |
Feb 1983 | 88,917,000 | -73,000 |
Mar 1983 | 89,090,000 | 173,000 |
Apr 1983 | 89,364,000 | 274,000 |
May 1983 | 89,644,000 | 280,000 |
Jun 1983 | 90,021,000 | 377,000 |
Jul 1983 | 90,437,000 | 416,000 |
Aug 1983 | 90,129,000 | -308,000 |
Sep 1983 | 91,247,000 | 1,118,000 |
Oct 1983 | 91,520,000 | 273,000 |
Nov 1983 | 91,875,000 | 355,000 |
Dec 1983 | 92,230,000 | 355,000 |
Jan 1984 | 92,673,000 | 443,000 |
Feb 1984 | 93,157,000 | 484,000 |
Mar 1984 | 93,429,000 | 272,000 |
Apr 1984 | 93,792,000 | 363,000 |
May 1984 | 94,098,000 | 306,000 |
Jun 1984 | 94,479,000 | 381,000 |
Jul 1984 | 94,789,000 | 310,000 |
Aug 1984 | 95,032,000 | 243,000 |
Sep 1984 | 95,344,000 | 312,000 |
Oct 1984 | 95,629,000 | 285,000 |
Nov 1984 | 95,982,000 | 353,000 |
Dec 1984 | 96,107,000 | 125,000 |
Jan 1985 | 96,372,000 | 265,000 |
Feb 1985 | 96,503,000 | 131,000 |
Mar 1985 | 96,842,000 | 339,000 |
Apr 1985 | 97,038,000 | 196,000 |
May 1985 | 97,312,000 | 274,000 |
Jun 1985 | 97,459,000 | 147,000 |
Jul 1985 | 97,648,000 | 189,000 |
Aug 1985 | 97,840,000 | 192,000 |
Sep 1985 | 98,045,000 | 205,000 |
Oct 1985 | 98,233,000 | 188,000 |
Nov 1985 | 98,443,000 | 210,000 |
Dec 1985 | 98,609,000 | 166,000 |
Jan 1986 | 98,732,000 | 123,000 |
Feb 1986 | 98,847,000 | 115,000 |
Mar 1986 | 98,934,000 | 87,000 |
Apr 1986 | 99,121,000 | 187,000 |
May 1986 | 99,248,000 | 127,000 |
Jun 1986 | 99,155,000 | -93,000 |
Jul 1986 | 99,473,000 | 318,000 |
Aug 1986 | 99,588,000 | 115,000 |
Sep 1986 | 99,934,000 | 346,000 |
Oct 1986 | 100,121,000 | 187,000 |
Nov 1986 | 100,308,000 | 187,000 |
Dec 1986 | 100,509,000 | 201,000 |
Jan 1987 | 100,678,000 | 169,000 |
Feb 1987 | 100,919,000 | 241,000 |
Mar 1987 | 101,164,000 | 245,000 |
Apr 1987 | 101,499,000 | 335,000 |
May 1987 | 101,728,000 | 229,000 |
Jun 1987 | 101,900,000 | 172,000 |
Jul 1987 | 102,247,000 | 347,000 |
Aug 1987 | 102,420,000 | 173,000 |
Sep 1987 | 102,647,000 | 227,000 |
Oct 1987 | 103,138,000 | 491,000 |
Nov 1987 | 103,372,000 | 234,000 |
Dec 1987 | 103,661,000 | 289,000 |
Jan 1988 | 103,753,000 | 92,000 |
Feb 1988 | 104,214,000 | 461,000 |
Mar 1988 | 104,489,000 | 275,000 |
Apr 1988 | 104,732,000 | 243,000 |
May 1988 | 104,962,000 | 230,000 |
Jun 1988 | 105,326,000 | 364,000 |
Jul 1988 | 105,550,000 | 224,000 |
Aug 1988 | 105,674,000 | 124,000 |
Sep 1988 | 106,013,000 | 339,000 |
Oct 1988 | 106,276,000 | 263,000 |
Nov 1988 | 106,617,000 | 341,000 |
Dec 1988 | 106,898,000 | 281,000 |
Jan 1989 | 107,161,000 | 263,000 |
Feb 1989 | 107,427,000 | 266,000 |
Mar 1989 | 107,621,000 | 194,000 |
Apr 1989 | 107,791,000 | 170,000 |
May 1989 | 107,913,000 | 122,000 |
Jun 1989 | 108,027,000 | 114,000 |
Jul 1989 | 108,069,000 | 42,000 |
Aug 1989 | 108,120,000 | 51,000 |
Sep 1989 | 108,369,000 | 249,000 |
Oct 1989 | 108,476,000 | 107,000 |
Nov 1989 | 108,752,000 | 276,000 |
Dec 1989 | 108,836,000 | 84,000 |
Jan 1990 | 109,199,000 | 363,000 |
Feb 1990 | 109,435,000 | 236,000 |
Mar 1990 | 109,644,000 | 209,000 |
Apr 1990 | 109,686,000 | 42,000 |
May 1990 | 109,839,000 | 153,000 |
Jun 1990 | 109,856,000 | 17,000 |
Jul 1990 | 109,824,000 | -32,000 |
Aug 1990 | 109,616,000 | -208,000 |
Sep 1990 | 109,518,000 | -98,000 |
Oct 1990 | 109,367,000 | -151,000 |
Nov 1990 | 109,214,000 | -153,000 |
Dec 1990 | 109,166,000 | -48,000 |
Jan 1991 | 109,055,000 | -111,000 |
Feb 1991 | 108,734,000 | -321,000 |
Mar 1991 | 108,574,000 | -160,000 |
Apr 1991 | 108,364,000 | -210,000 |
May 1991 | 108,249,000 | -115,000 |
Jun 1991 | 108,334,000 | 85,000 |
Jul 1991 | 108,292,000 | -42,000 |
Aug 1991 | 108,310,000 | 18,000 |
Sep 1991 | 108,336,000 | 26,000 |
Oct 1991 | 108,357,000 | 21,000 |
Nov 1991 | 108,296,000 | -61,000 |
Dec 1991 | 108,328,000 | 32,000 |
Jan 1992 | 108,369,000 | 41,000 |
Feb 1992 | 108,311,000 | -58,000 |
Mar 1992 | 108,365,000 | 54,000 |
Apr 1992 | 108,519,000 | 154,000 |
May 1992 | 108,649,000 | 130,000 |
Jun 1992 | 108,715,000 | 66,000 |
Jul 1992 | 108,793,000 | 78,000 |
Aug 1992 | 108,925,000 | 132,000 |
Sep 1992 | 108,959,000 | 34,000 |
Oct 1992 | 109,139,000 | 180,000 |
Nov 1992 | 109,272,000 | 133,000 |
Dec 1992 | 109,495,000 | 223,000 |
Jan 1993 | 109,794,000 | 299,000 |
Feb 1993 | 110,044,000 | 250,000 |
Mar 1993 | 109,994,000 | -50,000 |
Apr 1993 | 110,296,000 | 302,000 |
May 1993 | 110,568,000 | 272,000 |
Jun 1993 | 110,749,000 | 181,000 |
Jul 1993 | 111,055,000 | 306,000 |
Aug 1993 | 111,206,000 | 151,000 |
Sep 1993 | 111,448,000 | 242,000 |
Oct 1993 | 111,733,000 | 285,000 |
Nov 1993 | 111,984,000 | 251,000 |
Dec 1993 | 112,314,000 | 330,000 |
Jan 1994 | 112,595,000 | 281,000 |
Feb 1994 | 112,781,000 | 186,000 |
Mar 1994 | 113,242,000 | 461,000 |
Apr 1994 | 113,586,000 | 344,000 |
May 1994 | 113,921,000 | 335,000 |
Jun 1994 | 114,238,000 | 317,000 |
Jul 1994 | 114,610,000 | 372,000 |
Aug 1994 | 114,896,000 | 286,000 |
Sep 1994 | 115,247,000 | 351,000 |
Oct 1994 | 115,458,000 | 211,000 |
Nov 1994 | 115,869,000 | 411,000 |
Dec 1994 | 116,165,000 | 296,000 |
Jan 1995 | 116,501,000 | 336,000 |
Feb 1995 | 116,697,000 | 196,000 |
Mar 1995 | 116,907,000 | 210,000 |
Apr 1995 | 117,069,000 | 162,000 |
May 1995 | 117,049,000 | -20,000 |
Jun 1995 | 117,286,000 | 237,000 |
Jul 1995 | 117,380,000 | 94,000 |
Aug 1995 | 117,634,000 | 254,000 |
Sep 1995 | 117,875,000 | 241,000 |
Oct 1995 | 118,031,000 | 156,000 |
Nov 1995 | 118,175,000 | 144,000 |
Dec 1995 | 118,320,000 | 145,000 |
Jan 1996 | 118,316,000 | -4,000 |
Feb 1996 | 118,739,000 | 423,000 |
Mar 1996 | 118,993,000 | 254,000 |
Apr 1996 | 119,158,000 | 165,000 |
May 1996 | 119,486,000 | 328,000 |
Jun 1996 | 119,769,000 | 283,000 |
Jul 1996 | 120,015,000 | 246,000 |
Aug 1996 | 120,199,000 | 184,000 |
Sep 1996 | 120,410,000 | 211,000 |
Oct 1996 | 120,665,000 | 255,000 |
Nov 1996 | 120,961,000 | 296,000 |
Dec 1996 | 121,143,000 | 182,000 |
Jan 1997 | 121,363,000 | 220,000 |
Feb 1997 | 121,675,000 | 312,000 |
Mar 1997 | 121,990,000 | 315,000 |
Apr 1997 | 122,286,000 | 296,000 |
May 1997 | 122,546,000 | 260,000 |
Jun 1997 | 122,814,000 | 268,000 |
Jul 1997 | 123,111,000 | 297,000 |
Aug 1997 | 123,093,000 | -18,000 |
Sep 1997 | 123,585,000 | 492,000 |
Oct 1997 | 123,929,000 | 344,000 |
Nov 1997 | 124,235,000 | 306,000 |
Dec 1997 | 124,549,000 | 314,000 |
Jan 1998 | 124,812,000 | 263,000 |
Feb 1998 | 125,016,000 | 204,000 |
Mar 1998 | 125,164,000 | 148,000 |
Apr 1998 | 125,442,000 | 278,000 |
May 1998 | 125,844,000 | 402,000 |
Jun 1998 | 126,076,000 | 232,000 |
Jul 1998 | 126,205,000 | 129,000 |
Aug 1998 | 126,544,000 | 339,000 |
Sep 1998 | 126,752,000 | 208,000 |
Oct 1998 | 126,954,000 | 202,000 |
Nov 1998 | 127,231,000 | 277,000 |
Dec 1998 | 127,596,000 | 365,000 |
Jan 1999 | 127,702,000 | 106,000 |
Feb 1999 | 128,120,000 | 418,000 |
Mar 1999 | 128,227,000 | 107,000 |
Apr 1999 | 128,597,000 | 370,000 |
May 1999 | 128,808,000 | 211,000 |
Jun 1999 | 129,089,000 | 281,000 |
Jul 1999 | 129,414,000 | 325,000 |
Aug 1999 | 129,569,000 | 155,000 |
Sep 1999 | 129,772,000 | 203,000 |
Oct 1999 | 130,177,000 | 405,000 |
Nov 1999 | 130,466,000 | 289,000 |
Dec 1999 | 130,772,000 | 306,000 |
Jan 2000 | 131,005,000 | 233,000 |
Feb 2000 | 131,124,000 | 119,000 |
Mar 2000 | 131,596,000 | 472,000 |
Apr 2000 | 131,888,000 | 292,000 |
May 2000 | 132,105,000 | 217,000 |
Jun 2000 | 132,061,000 | -44,000 |
Jul 2000 | 132,236,000 | 175,000 |
Aug 2000 | 132,230,000 | -6,000 |
Sep 2000 | 132,353,000 | 123,000 |
Oct 2000 | 132,351,000 | -2,000 |
Nov 2000 | 132,556,000 | 205,000 |
Dec 2000 | 132,709,000 | 153,000 |
Jan 2001 | 132,698,000 | -11,000 |
Feb 2001 | 132,789,000 | 91,000 |
Mar 2001 | 132,747,000 | -42,000 |
Apr 2001 | 132,463,000 | -284,000 |
May 2001 | 132,410,000 | -53,000 |
Jun 2001 | 132,299,000 | -111,000 |
Jul 2001 | 132,177,000 | -122,000 |
Aug 2001 | 132,028,000 | -149,000 |
Sep 2001 | 131,771,000 | -257,000 |
Oct 2001 | 131,454,000 | -317,000 |
Nov 2001 | 131,142,000 | -312,000 |
Dec 2001 | 130,982,000 | -160,000 |
Jan 2002 | 130,852,000 | -130,000 |
Feb 2002 | 130,736,000 | -116,000 |
Mar 2002 | 130,717,000 | -19,000 |
Apr 2002 | 130,623,000 | -94,000 |
May 2002 | 130,634,000 | 11,000 |
Jun 2002 | 130,684,000 | 50,000 |
Jul 2002 | 130,590,000 | -94,000 |
Aug 2002 | 130,587,000 | -3,000 |
Sep 2002 | 130,501,000 | -86,000 |
Oct 2002 | 130,628,000 | 127,000 |
Nov 2002 | 130,615,000 | -13,000 |
Dec 2002 | 130,472,000 | -143,000 |
Jan 2003 | 130,580,000 | 108,000 |
Feb 2003 | 130,444,000 | -136,000 |
Mar 2003 | 130,232,000 | -212,000 |
Apr 2003 | 130,177,000 | -55,000 |
May 2003 | 130,196,000 | 19,000 |
Jun 2003 | 130,194,000 | -2,000 |
Jul 2003 | 130,191,000 | -3,000 |
Aug 2003 | 130,149,000 | -42,000 |
Sep 2003 | 130,254,000 | 105,000 |
Oct 2003 | 130,454,000 | 200,000 |
Nov 2003 | 130,474,000 | 20,000 |
Dec 2003 | 130,588,000 | 114,000 |
Jan 2004 | 130,769,000 | 181,000 |
Feb 2004 | 130,825,000 | 56,000 |
Mar 2004 | 131,142,000 | 317,000 |
Apr 2004 | 131,411,000 | 269,000 |
May 2004 | 131,694,000 | 283,000 |
Jun 2004 | 131,793,000 | 99,000 |
Jul 2004 | 131,848,000 | 55,000 |
Aug 2004 | 131,937,000 | 89,000 |
Sep 2004 | 132,093,000 | 156,000 |
Oct 2004 | 132,447,000 | 354,000 |
Nov 2004 | 132,503,000 | 56,000 |
Dec 2004 | 132,624,000 | 121,000 |
Jan 2005 | 132,774,000 | 150,000 |
Feb 2005 | 133,032,000 | 258,000 |
Mar 2005 | 133,156,000 | 124,000 |
Apr 2005 | 133,518,000 | 362,000 |
May 2005 | 133,690,000 | 172,000 |
Jun 2005 | 133,942,000 | 252,000 |
Jul 2005 | 134,296,000 | 354,000 |
Aug 2005 | 134,498,000 | 202,000 |
Sep 2005 | 134,566,000 | 68,000 |
Oct 2005 | 134,655,000 | 89,000 |
Nov 2005 | 134,993,000 | 338,000 |
Dec 2005 | 135,149,000 | 156,000 |
Jan 2006 | 135,429,000 | 280,000 |
Feb 2006 | 135,737,000 | 308,000 |
Mar 2006 | 136,047,000 | 310,000 |
Apr 2006 | 136,205,000 | 158,000 |
May 2006 | 136,244,000 | 39,000 |
Jun 2006 | 136,325,000 | 81,000 |
Jul 2006 | 136,520,000 | 195,000 |
Aug 2006 | 136,694,000 | 174,000 |
Sep 2006 | 136,843,000 | 149,000 |
Oct 2006 | 136,852,000 | 9,000 |
Nov 2006 | 137,063,000 | 211,000 |
Dec 2006 | 137,249,000 | 186,000 |
Jan 2007 | 137,477,000 | 228,000 |
Feb 2007 | 137,558,000 | 81,000 |
Mar 2007 | 137,793,000 | 235,000 |
Apr 2007 | 137,842,000 | 49,000 |
May 2007 | 137,993,000 | 151,000 |
Jun 2007 | 138,069,000 | 76,000 |
Jul 2007 | 138,038,000 | -31,000 |
Aug 2007 | 138,015,000 | -23,000 |
Sep 2007 | 138,095,000 | 80,000 |
Oct 2007 | 138,174,000 | 79,000 |
Nov 2007 | 138,284,000 | 110,000 |
Dec 2007 | 138,392,000 | 108,000 |
Jan 2008 | 138,403,000 | 11,000 |
Feb 2008 | 138,324,000 | -79,000 |
Mar 2008 | 138,275,000 | -49,000 |
Apr 2008 | 138,035,000 | -240,000 |
May 2008 | 137,858,000 | -177,000 |
Jun 2008 | 137,687,000 | -171,000 |
Jul 2008 | 137,491,000 | -196,000 |
Aug 2008 | 137,213,000 | -278,000 |
Sep 2008 | 136,753,000 | -460,000 |
Oct 2008 | 136,272,000 | -481,000 |
Nov 2008 | 135,545,000 | -727,000 |
Dec 2008 | 134,839,000 | -706,000 |
Jan 2009 | 134,055,000 | -784,000 |
Feb 2009 | 133,312,000 | -743,000 |
Mar 2009 | 132,512,000 | -800,000 |
Apr 2009 | 131,817,000 | -695,000 |
May 2009 | 131,475,000 | -342,000 |
Jun 2009 | 131,008,000 | -467,000 |
Jul 2009 | 130,668,000 | -340,000 |
Aug 2009 | 130,485,000 | -183,000 |
Sep 2009 | 130,244,000 | -241,000 |
Oct 2009 | 130,045,000 | -199,000 |
Nov 2009 | 130,057,000 | 12,000 |
Dec 2009 | 129,788,000 | -269,000 |
Jan 2010 | 129,790,000 | 2,000 |
Feb 2010 | 129,698,000 | -92,000 |
Mar 2010 | 129,879,000 | 181,000 |
Apr 2010 | 130,110,000 | 231,000 |
May 2010 | 130,650,000 | 540,000 |
Jun 2010 | 130,511,000 | -139,000 |
Jul 2010 | 130,427,000 | -84,000 |
Aug 2010 | 130,422,000 | -5,000 |
Sep 2010 | 130,357,000 | -65,000 |
Oct 2010 | 130,625,000 | 268,000 |
Nov 2010 | 130,750,000 | 125,000 |
Dec 2010 | 130,822,000 | 72,000 |
Jan 2011 | 130,841,000 | 19,000 |
Feb 2011 | 131,053,000 | 212,000 |
Mar 2011 | 131,288,000 | 235,000 |
Apr 2011 | 131,602,000 | 314,000 |
May 2011 | 131,703,000 | 101,000 |
Jun 2011 | 131,939,000 | 236,000 |
Jul 2011 | 131,999,000 | 60,000 |
Aug 2011 | 132,125,000 | 126,000 |
Sep 2011 | 132,358,000 | 233,000 |
Oct 2011 | 132,562,000 | 204,000 |
Nov 2011 | 132,694,000 | 132,000 |
Dec 2011 | 132,896,000 | 202,000 |
Jan 2012 | 133,250,000 | 354,000 |
Feb 2012 | 133,512,000 | 262,000 |
Mar 2012 | 133,752,000 | 240,000 |
Apr 2012 | 133,834,000 | 82,000 |
May 2012 | 133,934,000 | 100,000 |
Jun 2012 | 134,007,000 | 73,000 |
Jul 2012 | 134,159,000 | 152,000 |
Aug 2012 | 134,331,000 | 172,000 |
Sep 2012 | 134,518,000 | 187,000 |
Oct 2012 | 134,677,000 | 159,000 |
Nov 2012 | 134,833,000 | 156,000 |
Dec 2012 | 135,072,000 | 239,000 |
Jan 2013 | 135,263,000 | 191,000 |
Feb 2013 | 135,541,000 | 278,000 |
Mar 2013 | 135,680,000 | 139,000 |
Apr 2013 | 135,871,000 | 191,000 |
May 2013 | 136,093,000 | 222,000 |
Jun 2013 | 136,274,000 | 181,000 |
Jul 2013 | 136,386,000 | 112,000 |
Aug 2013 | 136,628,000 | 242,000 |
Sep 2013 | 136,815,000 | 187,000 |
Oct 2013 | 137,040,000 | 225,000 |
Nov 2013 | 137,304,000 | 264,000 |
Dec 2013 | 137,373,000 | 69,000 |
Jan 2014 | 137,548,000 | 175,000 |
Feb 2014 | 137,714,000 | 166,000 |
Mar 2014 | 137,968,000 | 254,000 |
Apr 2014 | 138,293,000 | 325,000 |
May 2014 | 138,511,000 | 218,000 |
Jun 2014 | 138,837,000 | 326,000 |
Jul 2014 | 139,069,000 | 232,000 |
Aug 2014 | 139,257,000 | 188,000 |
Sep 2014 | 139,566,000 | 309,000 |
Oct 2014 | 139,818,000 | 252,000 |
Nov 2014 | 140,109,000 | 291,000 |
Dec 2014 | 140,377,000 | 268,000 |
Jan 2015 | 140,568,000 | 191,000 |
Feb 2015 | 140,839,000 | 271,000 |
Mar 2015 | 140,910,000 | 71,000 |
Apr 2015 | 141,194,000 | 284,000 |
May 2015 | 141,525,000 | 331,000 |
Jun 2015 | 141,699,000 | 174,000 |
Jul 2015 | 142,001,000 | 302,000 |
Aug 2015 | 142,126,000 | 125,000 |
Sep 2015 | 142,281,000 | 155,000 |
Oct 2015 | 142,587,000 | 306,000 |
Nov 2015 | 142,824,000 | 237,000 |
Dec 2015 | 143,097,000 | 273,000 |
Jan 2016 | 143,205,000 | 108,000 |
Feb 2016 | 143,417,000 | 212,000 |
Mar 2016 | 143,654,000 | 237,000 |
Apr 2016 | 143,851,000 | 197,000 |
May 2016 | 143,892,000 | 41,000 |
Jun 2016 | 144,150,000 | 258,000 |
Jul 2016 | 144,521,000 | 371,000 |
Aug 2016 | 144,664,000 | 143,000 |
Sep 2016 | 144,953,000 | 289,000 |
Oct 2016 | 145,071,000 | 118,000 |
Nov 2016 | 145,201,000 | 130,000 |
Dec 2016 | 145,415,000 | 214,000 |
Jan 2017 | 145,612,000 | 197,000 |
Feb 2017 | 145,795,000 | 183,000 |
Mar 2017 | 145,934,000 | 139,000 |
Apr 2017 | 146,154,000 | 220,000 |
May 2017 | 146,295,000 | 141,000 |
Jun 2017 | 146,506,000 | 211,000 |
Jul 2017 | 146,734,000 | 228,000 |
Aug 2017 | 146,924,000 | 190,000 |
Sep 2017 | 146,966,000 | 42,000 |
Oct 2017 | 147,215,000 | 249,000 |
Nov 2017 | 147,411,000 | 196,000 |
Dec 2017 | 147,590,000 | 179,000 |
Jan 2018 | 147,671,000 | 81,000 |
Feb 2018 | 148,049,000 | 378,000 |
Mar 2018 | 148,244,000 | 195,000 |
Apr 2018 | 148,397,000 | 153,000 |
May 2018 | 148,667,000 | 270,000 |
Jun 2018 | 148,881,000 | 214,000 |
Jul 2018 | 149,030,000 | 149,000 |
Aug 2018 | 149,259,000 | 229,000 |
Sep 2018 | 149,364,000 | 105,000 |
Oct 2018 | 149,576,000 | 212,000 |
Nov 2018 | 149,668,000 | 92,000 |
Dec 2018 | 149,908,000 | 240,000 |
Jan 2019 | 150,145,000 | 237,000 |
Feb 2019 | 150,095,000 | -50,000 |
Mar 2019 | 150,263,000 | 168,000 |
Apr 2019 | 150,482,000 | 219,000 |
May 2019 | 150,545,000 | 63,000 |
Jun 2019 | 150,720,000 | 175,000 |
Jul 2019 | 150,913,000 | 193,000 |
Aug 2019 | 151,108,000 | 195,000 |
Sep 2019 | 151,329,000 | 221,000 |
Oct 2019 | 151,524,000 | 195,000 |
Nov 2019 | 151,758,000 | 234,000 |
Dec 2019 | 151,919,000 | 161,000 |
Jan 2020 | 152,234,000 | 315,000 |
Feb 2020 | 152,523,000 | 289,000 |
Mar 2020 | 150,840,000 | -1,683,000 |
Apr 2020 | 130,161,000 | -20,679,000 |
May 2020 | 132,994,000 | 2,833,000 |
Jun 2020 | 137,840,000 | 4,846,000 |
Jul 2020 | 139,566,000 | 1,726,000 |
Aug 2020 | 141,149,000 | 1,583,000 |
Sep 2020 | 141,865,000 | 716,000 |
Oct 2020 | 142,545,000 | 680,000 |
Nov 2020 | 142,809,000 | 264,000 |
Dec 2020 | 142,582,000 | -227,000 |
| Race and Hispanic or Latino ethnicity | February 2020 | April 2020 | December 2020 |
|---|---|---|---|
Total, 16 years and older | 3.5 | 14.8 | 6.7 |
White | 3.0 | 14.1 | 6.0 |
Black or African American | 6.0 | 16.7 | 9.9 |
Asian | 2.4 | 14.5 | 5.9 |
Hispanic or Latino | 4.4 | 18.9 | 9.3 |
| Expenditure category | Percent change |
|---|---|
Car and truck rental (1998) | -16.6 |
Airline fares (1989) | -15.2 |
Hotel and motel lodging (1967) | -8.1 |
Women’s footwear (1978) | -5.2 |
Full service meals and snacks (1998) | -0.3 |
Carbonated drinks (1978) | 4.5 |
Household paper products (1997) | 4.5 |
Cookies (1978) | 5.1 |
Chicken (2004) | 5.8 |